AnalyzeGating
AnalyzeGating[dataObject]⟹groupData
filters and/or groups multi dimensional scatter plot data by manual gating or algorithmic clustering.
Details
- A gate consists of one or more polygons lying in two dimensions, and an indicator specifying whether the points inside the polygons should be included or excluded from the grouping.
- When specifying gates manually for data[FlowCytometry], the format for a single gate is <|Channels -> {channelX, channelY}, Dimensions -> {dimensionX, dimensionY}, Polygon -> Valid2DPolygon, Action -> Include|Exclude|>}.
- Use Alt+left-click to add polygon corner points in the Gating app. Points can then be dragged to change the shape of the polygon.
- KMeans clusters data into k clusters by recursively performing the following steps. First, assign each point to the cluster whose mean yields the least within-cluster sum of squares. Next, calculate the new means to be the centroids of the points in the new clusters.
- KMerge is a method for post processing data that has been clustered using KMeans. The general idea is that KMeans cannot create clusters in the shape of cell populations. Instead one tries to represent a population with several clusters. KMerge then takes clusters that are in the same population and joins them together. Clusters can only be merged after an initial clustering has been performed.
- Quadrant clustering is a method where the user clusters the data into four clusters with respect to the user defined quadrant and does not use a distance metric.
- Manual grouping is a method when user specifies a list of polygons, data points in each polygon forms a cluster while data points ouside of all the polygons forms one cluster. When a data point falls in the overlapping area, it belongs to the cluster generated by the poygon that comes first.
- ManhattanDistance, EuclideanDistance, SquaredEuclideanDistance are the distance metrics commonly used on Flow Cytometry data.
-
ClusterChannelsAnsDimensionsLengthMismatch ClusterChannels and ClusterDimensions are of different length. The shortter one will be padded right to match the longer one. IllegalDimensions At least one of the specified dimensions and channels are not available in this data. IllegalGate At least one of the specified `1` gate(s) is illegal. Possible reasons: 1. Gate defined in unavailable Channels or Dimensions; 2. polygon not defined in 2D; 3. polygon not defined with at least 3 coordinates; 4. points that are used in polygon definition is collinear. NoData The SLL Object you entered has no data associated with it that can be clusterd NoDataForGating No data is selected from the gating step. NotArray The data entered was not an array so it cannot be gated. An Array must have the same number of elements in each row. NotEnoughClusters There are not enough initial clusters to perform merging. NumberOfGroups should be at least 3, and no larger than NumberOfMergedGroups . NotEnoughPoints Some of the clusters being input into KMerge are too small. Try using fewer initial clusters.
Input

Output

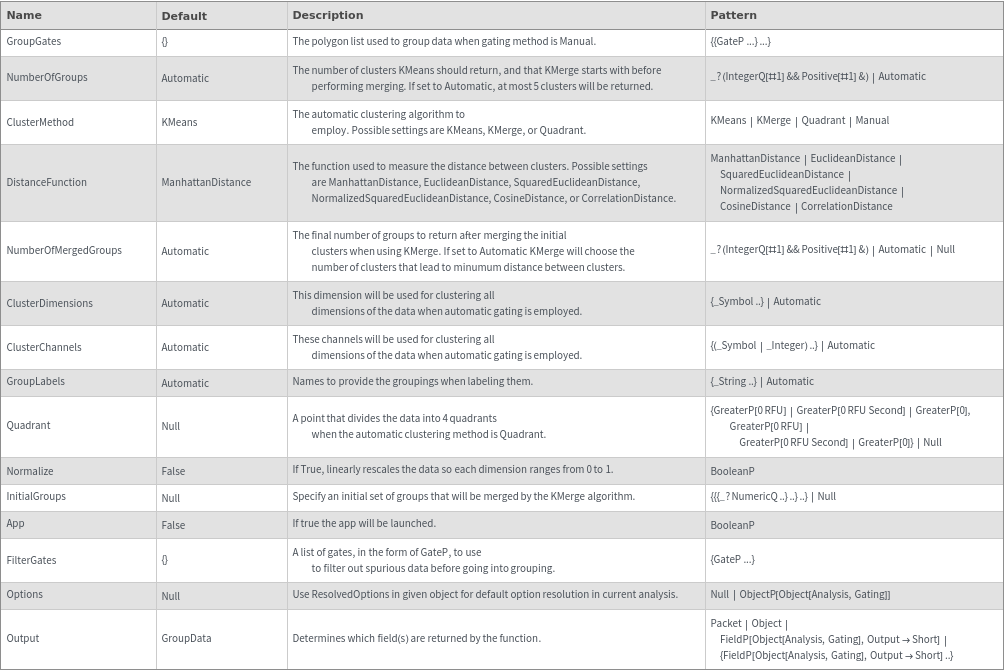
General Options
Messages
Examples
Basic Examples (3)
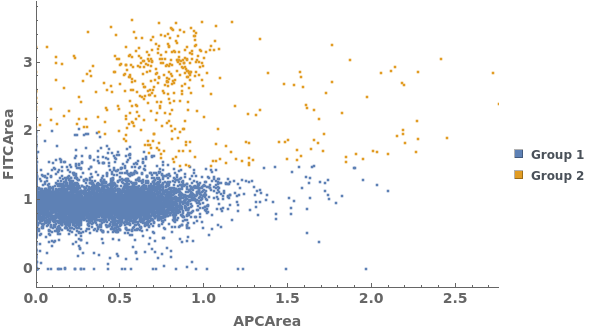
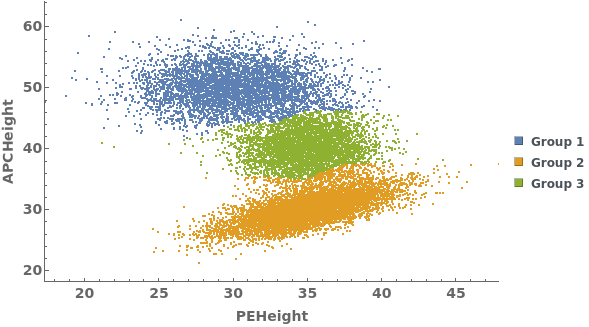
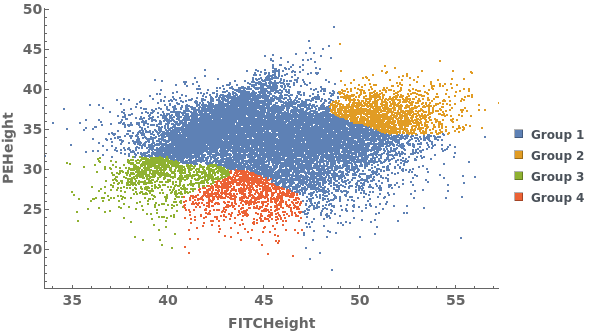
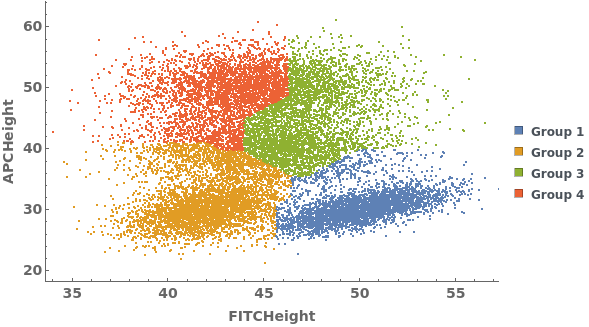
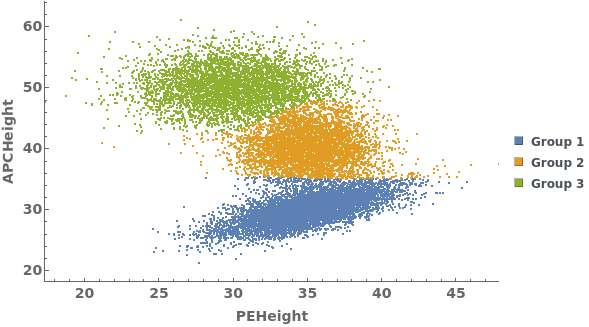
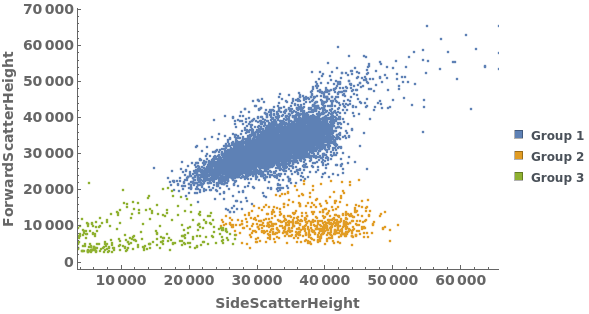
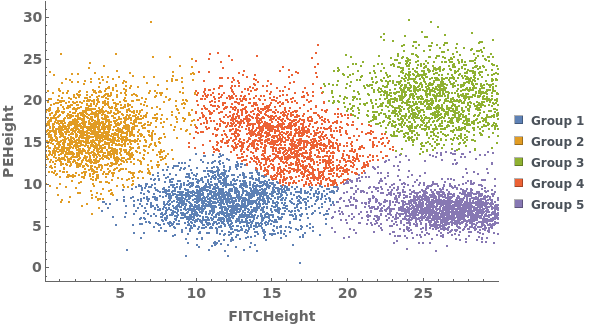
Gating Analysis can be used to autotmatically break flow cytometry data up into groups of closely located data points:


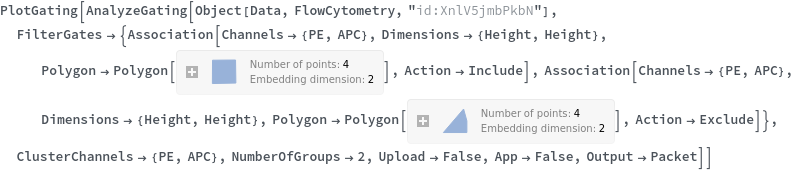
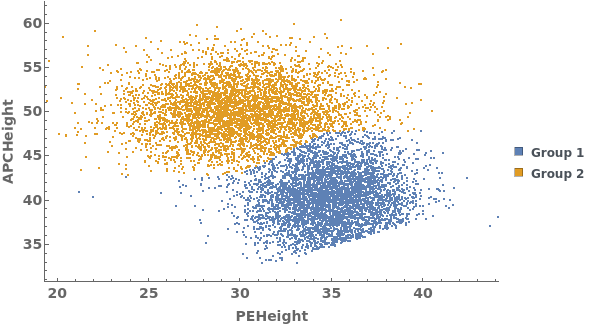
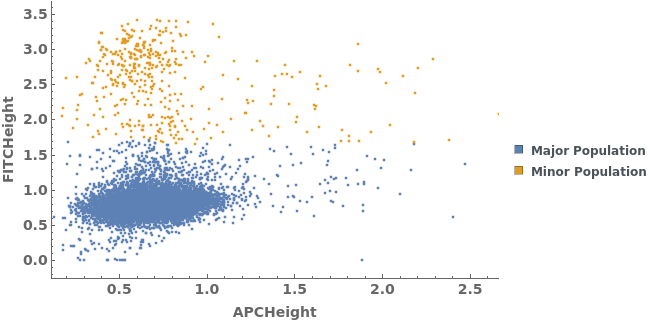
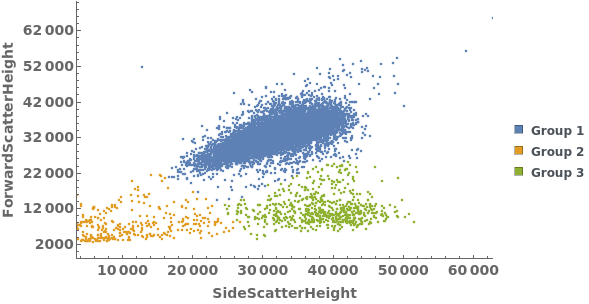
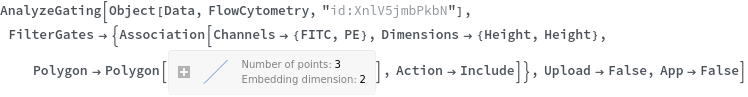
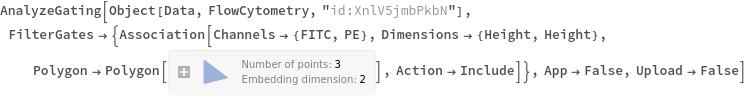
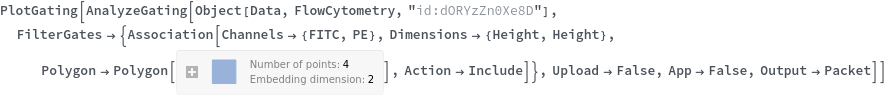
Data can be filtered using manual gating wth the FilterGates option before performing automatic clustering or manual gating to generate groupings:
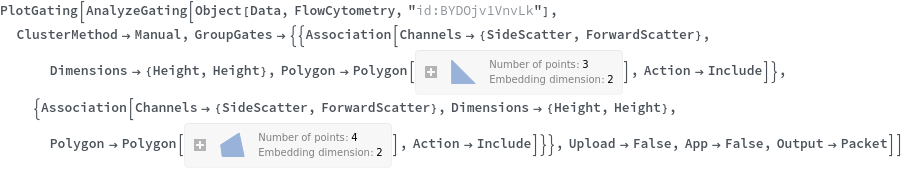
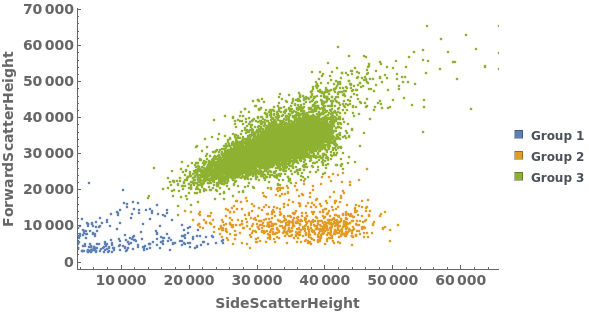
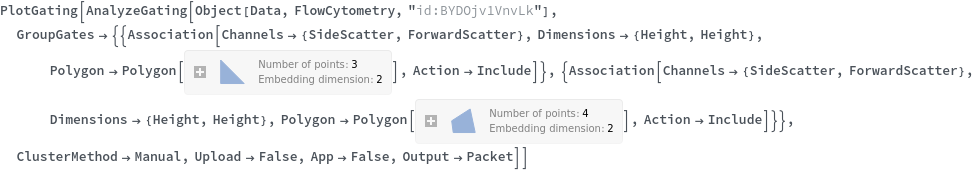
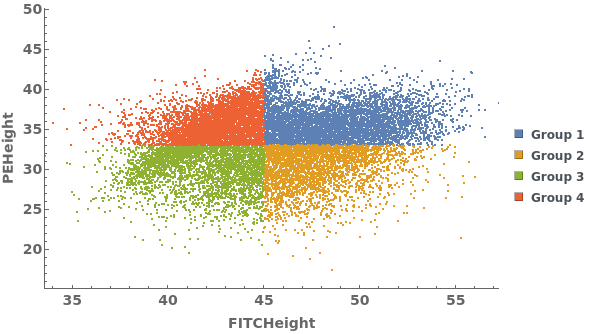
Data can be grouped manually by specifying lists of gates using the GroupGates option: