AnalyzePeaks
AnalyzePeaks[data]⟹positions
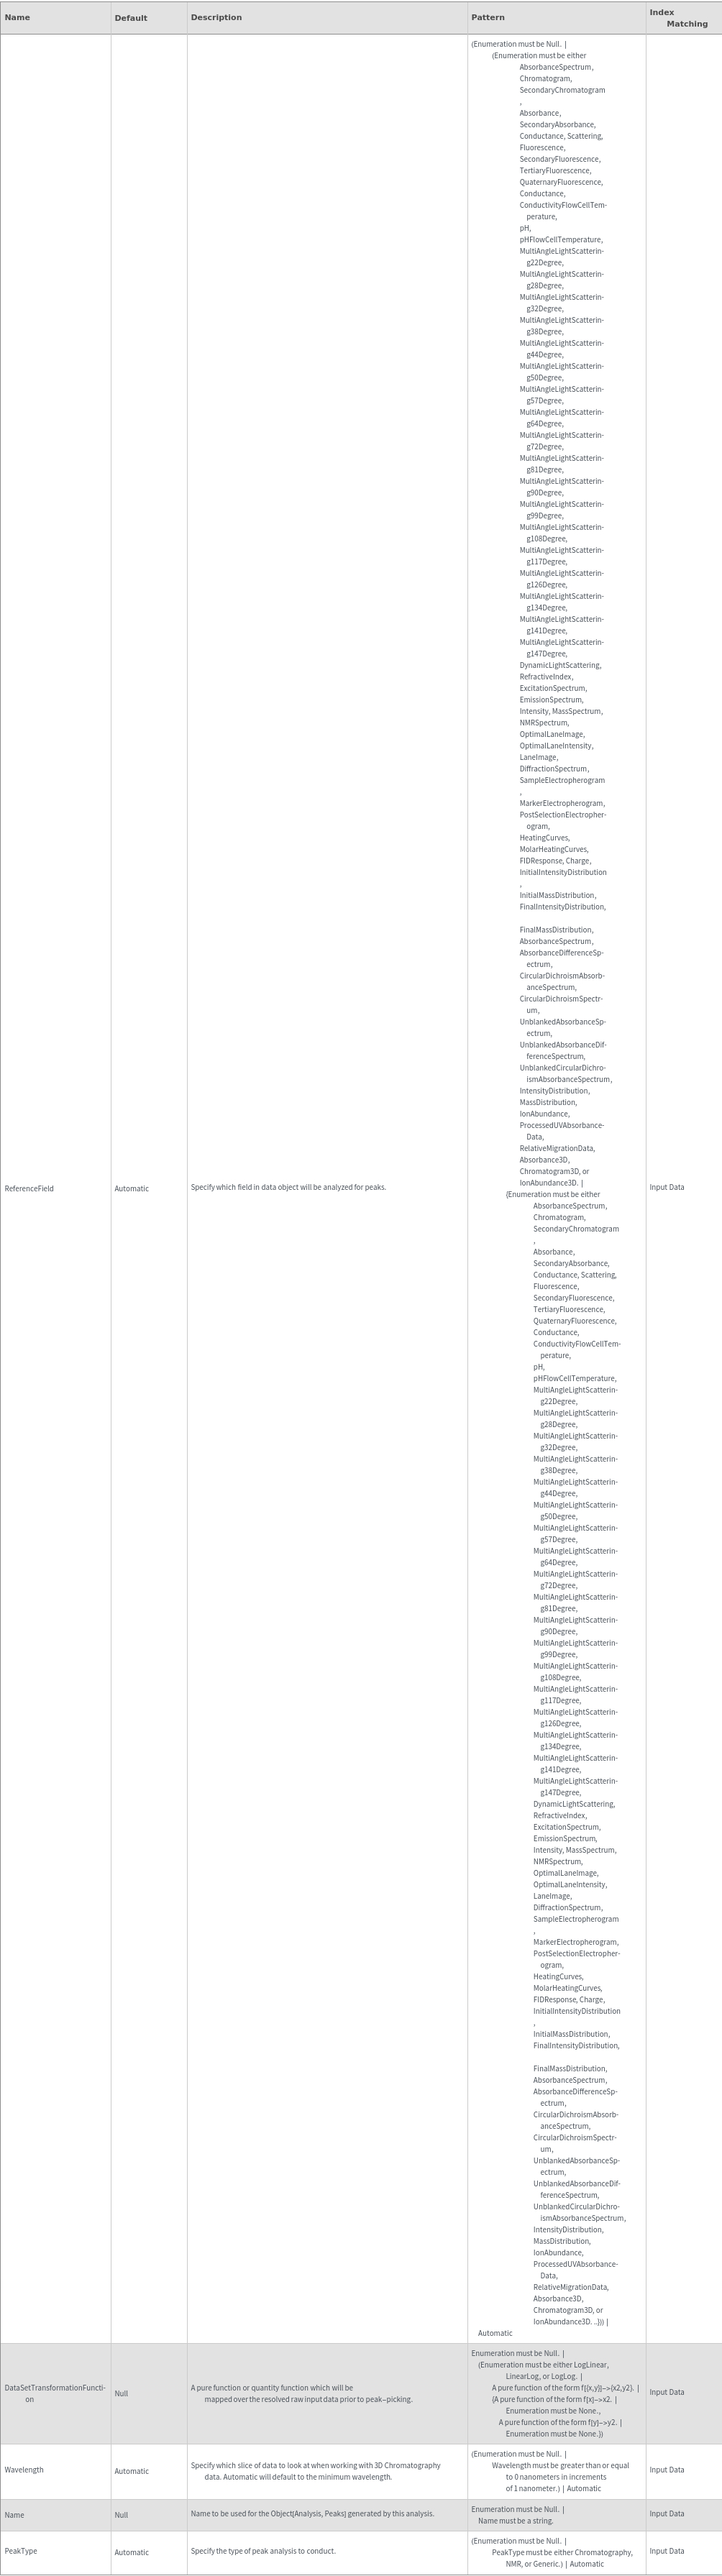
finds peaks in the data contained in the field defined by the ReferenceField option in the given data object.
AnalyzePeaks[protocol]⟹{positions..}
picks peaks in all data objects linked to given protocol.
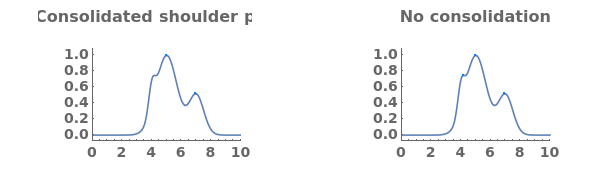
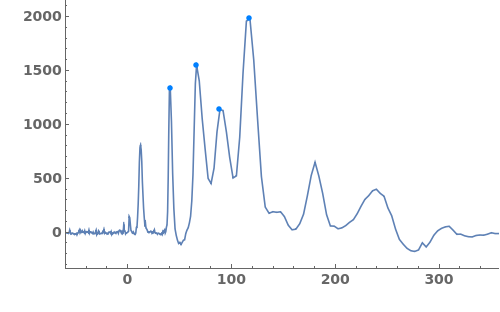
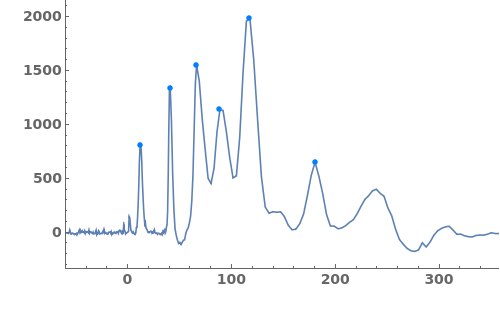
AnalyzePeaks[xy]⟹positions
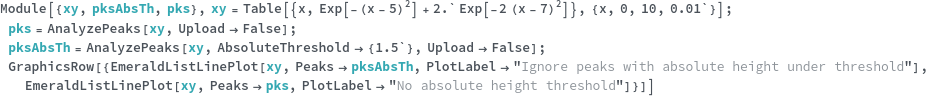
finds peaks in the data xy, and computes peak properties such as Position, Height, Width, and Area.
Details
- Each peak found is parameterized by its Position, Height, Width, Area, PeakRangeStart, PeakRangeEnd, WidthRangeStart, WidthRangeEnd, BaselineIntercept, and BaselineSlope.
- Peaks are returned sorted by increasing Position.
- Peak parameters are calculated following USP guidelines: Object[Report,Literature,"id:bq9LA0JX8vKv"].
- PeakResolution is calculated as 1.18(tR2 − tR1)/(W[1,h/2] + W[2,h/2]), where tR1 and tR2 are retention times and W[1,h/2] and W[2,h/2] are Width at half height.
- HalfHeightNumberOfPlates is calculated as 5.54(tR/W[h/2])^2, where tR is retention time and W[h/2] is Width at half height.
- TangentNumberOfPlates is calculated as 16.0(tR/tW)^2, where tR is retention time and tW is the tangent peak width.
- TailingFactor is calculated as W0.05/2f, where W0.05 is width at 5% height and f is the distance between the leading edge and the peak maximum at 5% height.
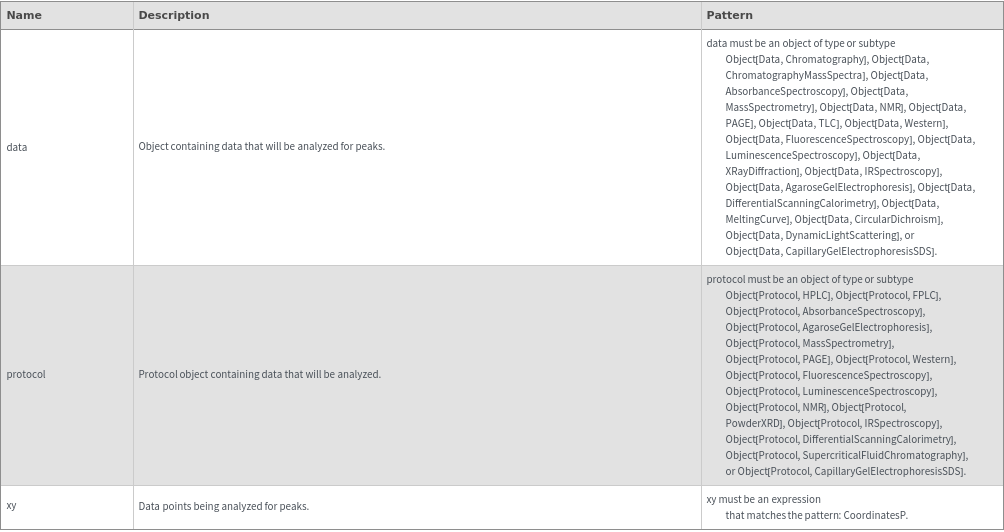
Input
Output

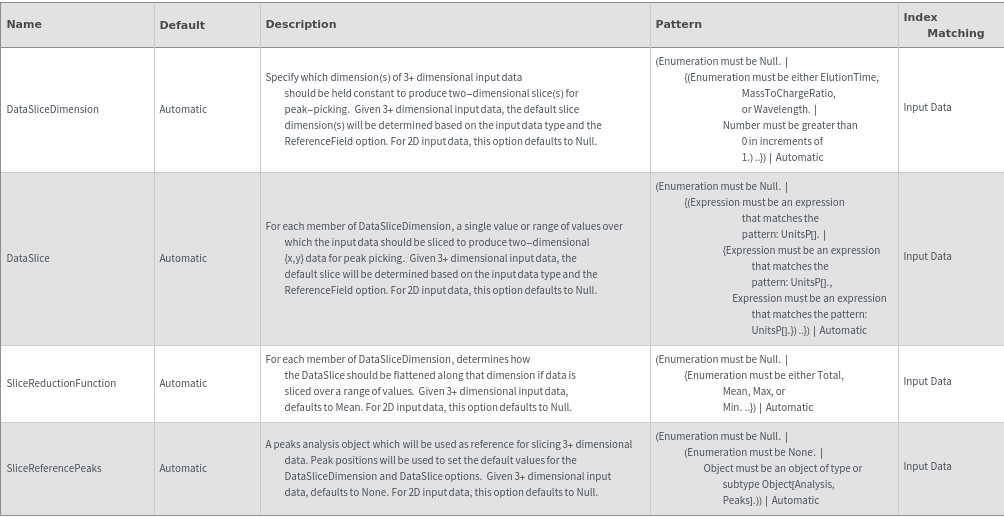
Data Slicing Options
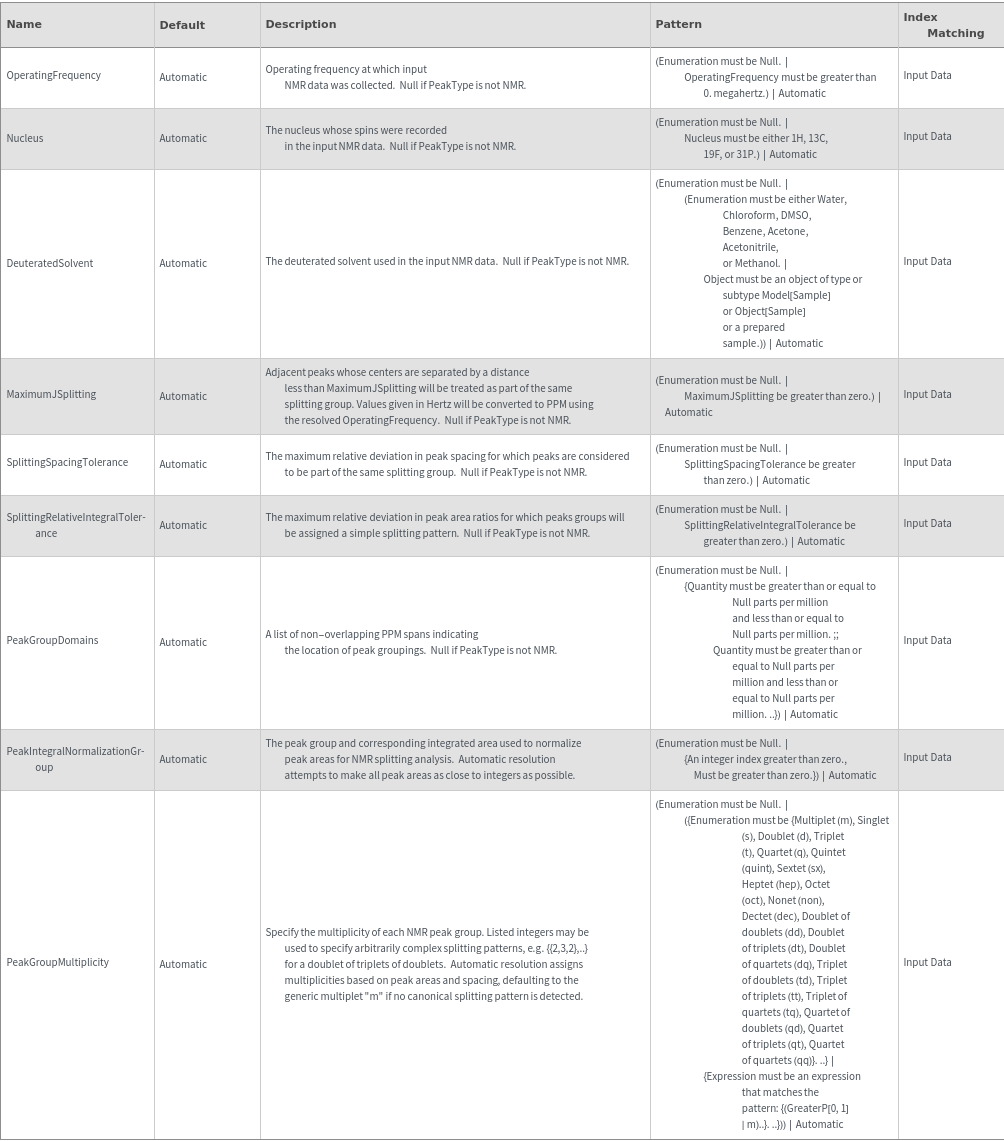
NMR Peak Splitting Options
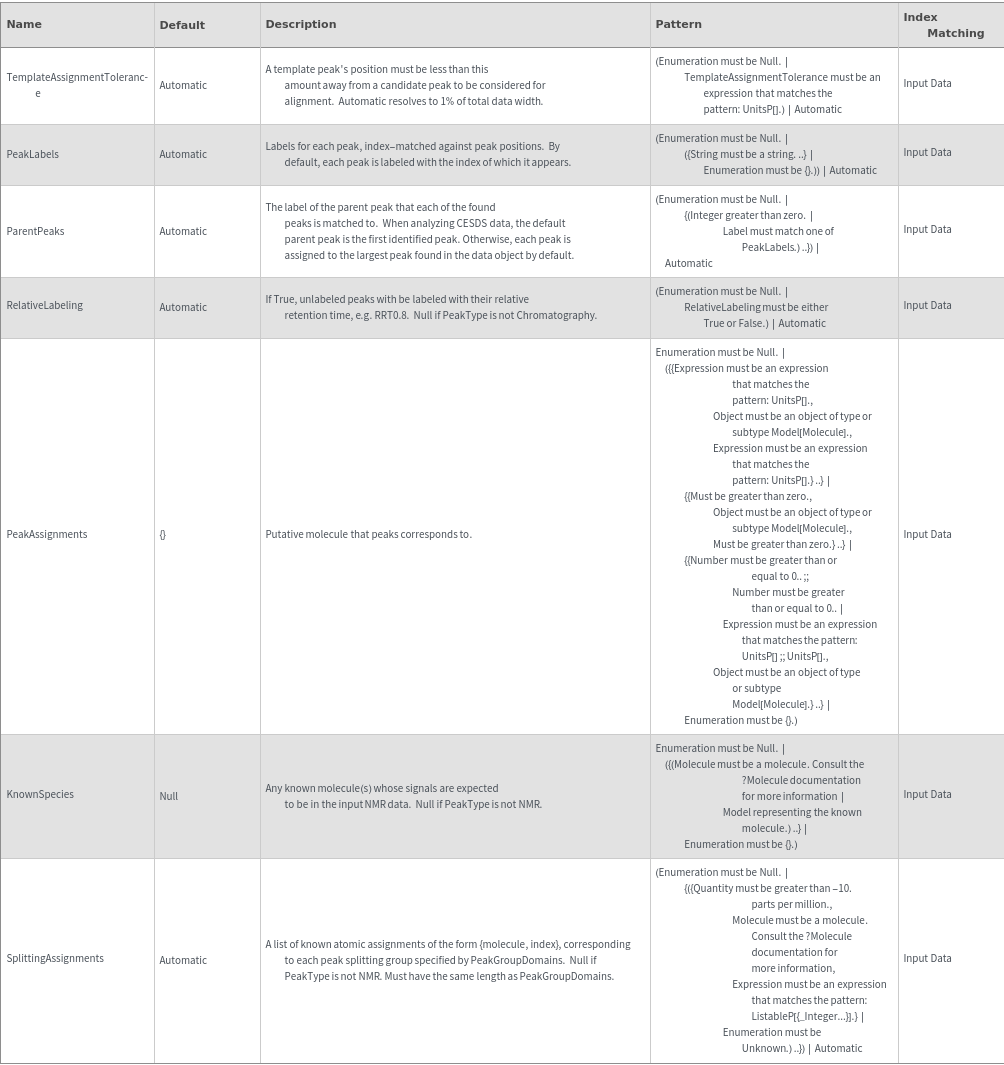
Peak Assignment Options
General Options
Method Options
Examples


Additional Examples (20)
Input types (9)


NMR Peak Splitting (8)
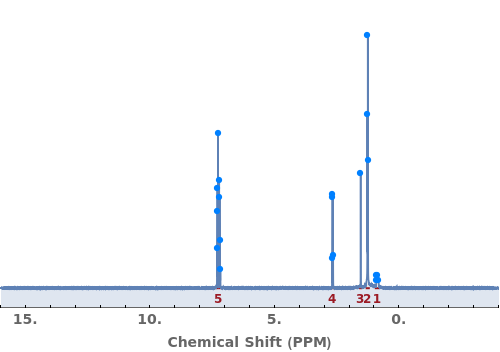
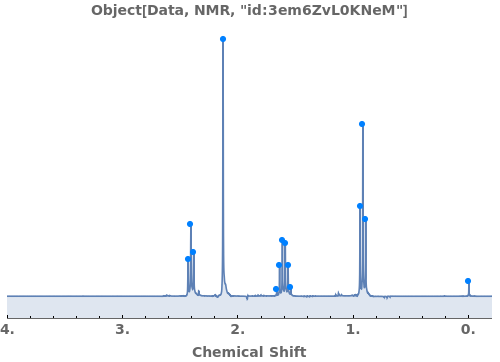
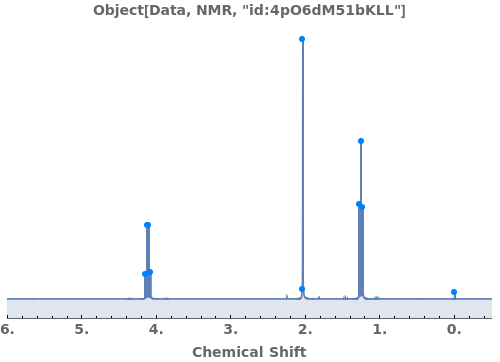
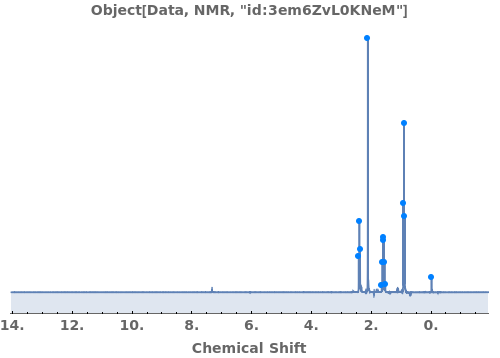
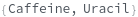
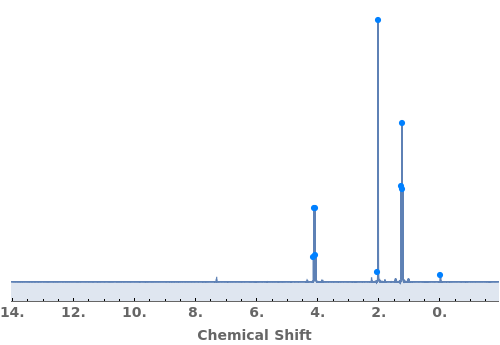
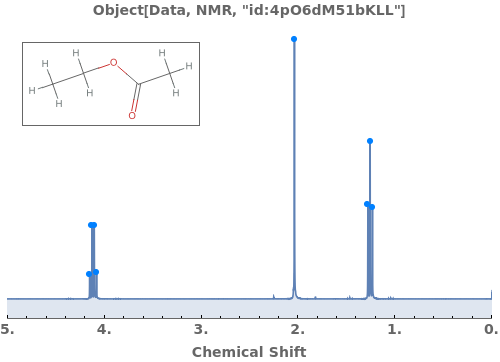
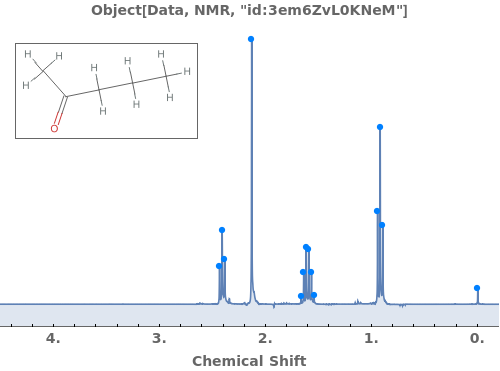
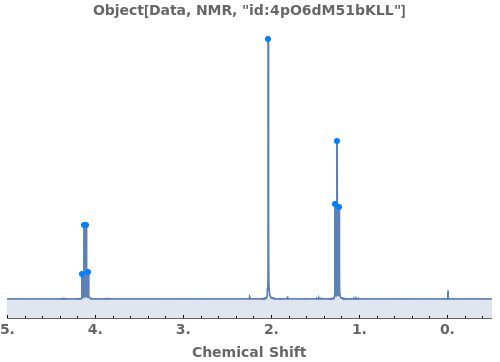
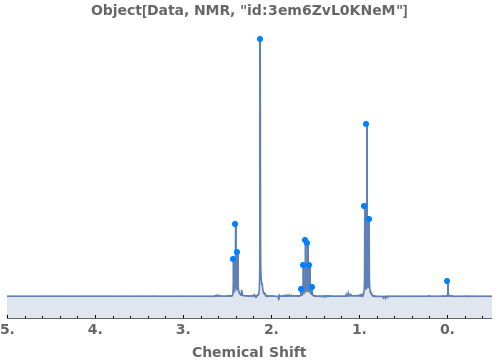
Automatically identify peak splittings in NMR data:

Override the automatic assignment of Peak Group 3 as a sextet by explicitly setting it as a generic multiplet:

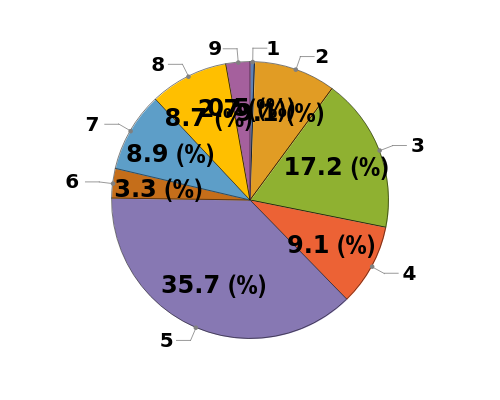
Normalize peak areas by fixing peak group 3 to a relative area of 4.0:

Adjust splitting tolerances to determine how peak groups are automatically assigned. If the tolerances are reduced to zero, all grouped peaks will be labeled as generic multiplets:

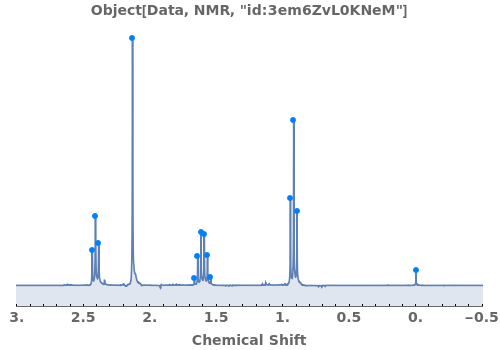
Provide a molecule or molecule(s) in KnownSpecies to automatially assign peaks to atoms in each molecule:

Explicitly specify SplittingAssignments to override automatic assignments:

Adjust peak-picking options to exclude solvent peak and ensure all peaks are selected:

Adjust the MaximumJSplitting and specify PeakGroupDomains to determine how peaks are automatically grouped:


Options (71)
Baseline (5)
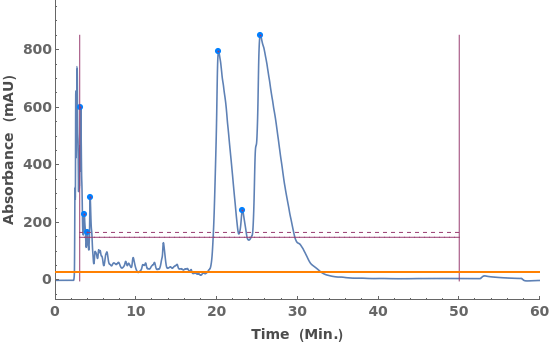
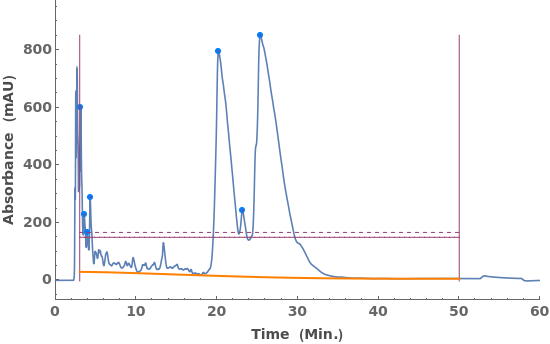
Fit a globally constant baseline:

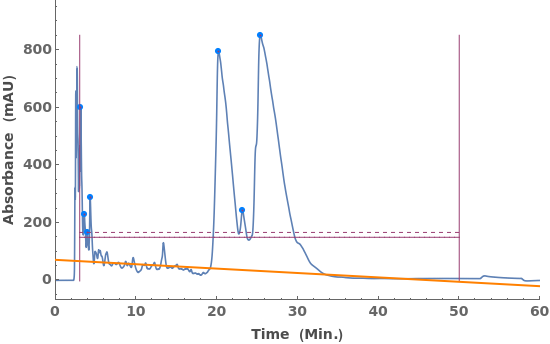
Fit a globally linear baseline:

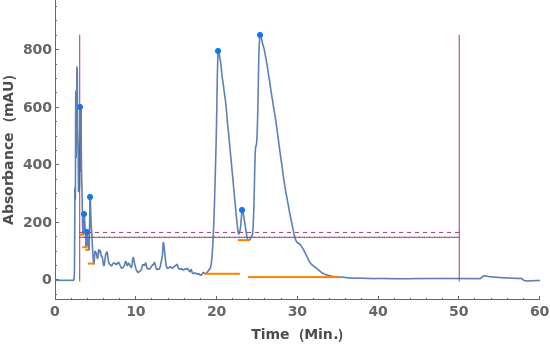
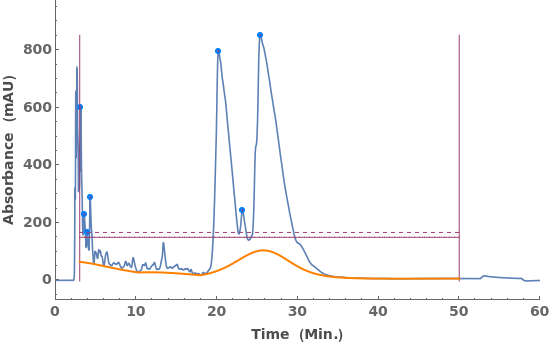
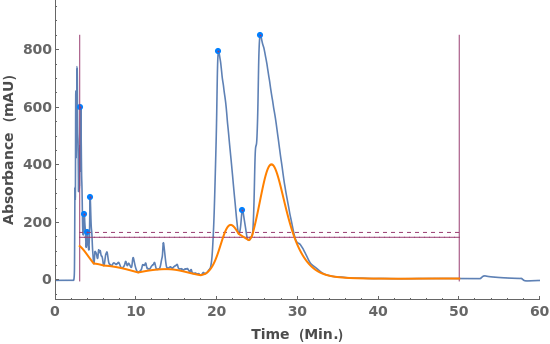
Fit locally constant baselines, obtained from the minimum edge of each peak:

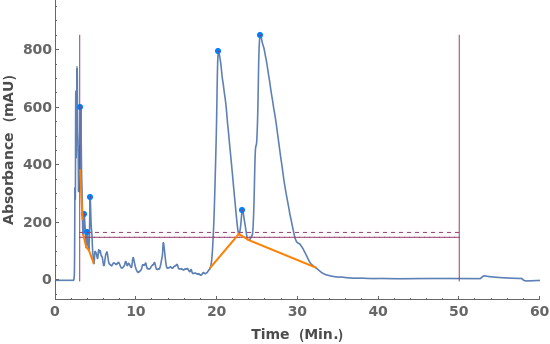
Fit locally linear baselines, obtained by connecting the edges of each peak:

Fit globally nonlinear baselines, obtained using statistics-sensitive nonlinear iterative peak clipping algorithm:

BaselineFeatureWidth (3)


DataSetTransformationFunction (3)


DataSlice (2)


DataSliceDimension (2)

DeuteratedSolvent (1)

Domain (2)


KnownSpecies (2)


MaximumJSplitting (2)


Nucleus (1)

OperatingFrequency (1)


PeakAssignments (4)


PeakGroupDomains (2)


PeakGroupMultiplicity (2)

PeakIntegralNormalizationGroup (1)

PeakLabels (3)


PeakType (2)


RelativeLabeling (1)

SliceReductionFunction (2)


SliceReferencePeaks (3)
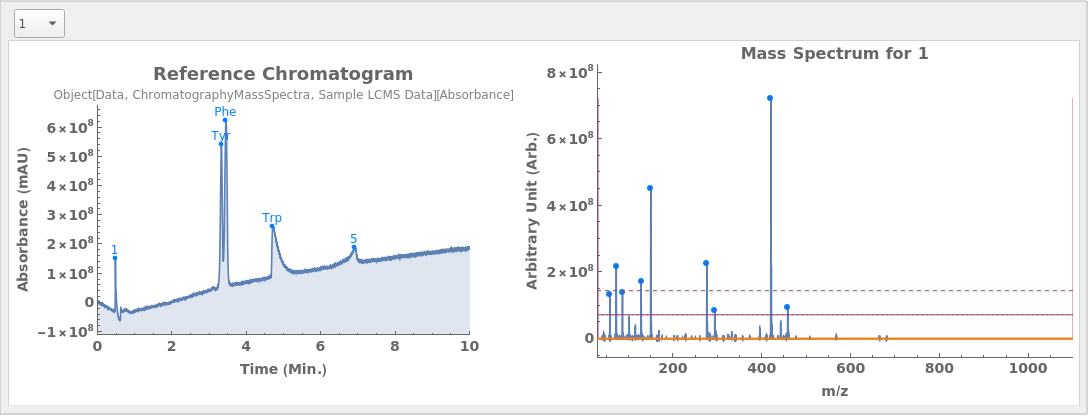
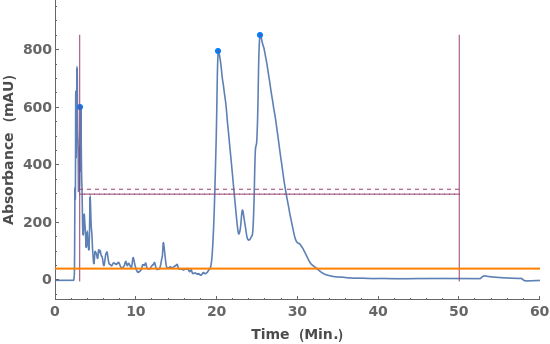
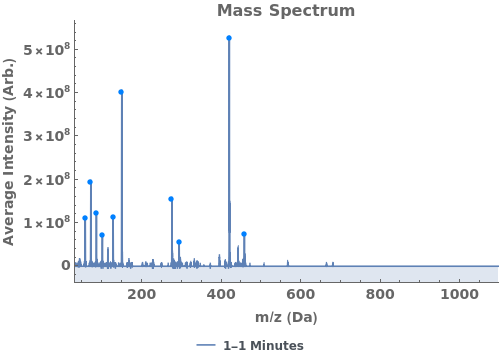
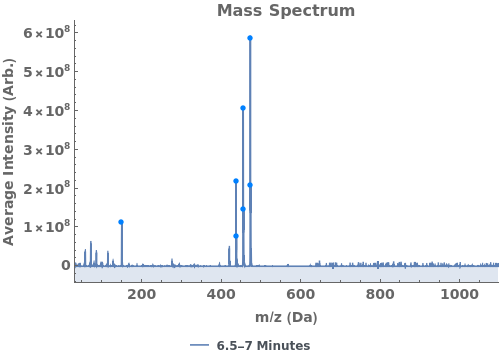
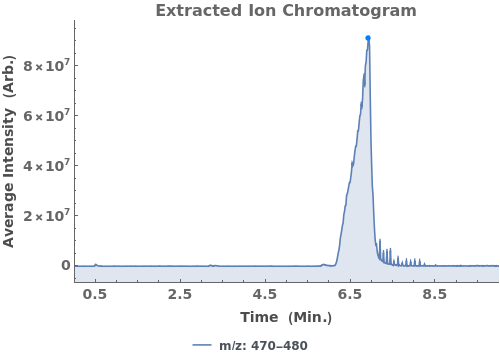
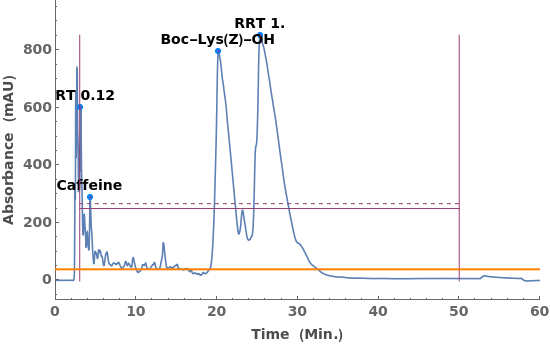
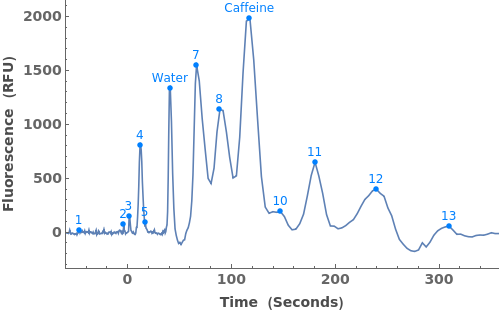
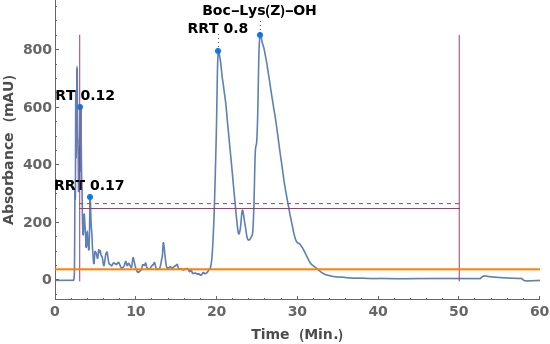
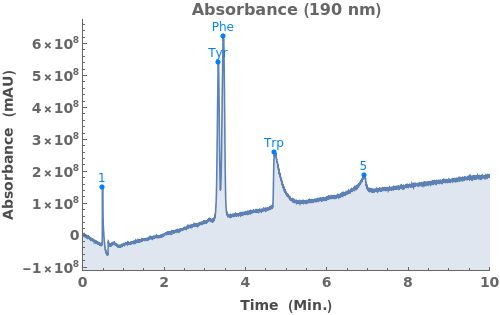
Given LCMS data, pick peaks from the absorbance chromatogram (LC trace):

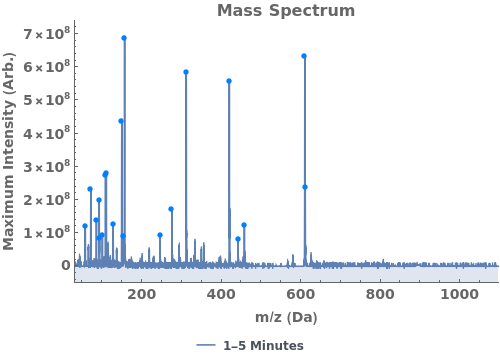
Use peaks from the absorbance chromatogram (LC trace) to slice the IonAbundance3D data at fixed times. The peak positions from the AbsorbanceChromatogram reference peaks will be used to automatically set slicing options, and a peaks analysis object will be created for each slice:


Use AnalyzePeaksPreview to visualize picked-peaks for each slice: