AnalyzeTotalProteinQuantification
AnalyzeTotalProteinQuantification[protocol]⟹object
calculates the mass concentration of protein present in the input samples of the provided TotalProteinQuantification protocol. The input protocol is generated by ExperimentTotalProteinQuantification.
Details
- AnalyzeTotalProteinQuantification creates a standard curve from the absorbance- or fluorescence-spectroscopy data present in the input protocol's QuantificationSpectroscopyProtocol.
- By default, the StandardCurveFitType is set to be Sigmoid. Linear and Cubic fits are also available.
- The TotalProteinConcentration is calculated for all of the AssaySamples and SamplesIn. The average TotalProteinConcentration is calculated for the unique members of SamplesIn. This average takes into account NumberOfReplicates, as well as any dilution of input samples using the Aliquot Sample Preparation options.
- To run AnalyzeTotalProteinQuantification outside of the lab, the input protocol must have a Status of Completed.
Input

Output

General Options
Method Options
Examples
Basic Examples (2)
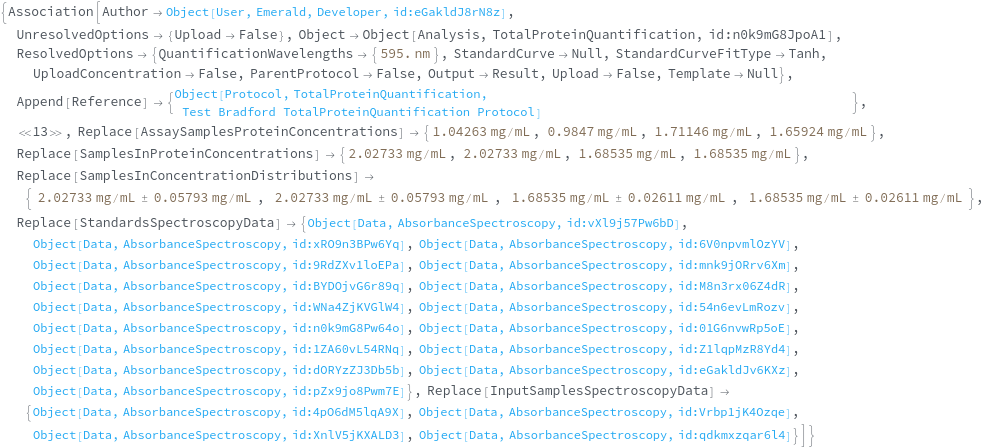
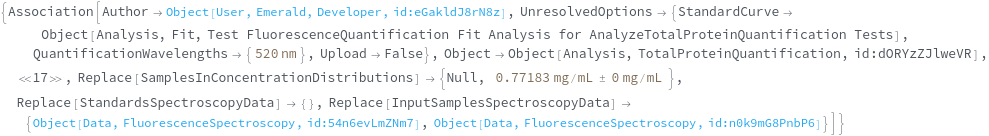
Given an Object[Protocol,TotalProteinQuantification], AnalyzeTotalProteinQuantification returns an Analysis Object:


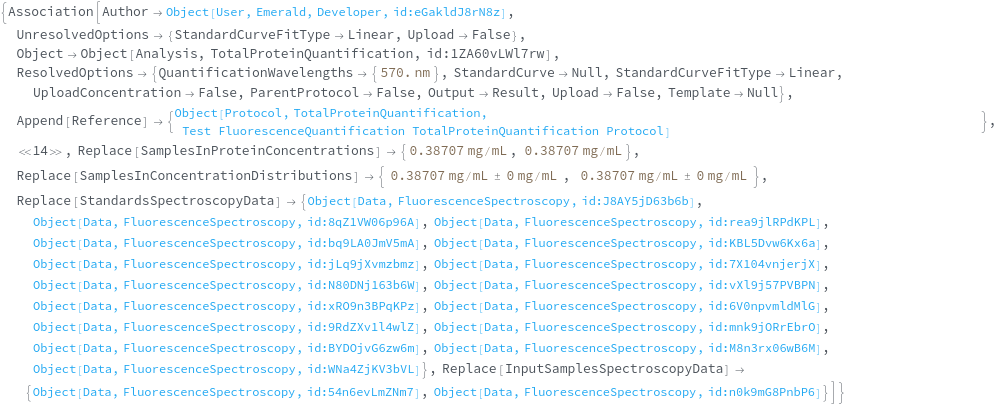
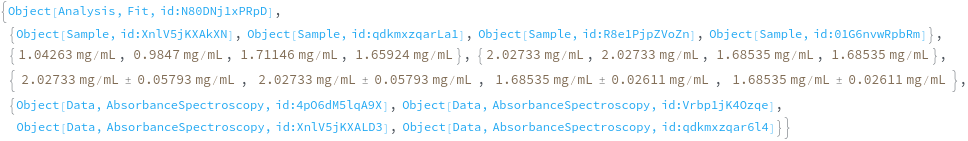
AnalyzeTotalProteinQuantification populates the StandardCurve,QuantificationSamples,AssaySamplesProteinConcentrations,SamplesInProteinConcentrations,SamplesInConcentrationDistributions, and InputSamplesSpectroscopyData fields:

Options (6)
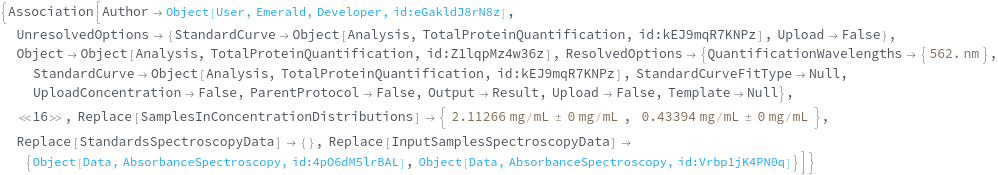
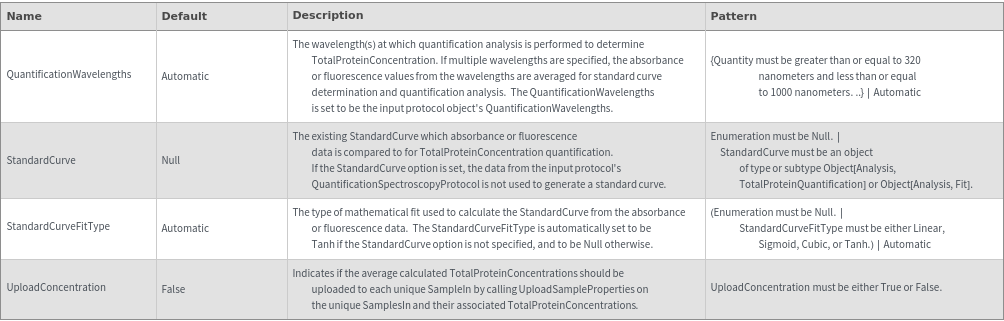
QuantificationWavelengths (1)
The QuantificationWavelengths Options specifies the wavelength(s) at which quantification analysis is performed to determine TotalProteinConcentration. If multiple wavelengths are specified, the absorbance or fluorescence values from the wavelengths are averaged for standard curve determination and quantification analysis: