AxisLines
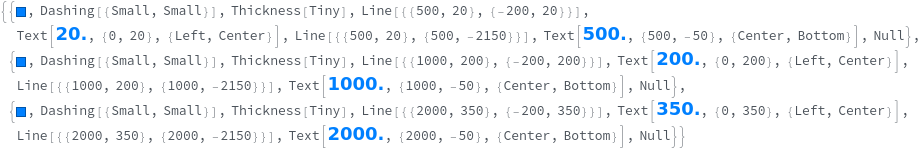
AxisLines[peakPoints:{{_?NumericQ,_?NumericQ}..},plotRange:{{_?NumericQ,_?NumericQ},{_?NumericQ,_?NumericQ}}]⟹lines_Graphics
draws lines from the peak point(s) to the x and y axes.
Details
Input

Output

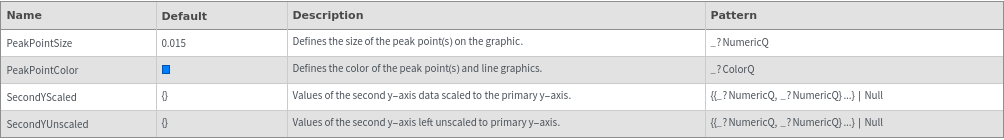
General Options
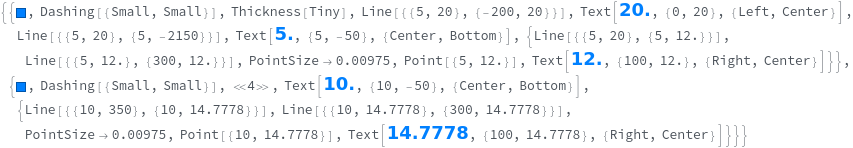
AxisLines[peakPoints:{{_?NumericQ,_?NumericQ}..},plotRange:{{_?NumericQ,_?NumericQ},{_?NumericQ,_?NumericQ}}]⟹lines_Graphics
draws lines from the peak point(s) to the x and y axes.