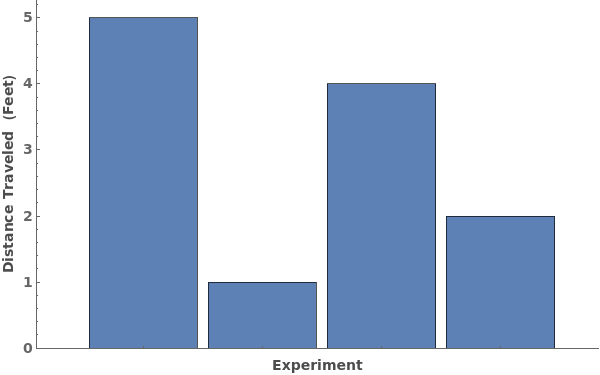
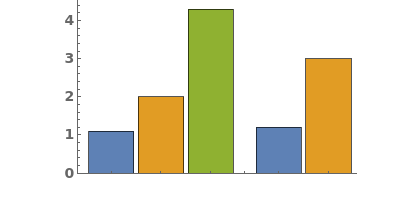
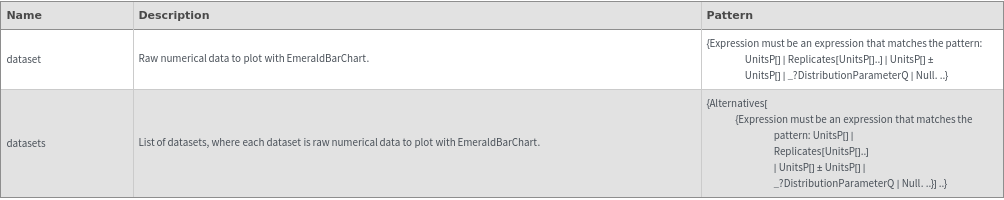
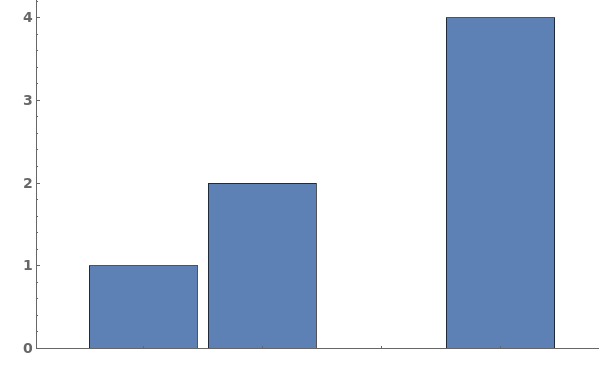
EmeraldBarChart
EmeraldBarChart[dataset]⟹chart
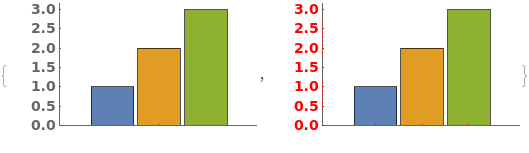
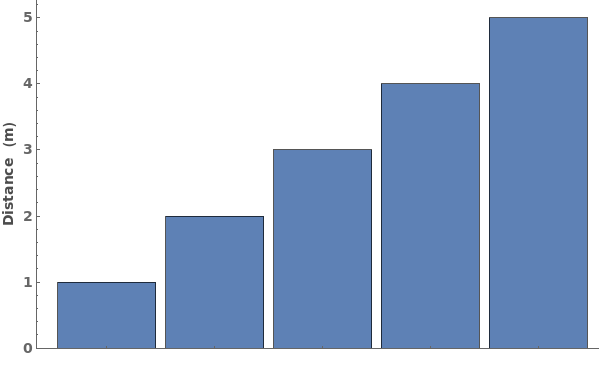
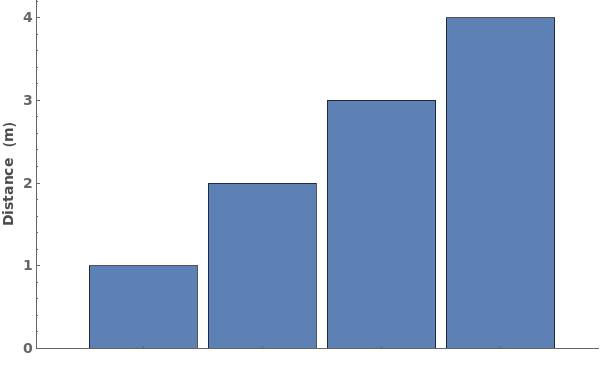
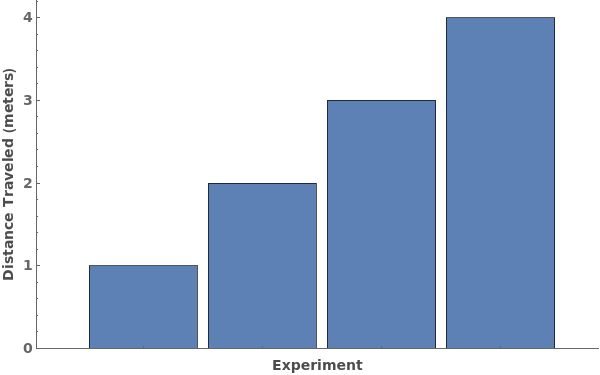
creates a bar chart from the provided dataset.
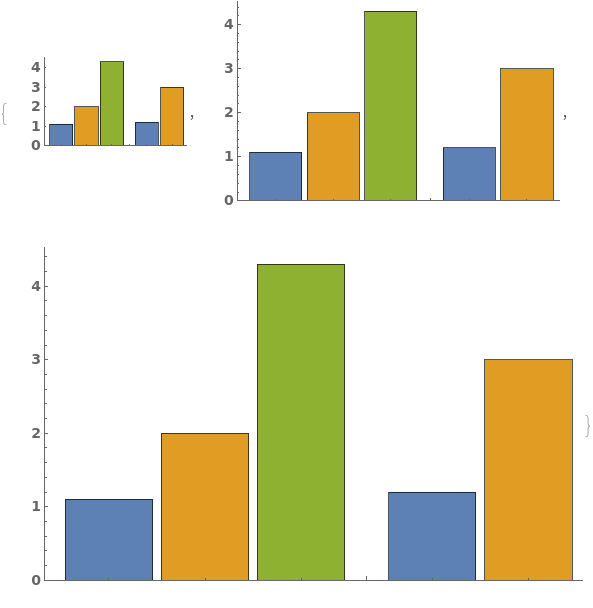
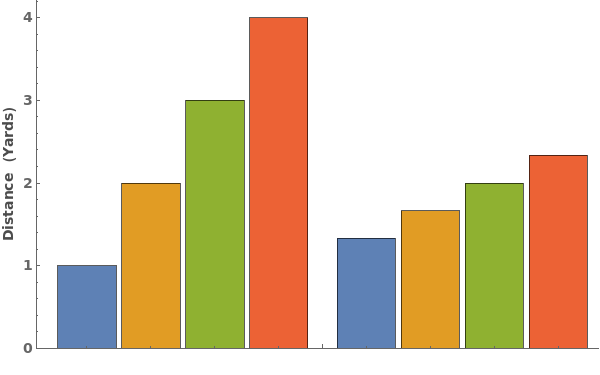
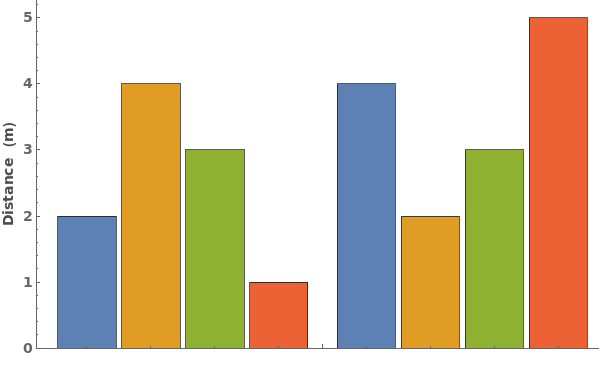
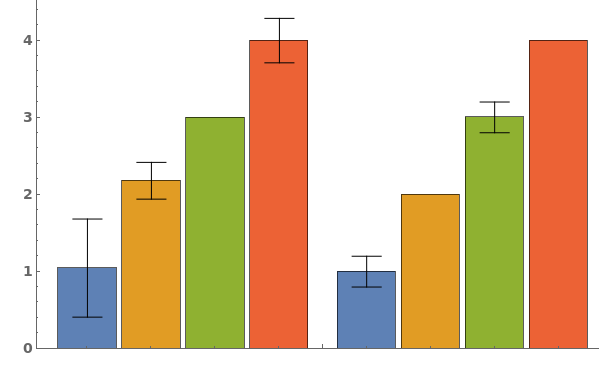
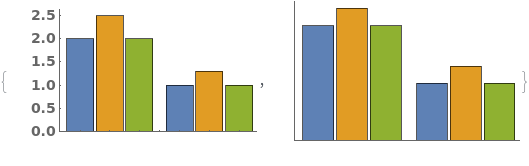
EmeraldBarChart[datasets]⟹chart
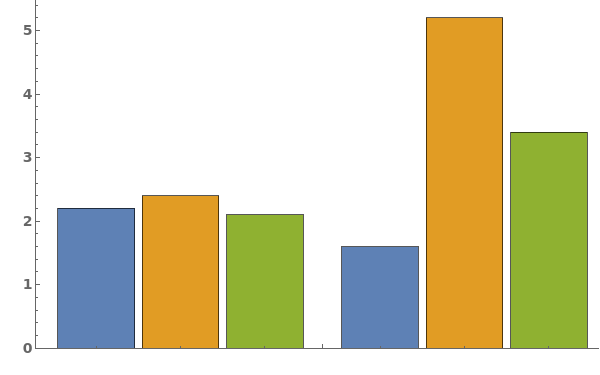
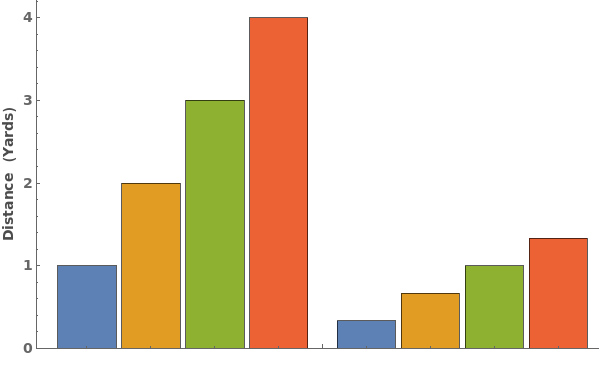
creates a bar chart displaying each dataset in datasets.
Details
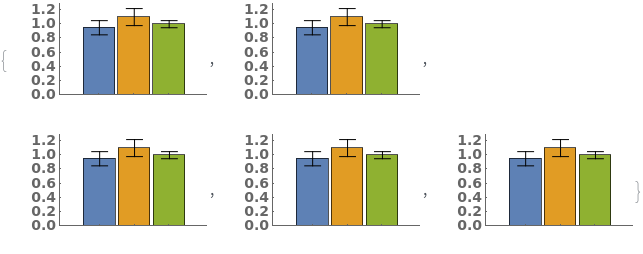
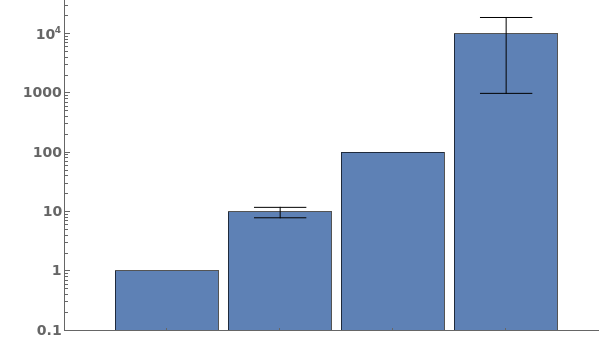
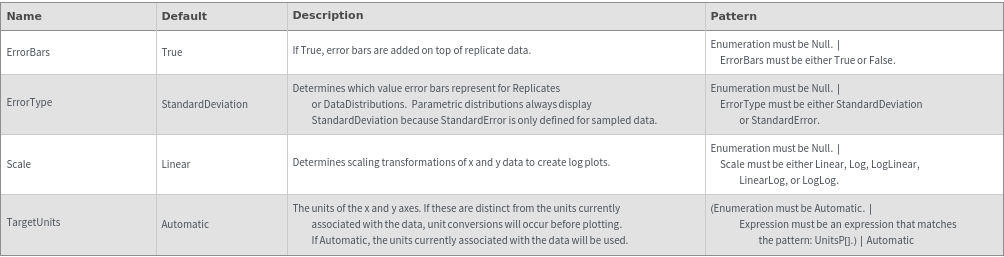
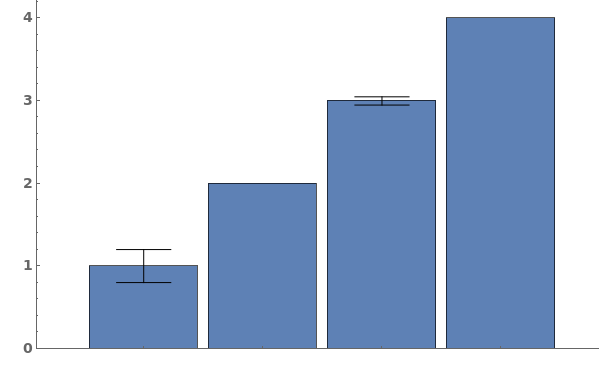
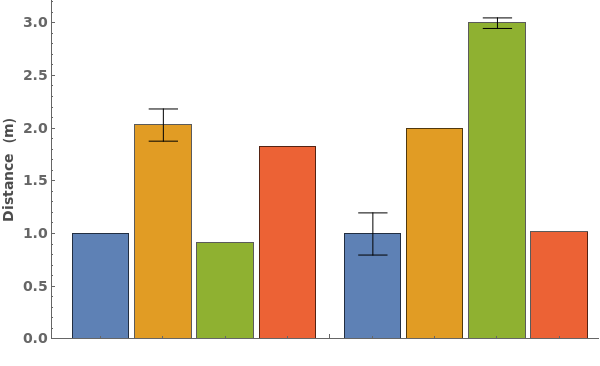
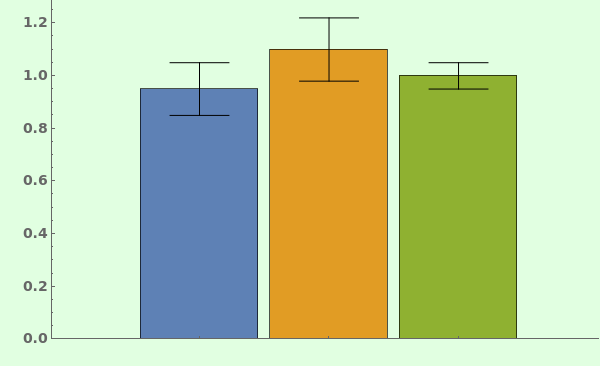
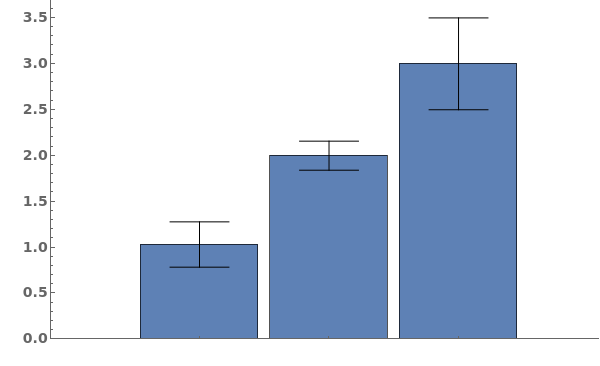
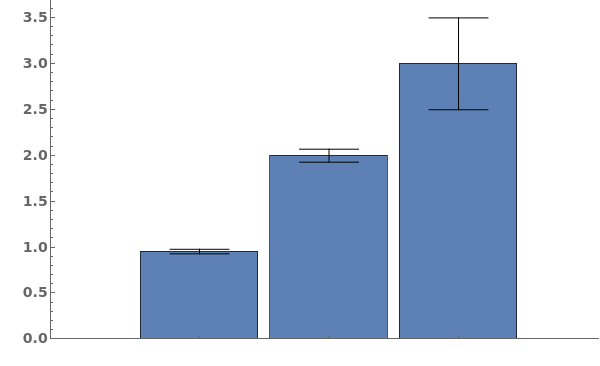
- Data points specified as Replicates are turned into a bar whose height is the mean of the replicates list, and an error bar whose size is the standard deviation of the replicates list.
- Data points specified as distributions are turned into a bar whose height is the mean of the distribution, and an error bar whose size is the standard deviation of the distriubtion.
- Data points specified as PlusMinus[m,s] are turned into a bar whose height is m, and an error bar whose size is s.
Input
Output

Data Specifications Options
Frame Options
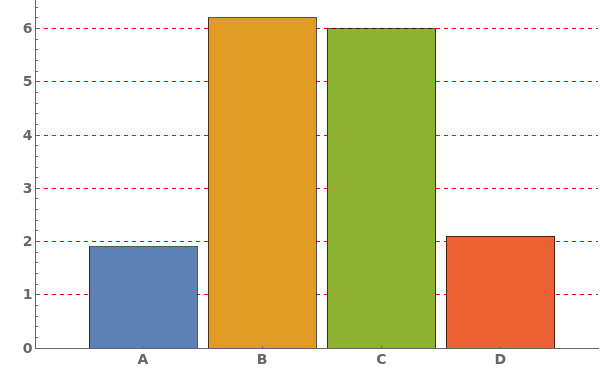
Grid Options
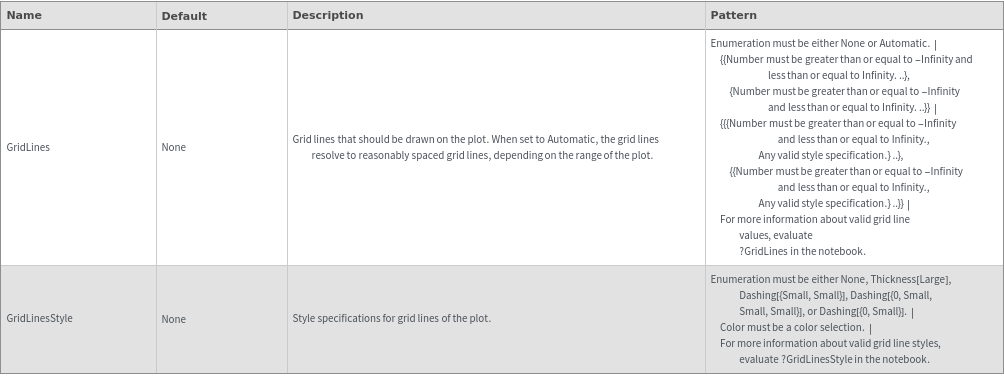
Image Format Options
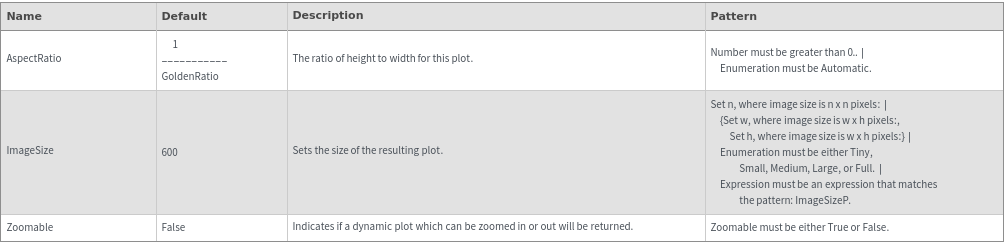
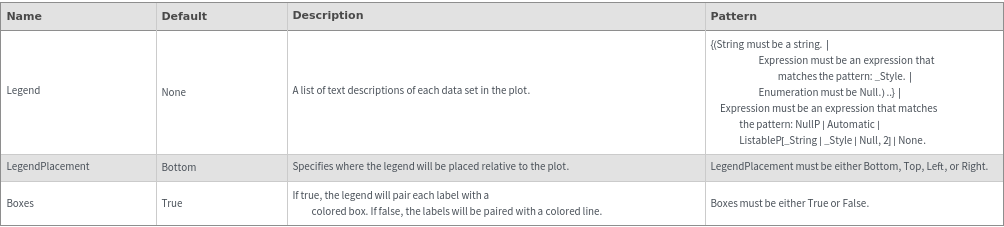
Legend Options
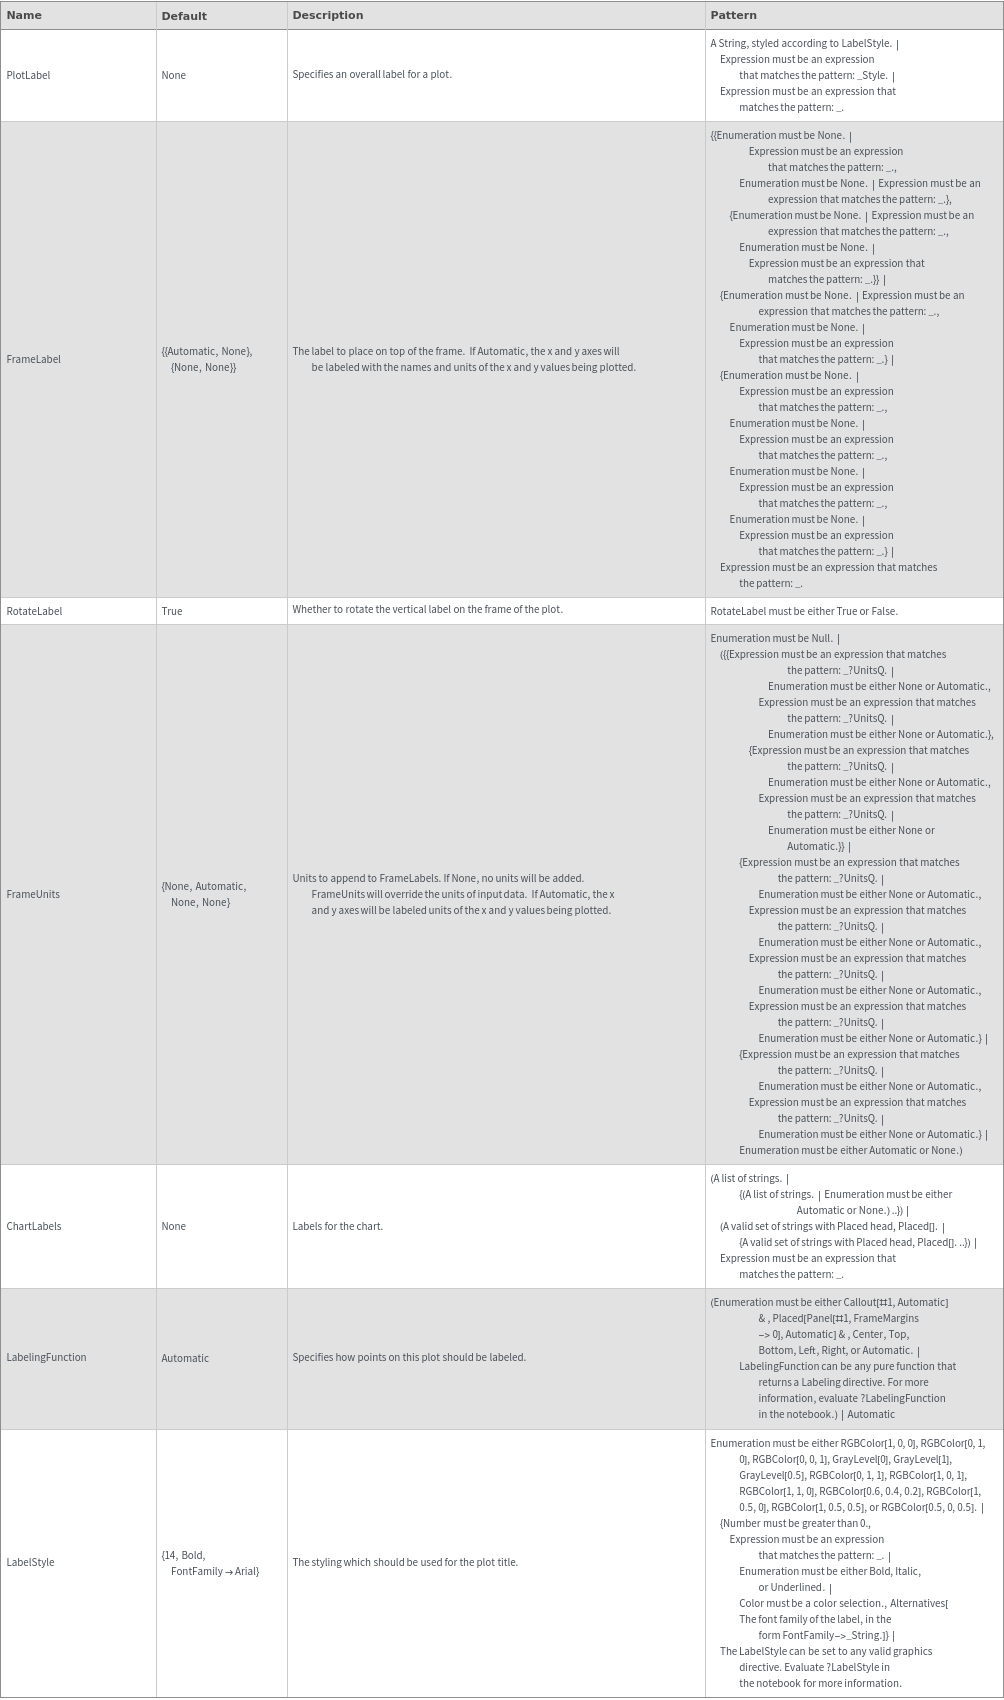
Plot Labeling Options
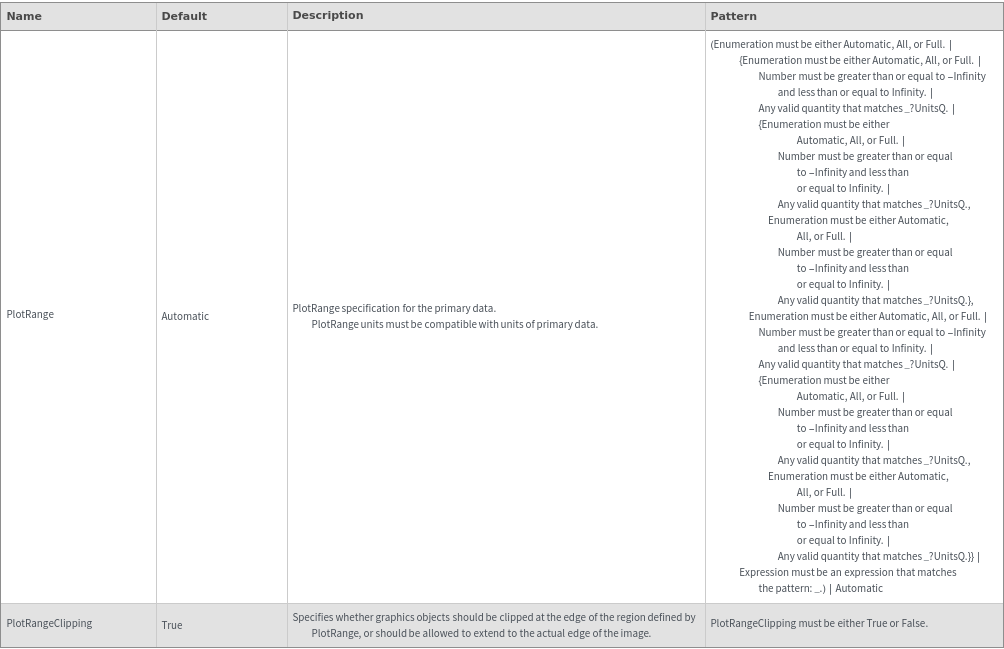
Plot Range Options
Plot Style Options
General Options
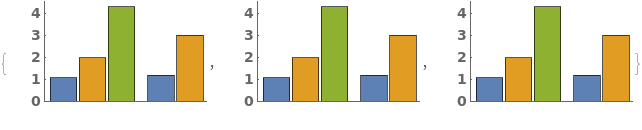
Examples
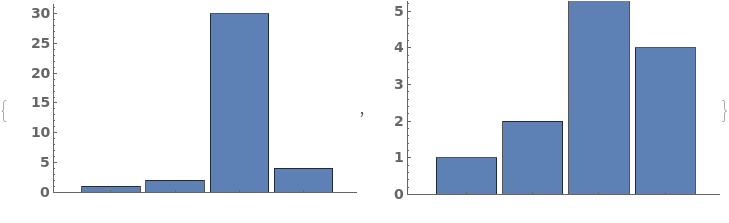
Basic Examples (2)


Additional Examples (13)
Missing Data (4)


Quantity Arrays (3)


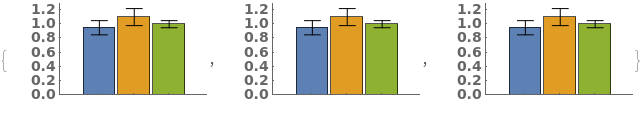
Replicates (3)


Options (82)
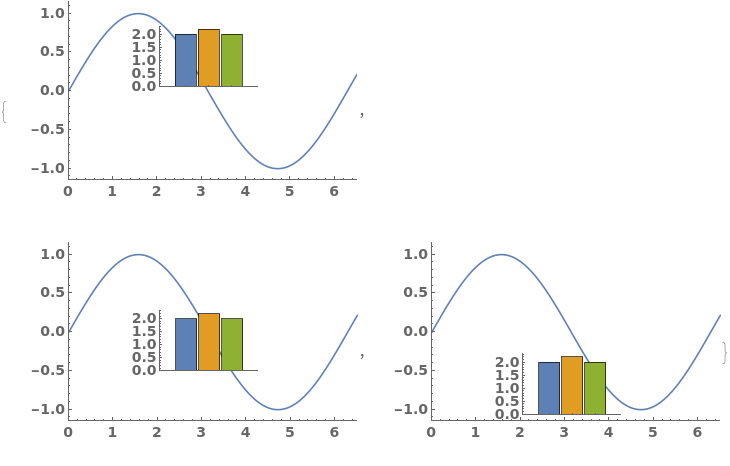
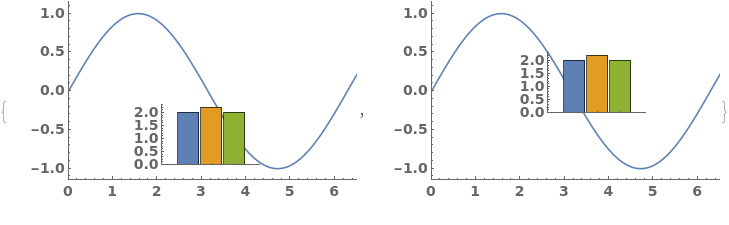
AlignmentPoint (2)


BarSpacing (4)


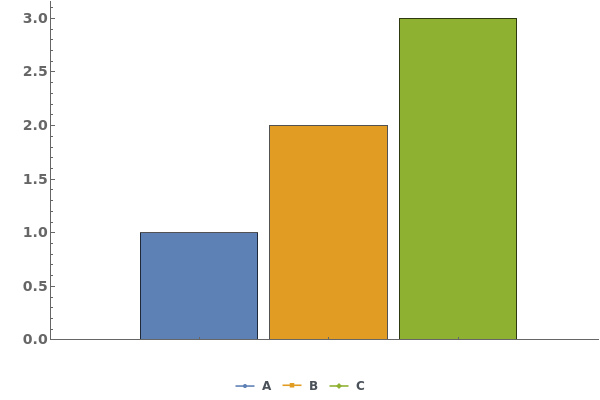


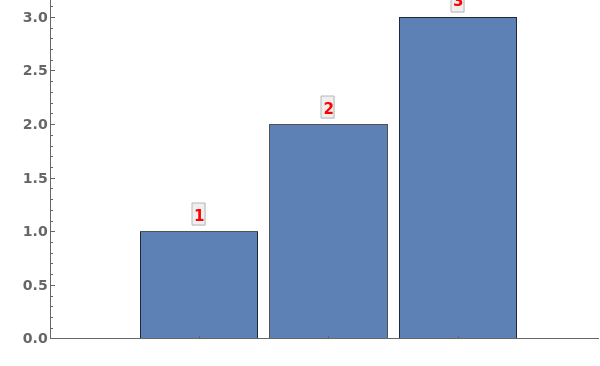
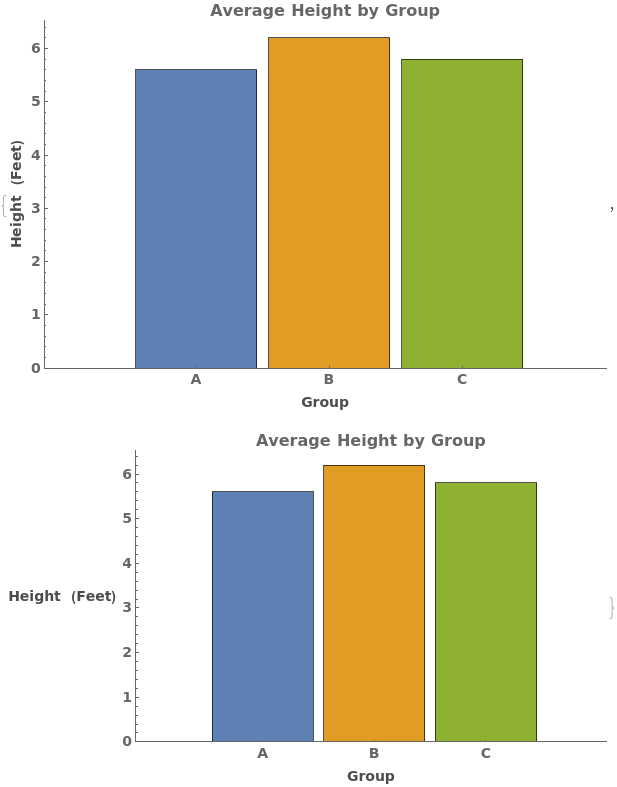
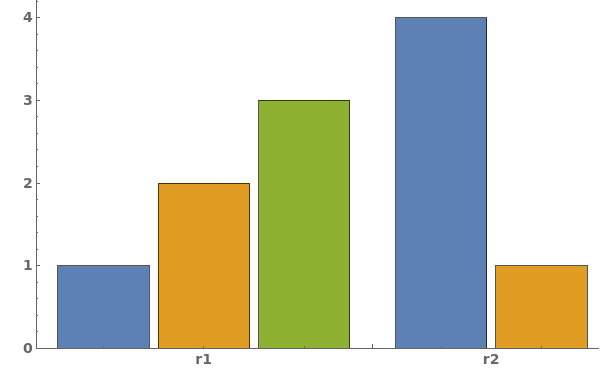
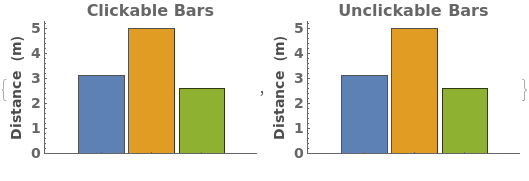
ChartLabels (3)


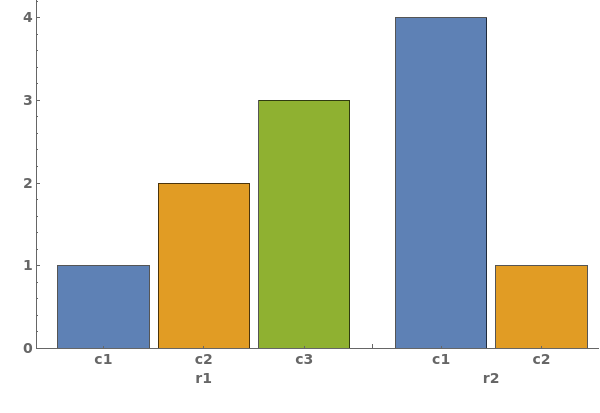
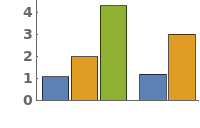
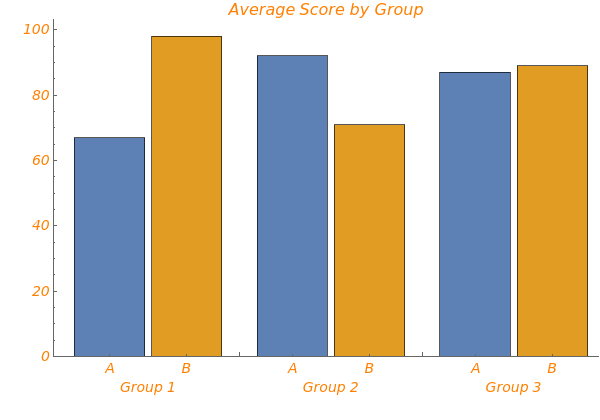
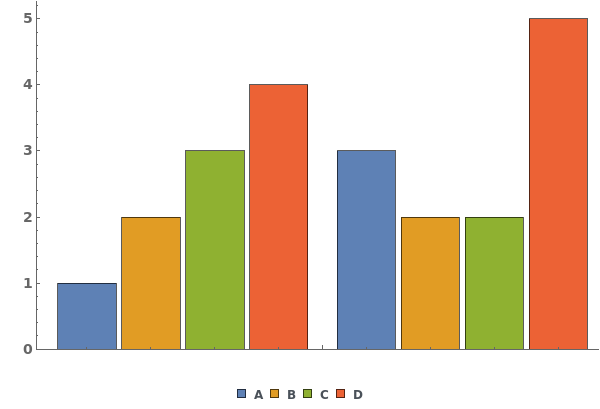
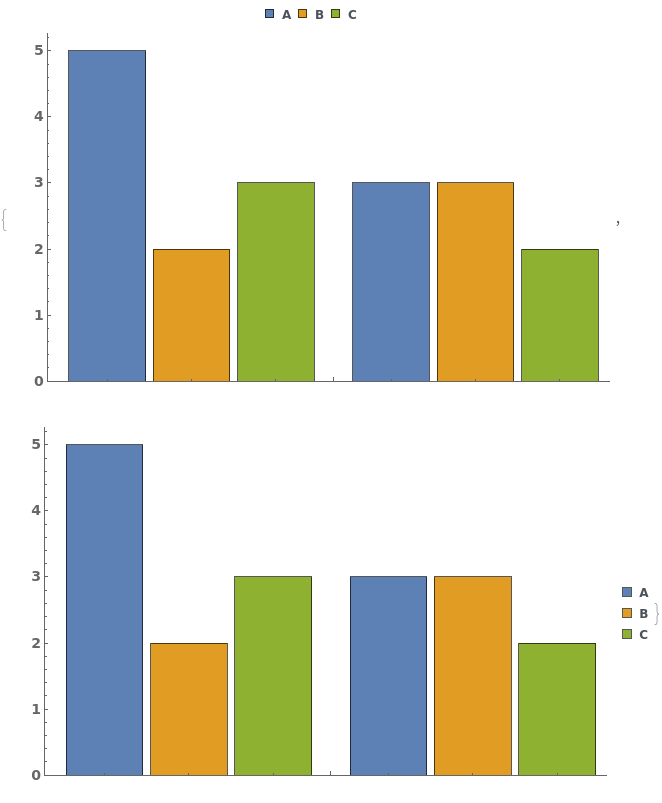
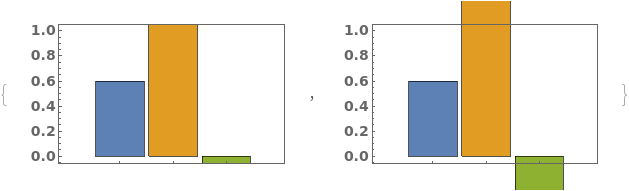
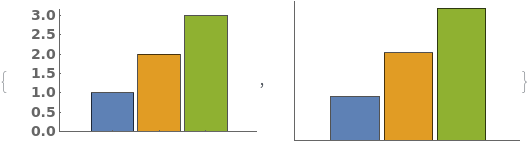
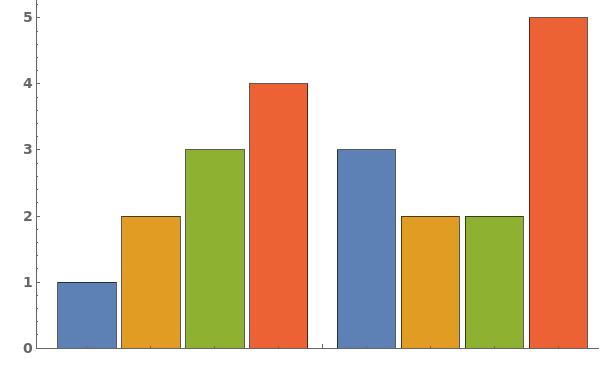
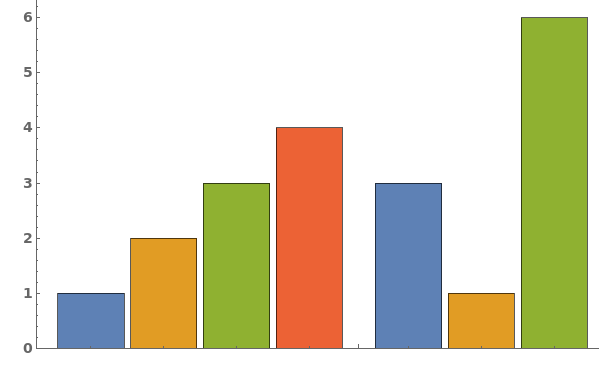
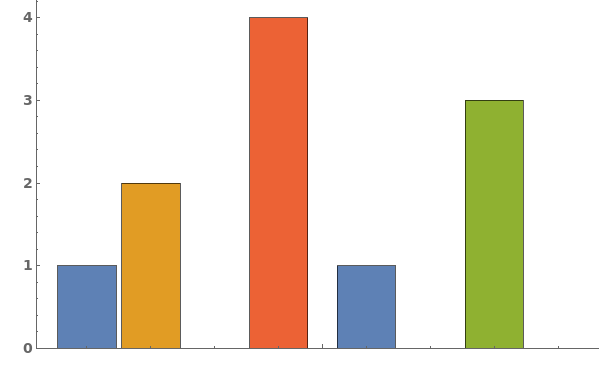
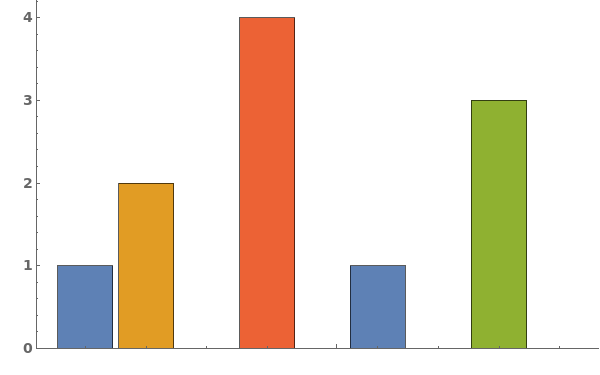
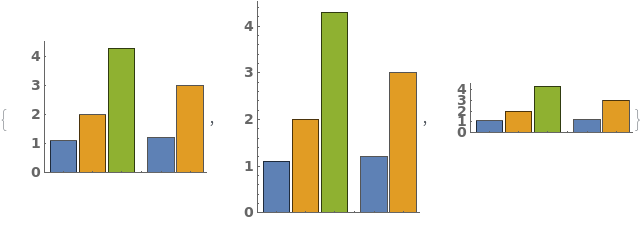
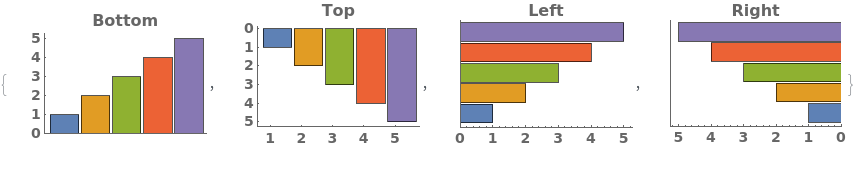
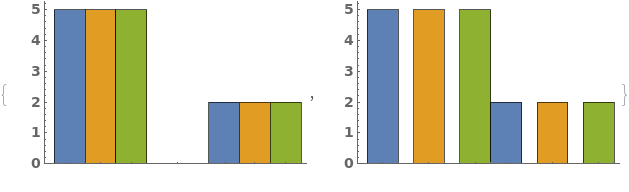
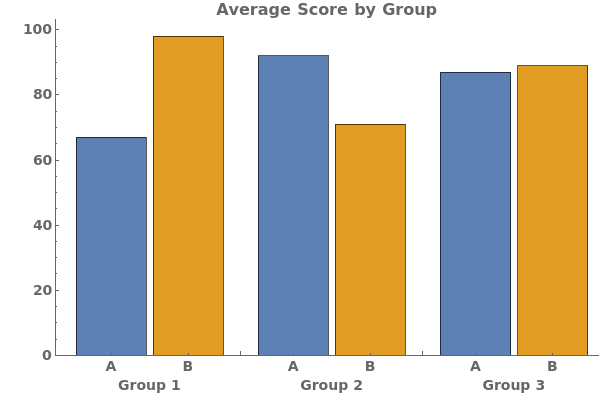
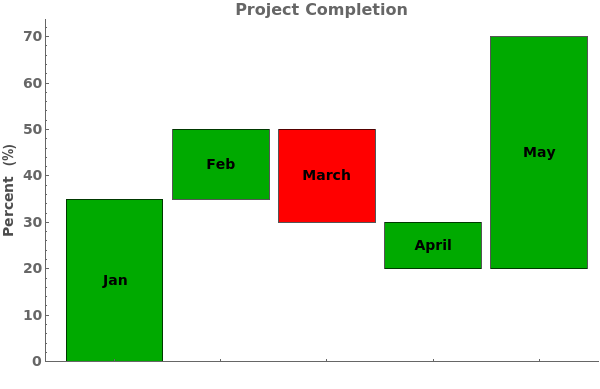
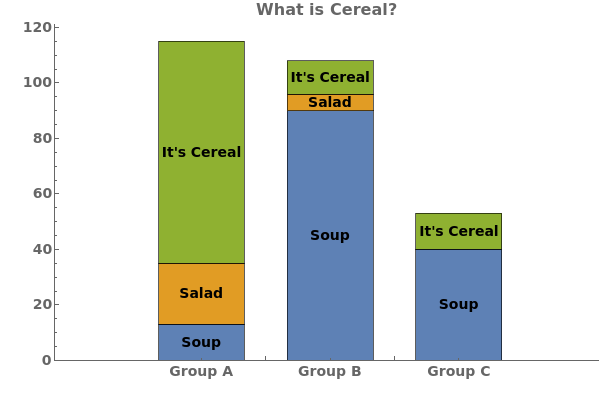
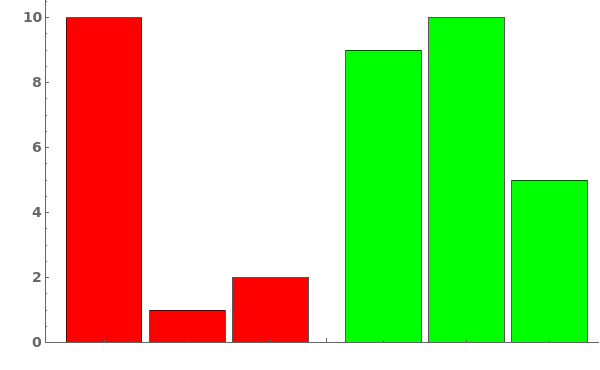
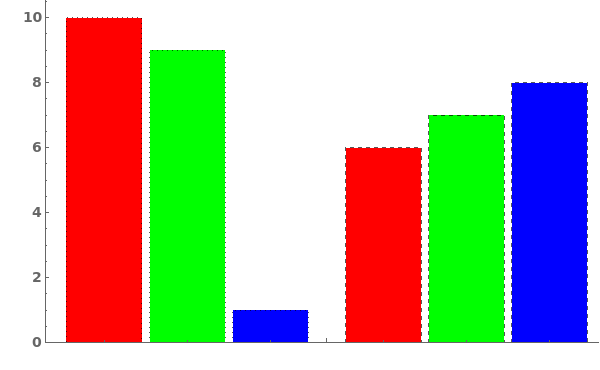
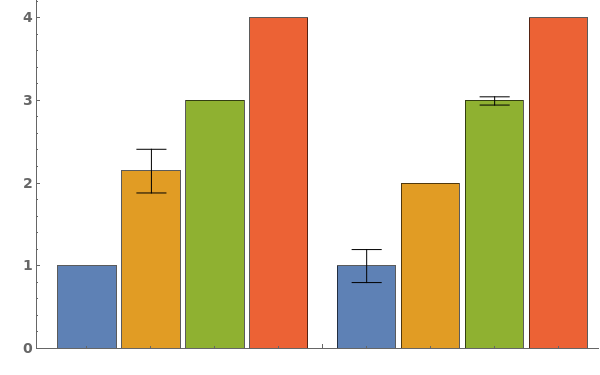
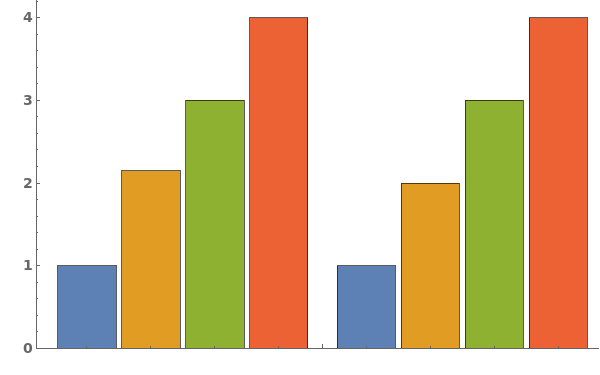
ChartLayout (4)
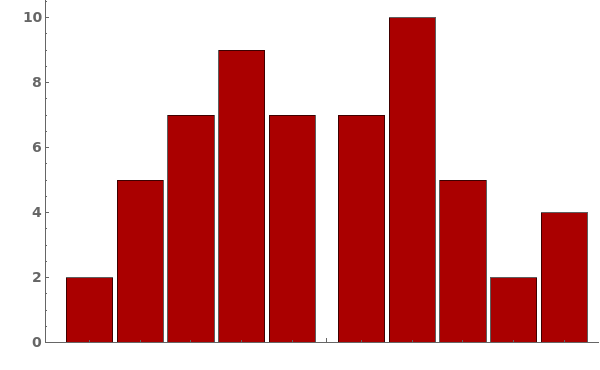
By default, EmeraldBarChart uses ChartLayout->Grouped:

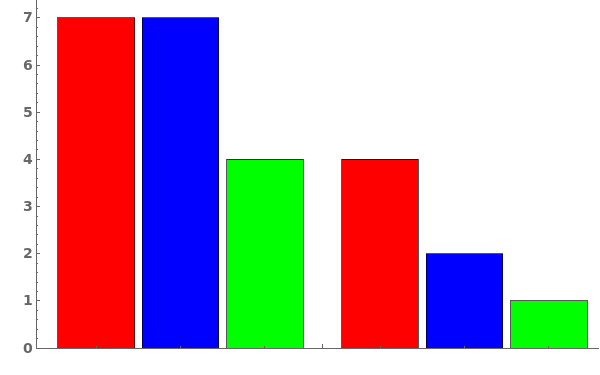
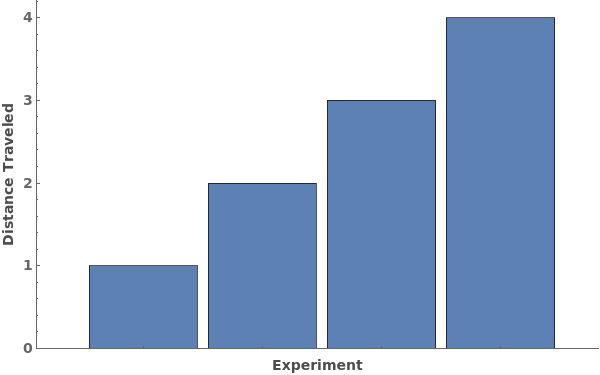
Use ChartLayout->Stepped to emphasize a change over time in the bar chart:

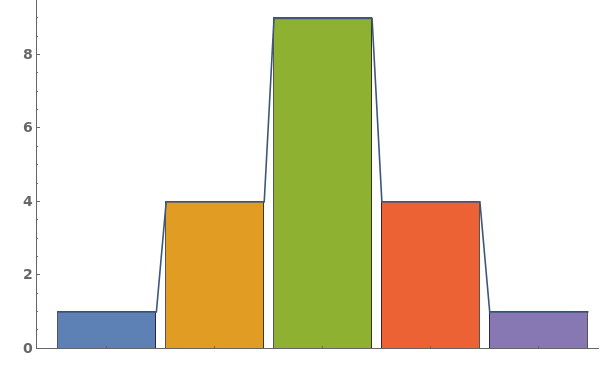
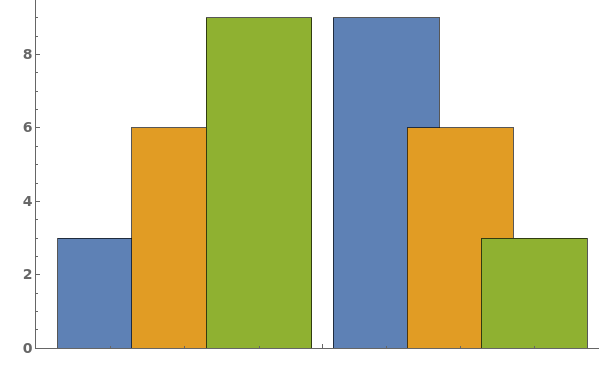
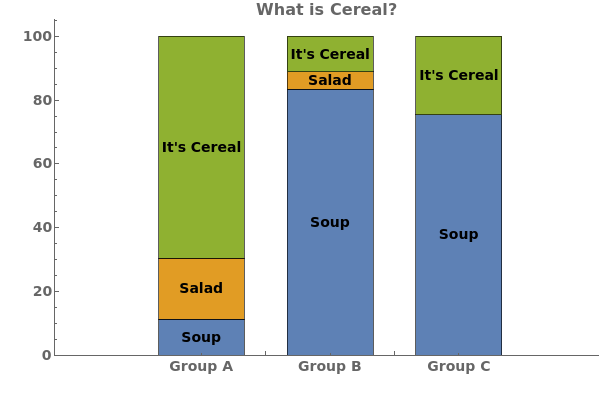
Use ChartLayout->Stacked to emphasize both the distribution and size of each data group:

Use ChartLayout->Percentile to emphasize the percentage of each group each bar constitutes:

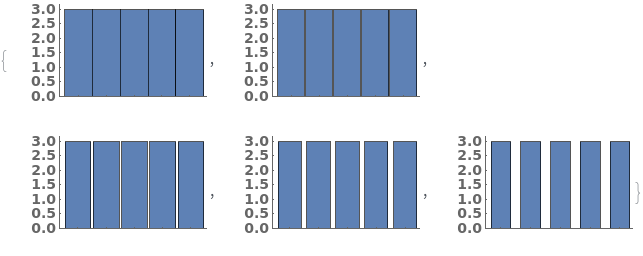
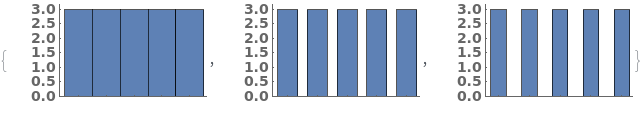
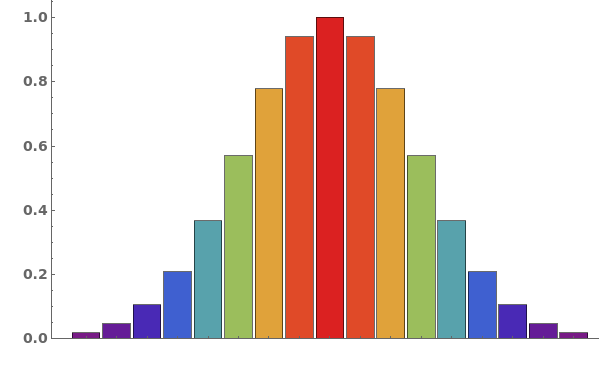
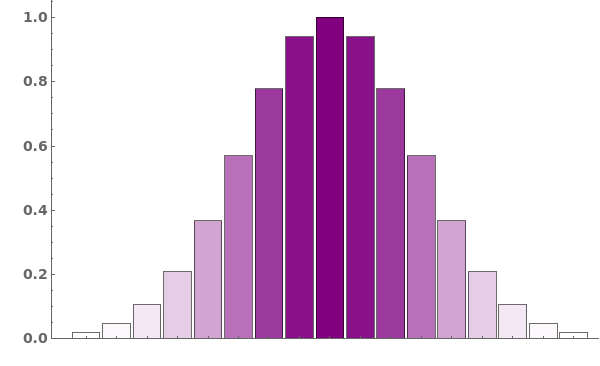
ChartStyle (5)
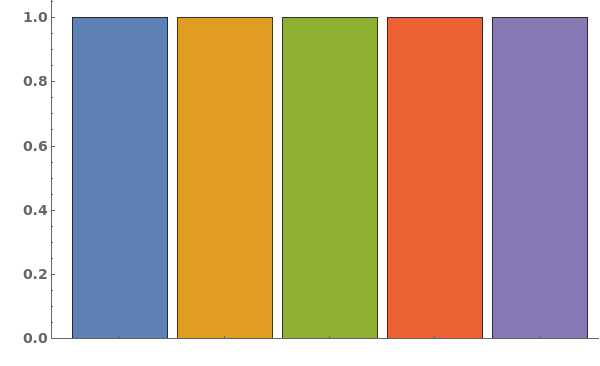
Pass a single argument to ChartStyle to style all bars the same way:

Style the chart named color scheme from ColorData[]:

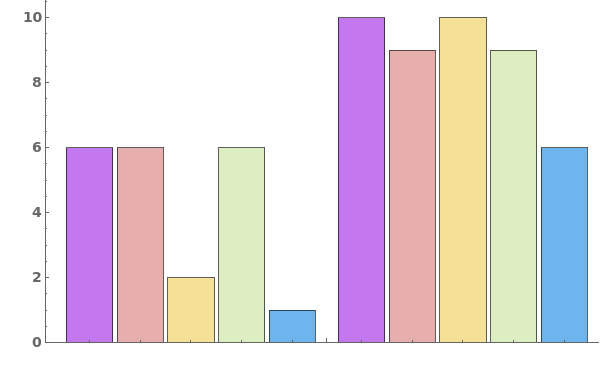
Pass a list of arguments to ChartStyle to apply different styles to each bar in each group:

Style each group the same way:

Style each group and each series of bars in each group, in the format { {group1, group2,..}, {bar1,bar2,bar3,...}}:

ColorFunction (2)


ColorFunctionScaling (1)


CoordinatesToolOptions (1)

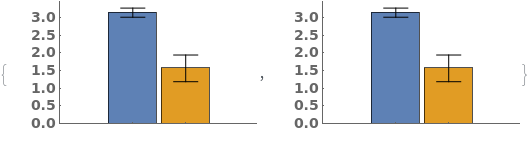

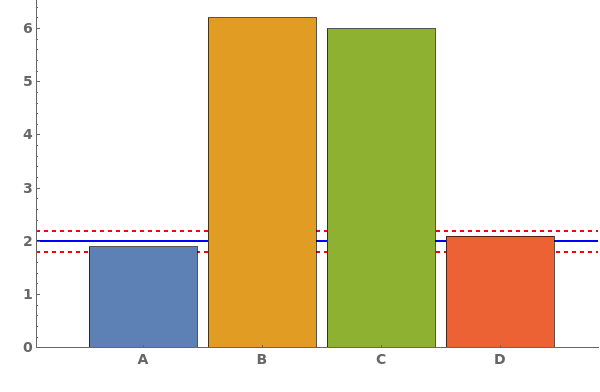
ErrorBars (2)


ErrorType (2)


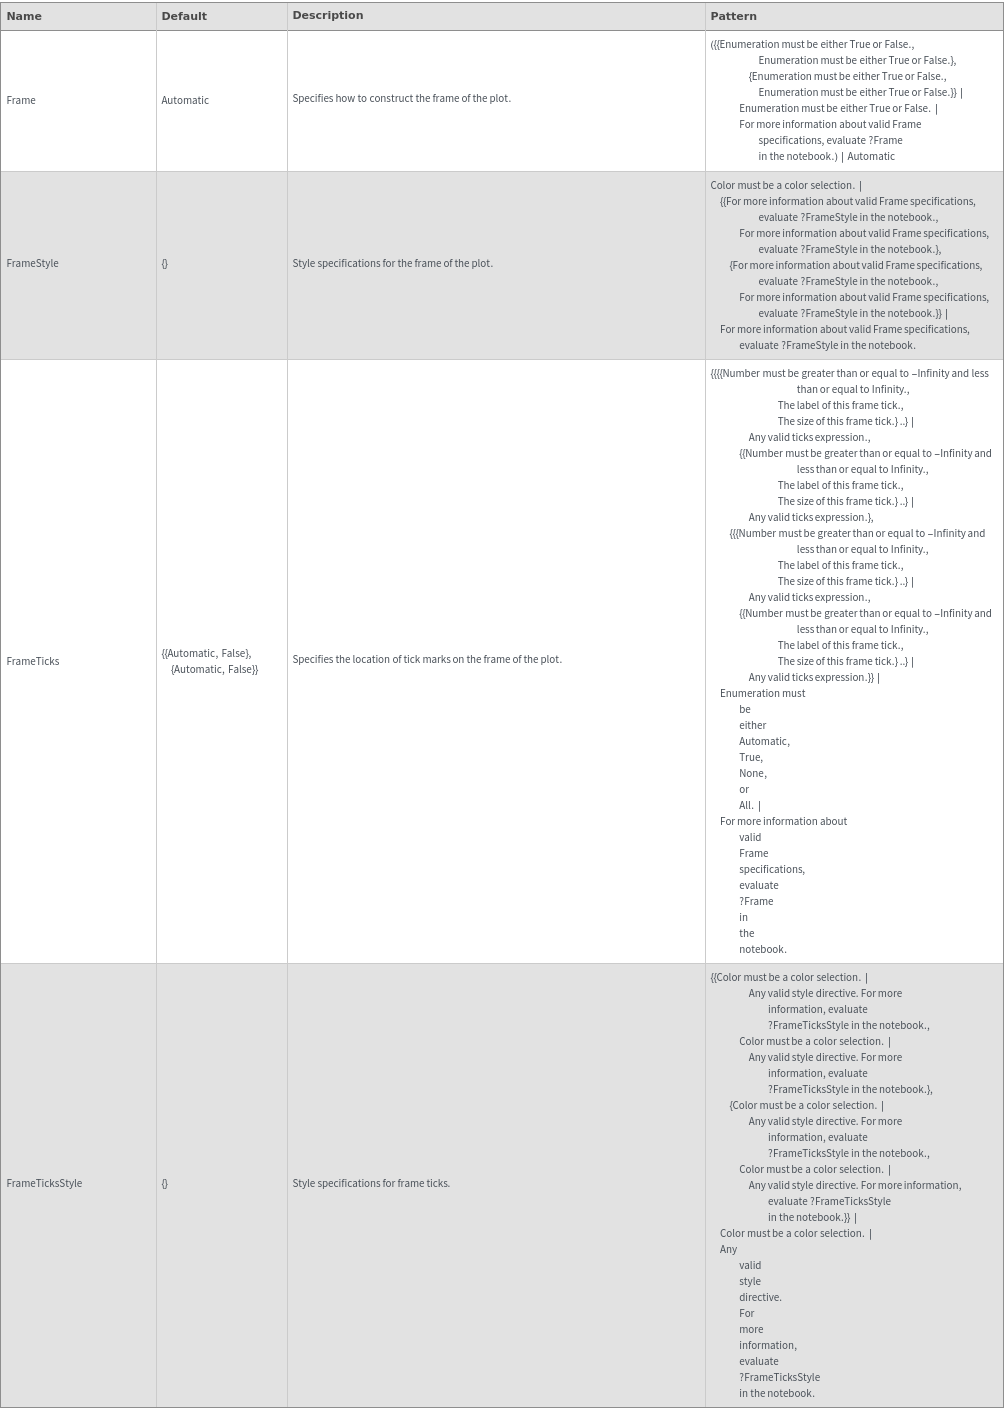
Frame (3)


FrameStyle (2)


FrameTicksStyle (2)


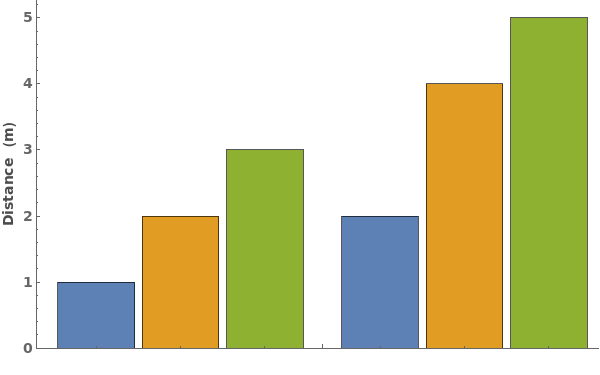
FrameUnits (4)
By default, the data's units are automatically appended to the frame label:

If the data is unitless, no units will be appended:

Use FrameUnits->None to stop automatic appeneding of units. For example, if you want to specify the units inside the frame label manually:

Can also explicitly specify a FrameUnit to override the data's units: