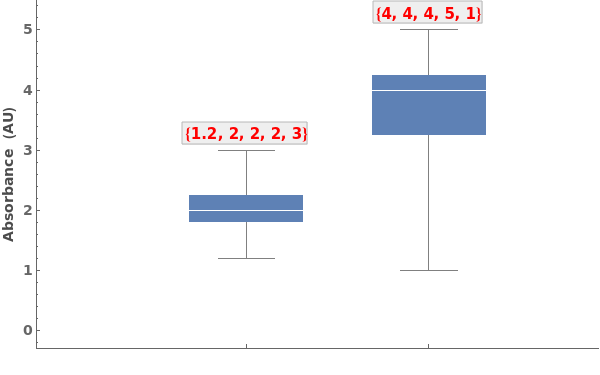
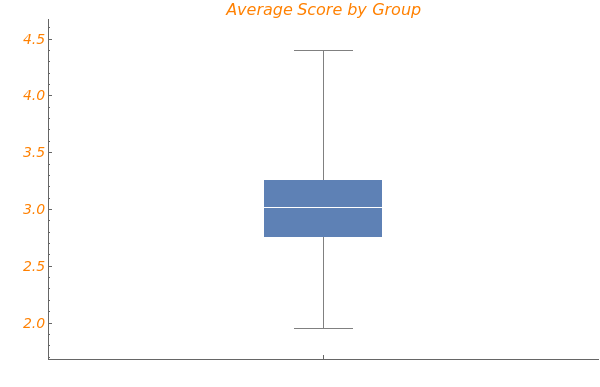
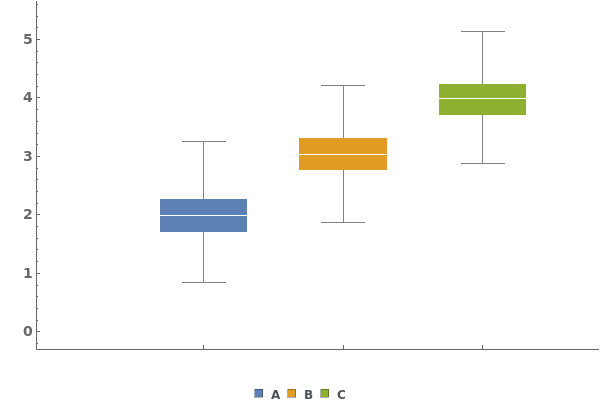
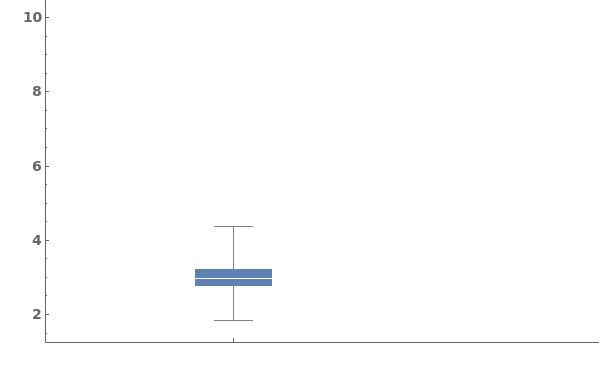
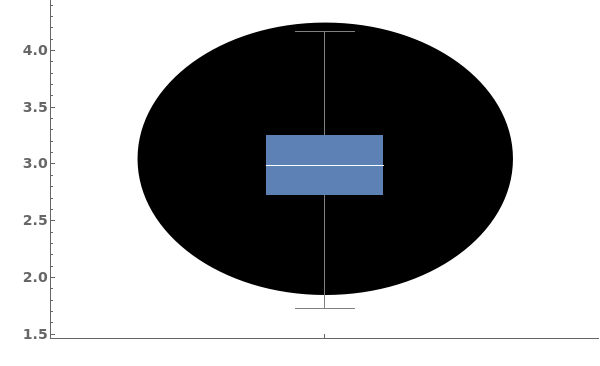
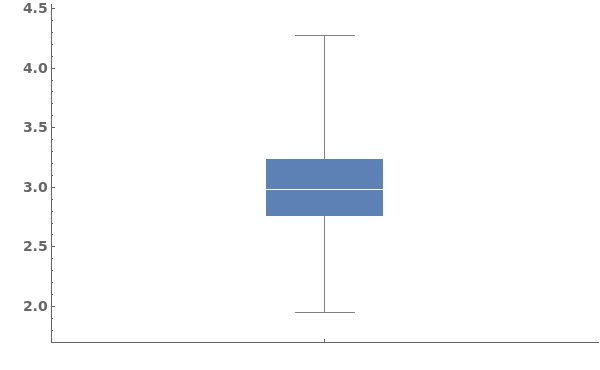
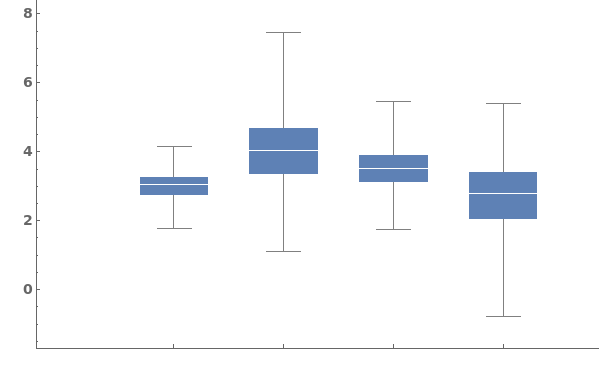
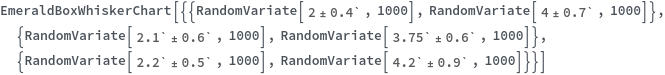
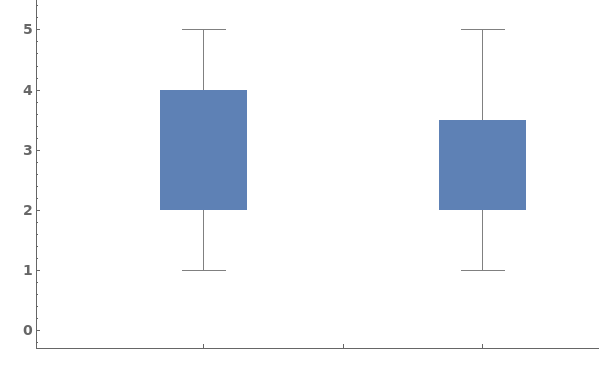
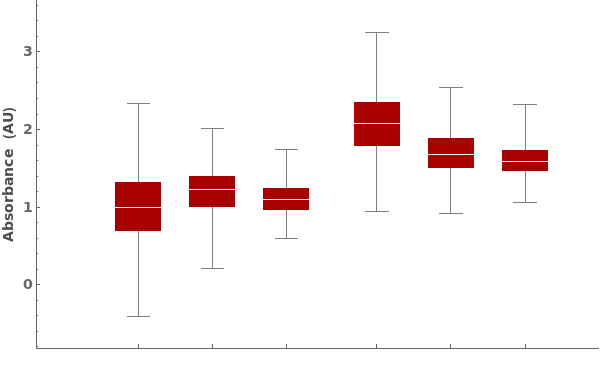
EmeraldBoxWhiskerChart
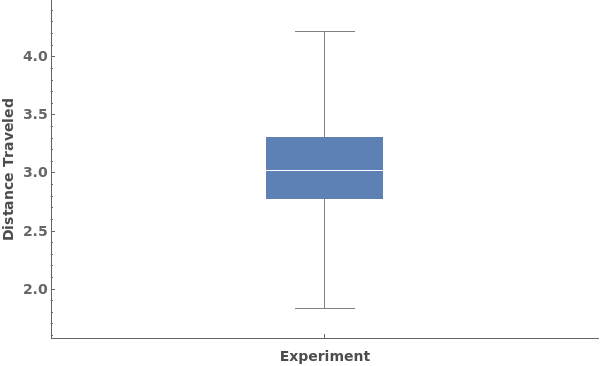
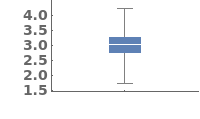
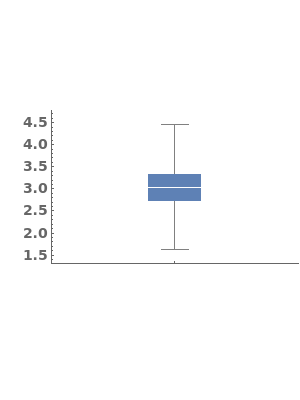
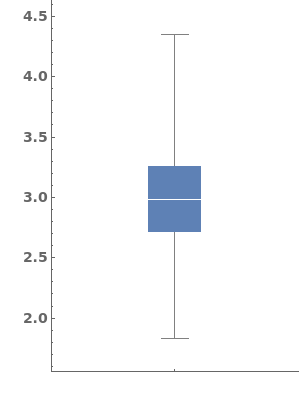
EmeraldBoxWhiskerChart[dataset]⟹chart
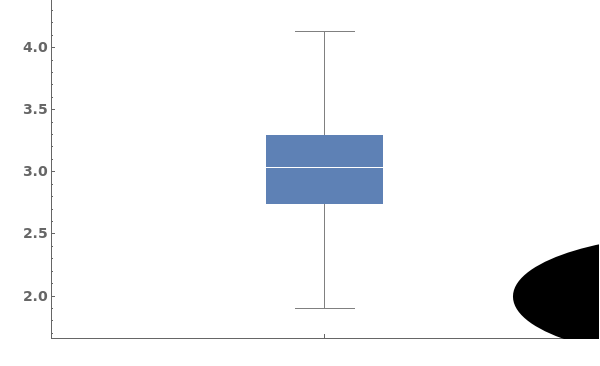
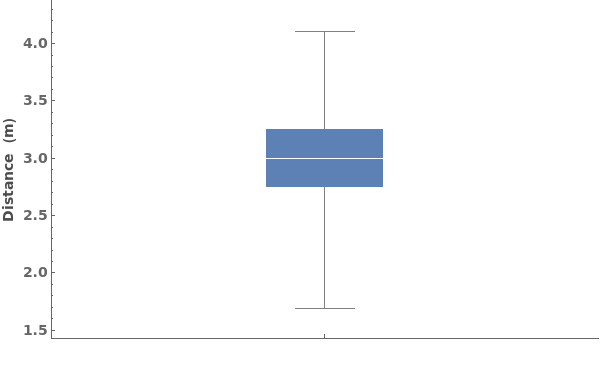
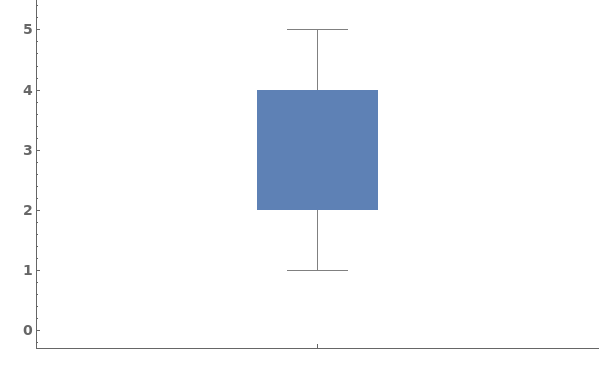
creates a BoxWhiskerChart from the provided dataset.
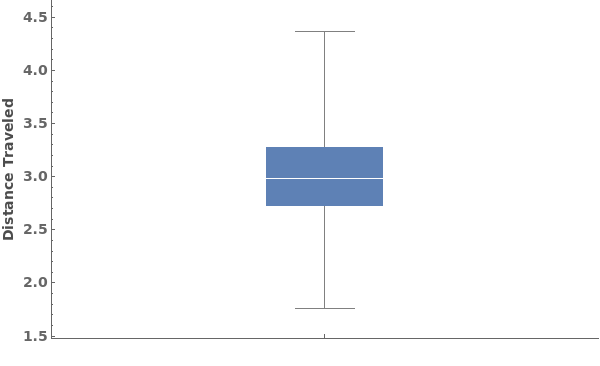
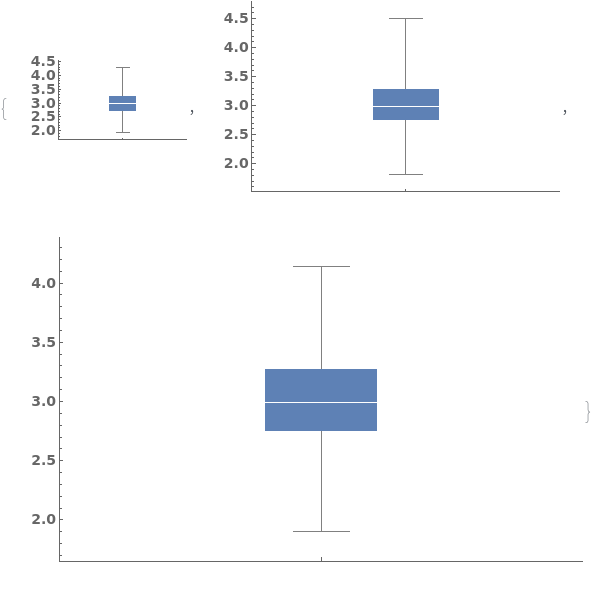
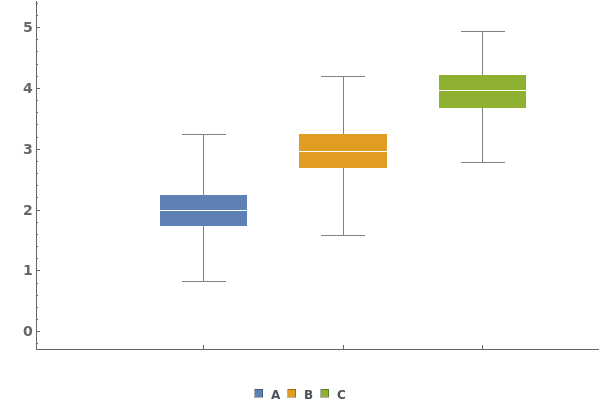
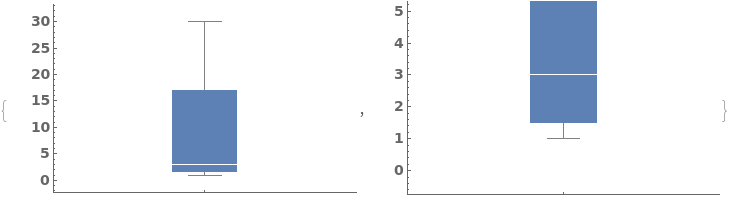
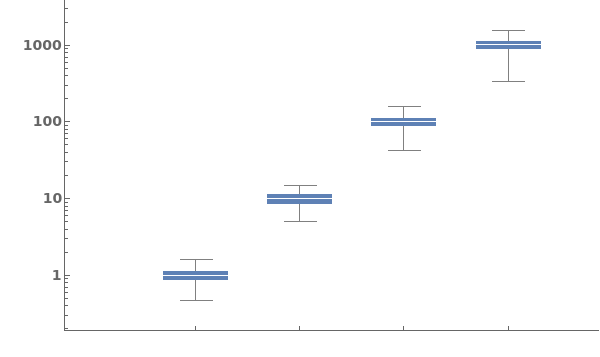
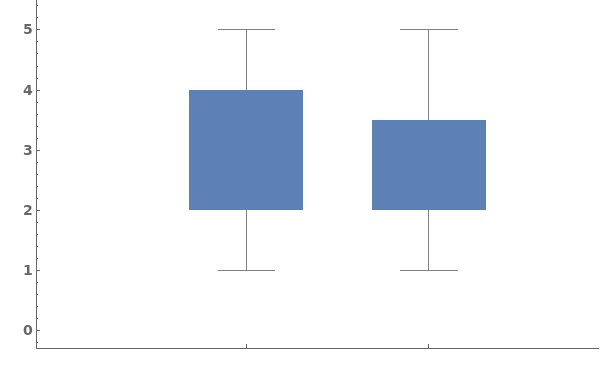
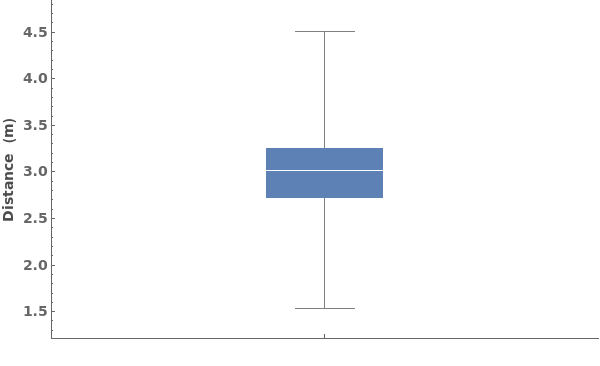
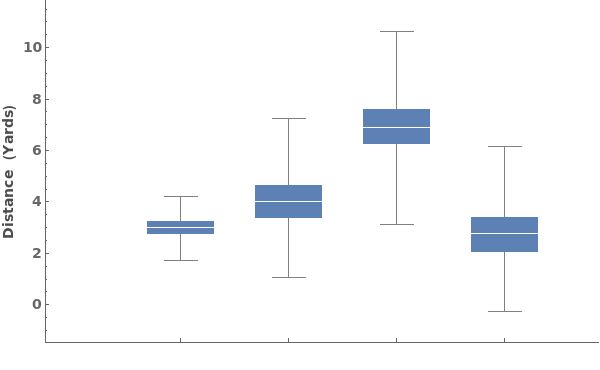
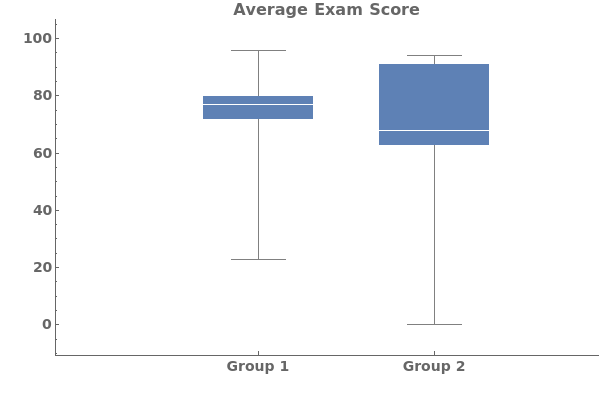
EmeraldBoxWhiskerChart[datasets]⟹chart
creates a BoxWhiskerChart displaying each dataset in datasets.
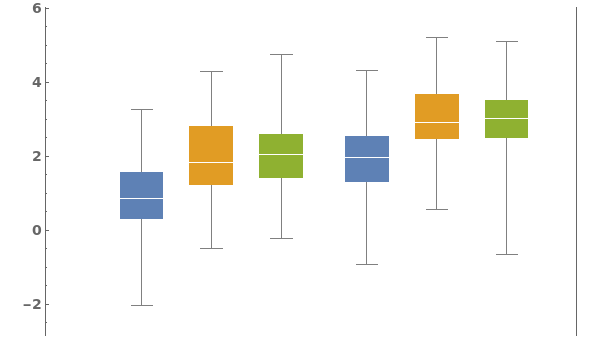
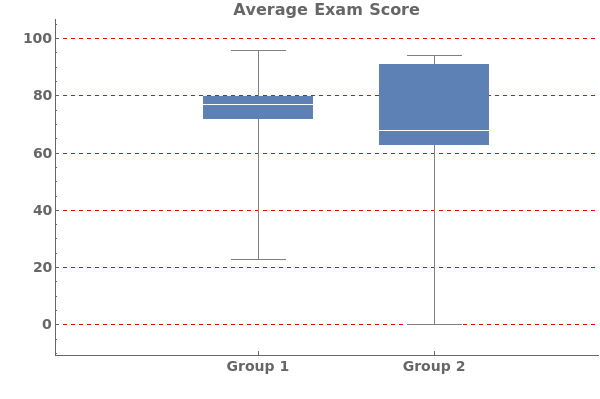
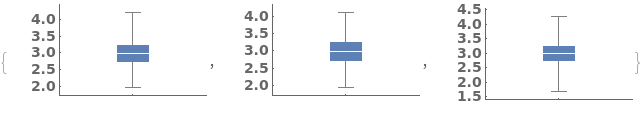
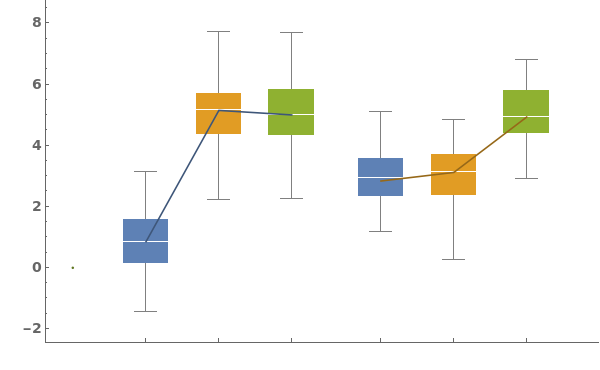
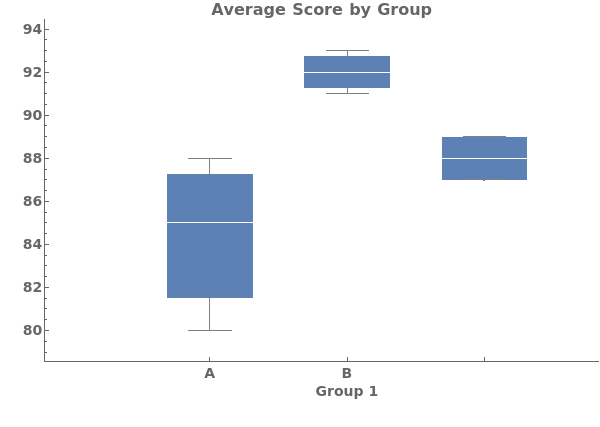
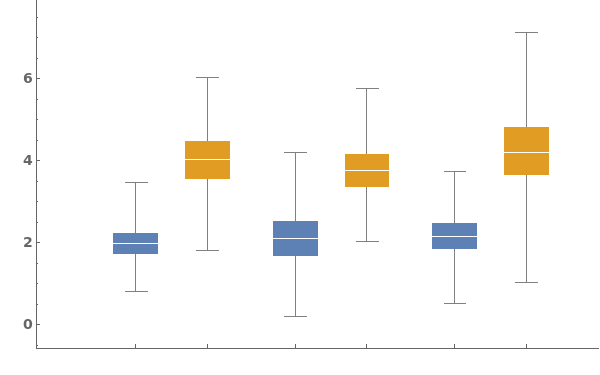
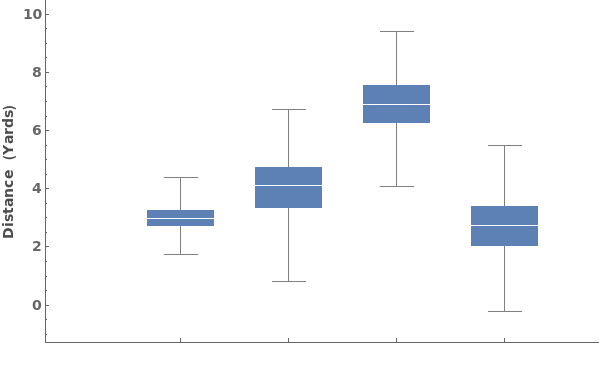
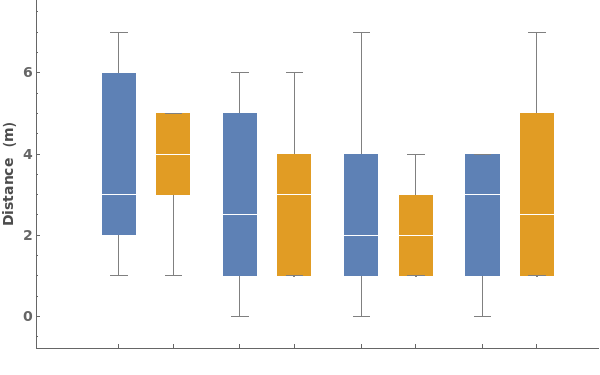
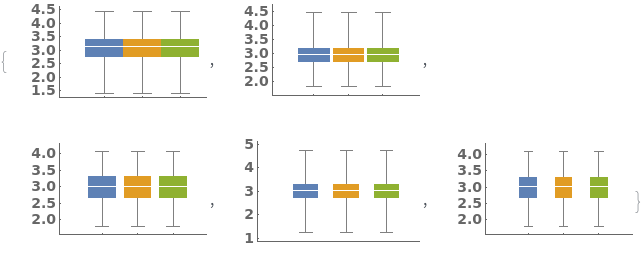
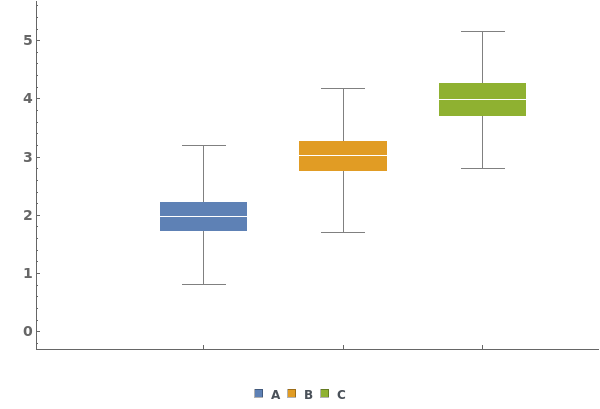
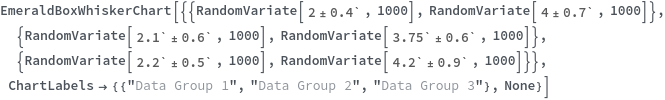
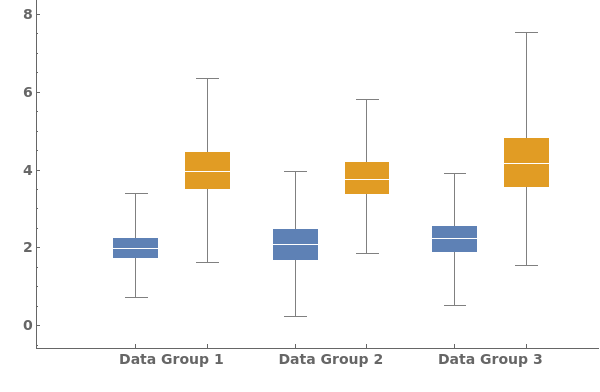
EmeraldBoxWhiskerChart[groupedDatasets]⟹chart
creates a BoxWhiskerChart displaying each group of datasets in groupedDatasets.
Details
Input
Output

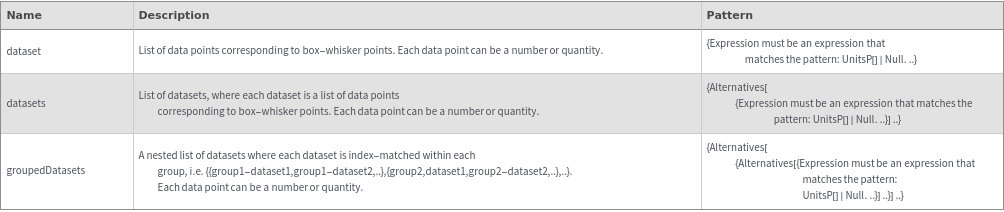
Data Specifications Options
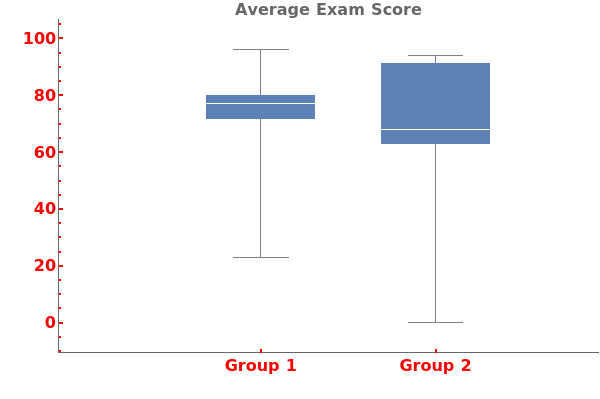
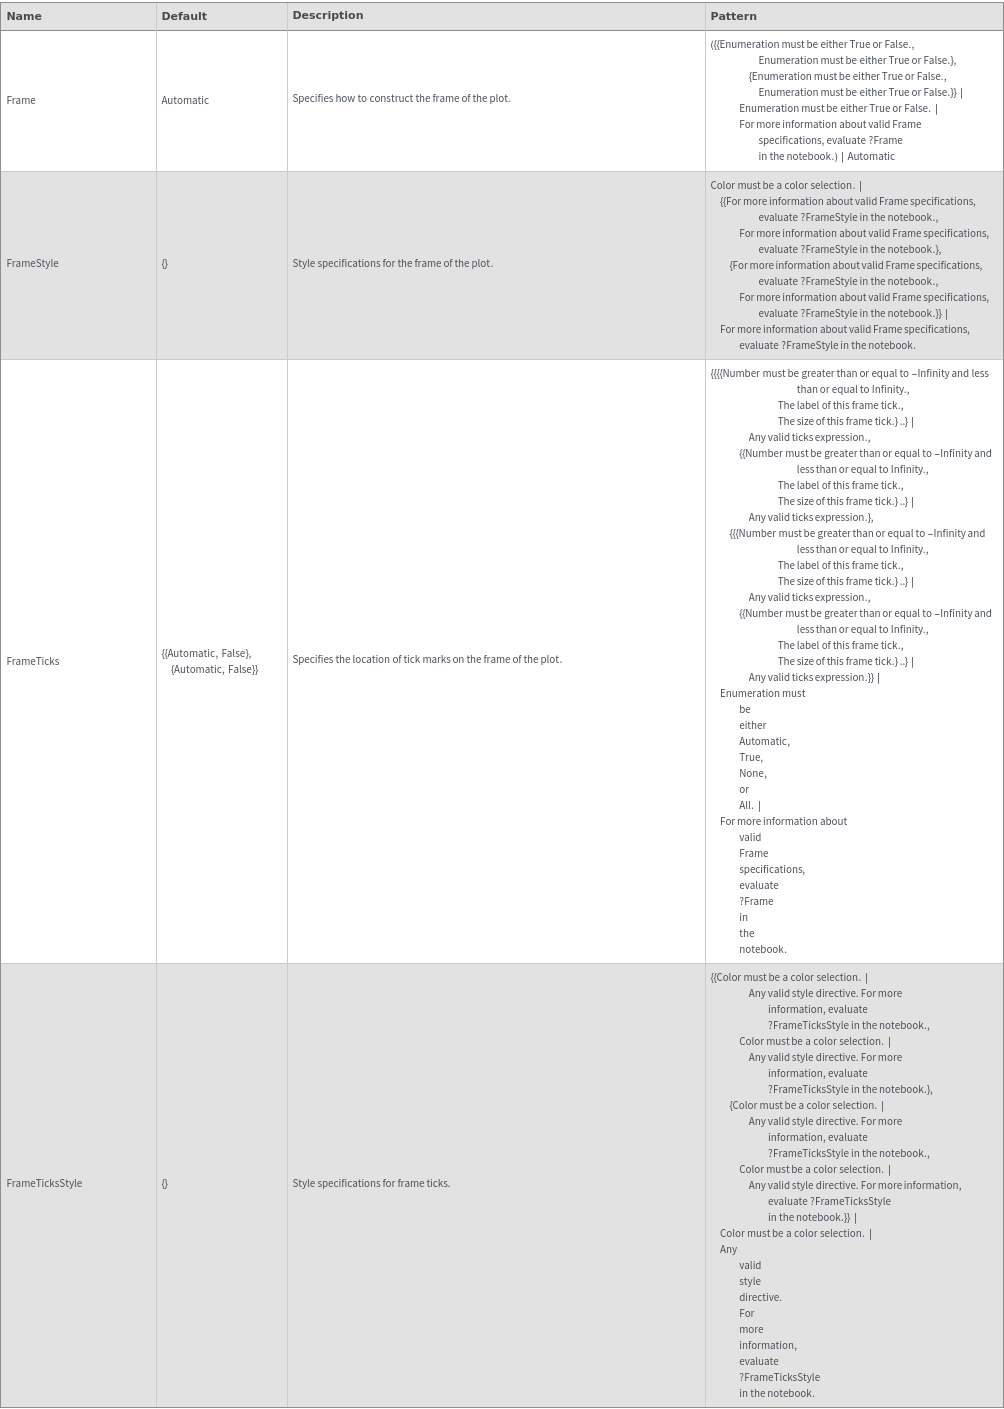
Frame Options
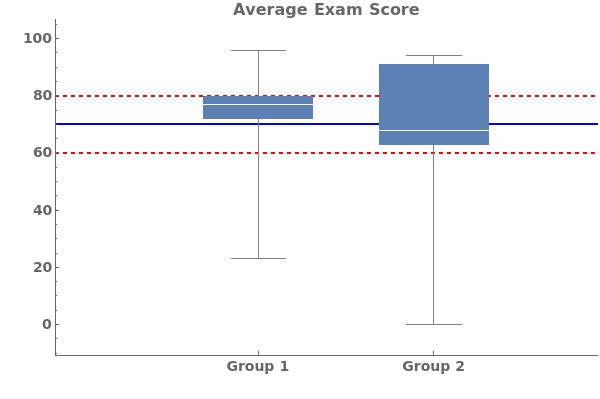
Grid Options
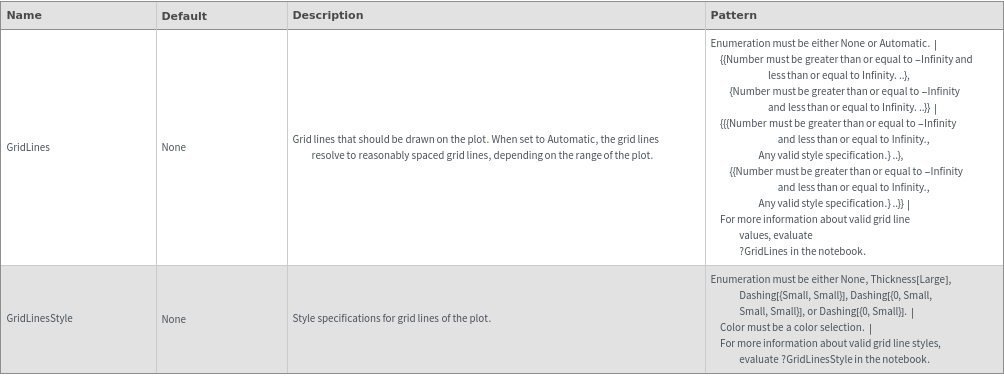
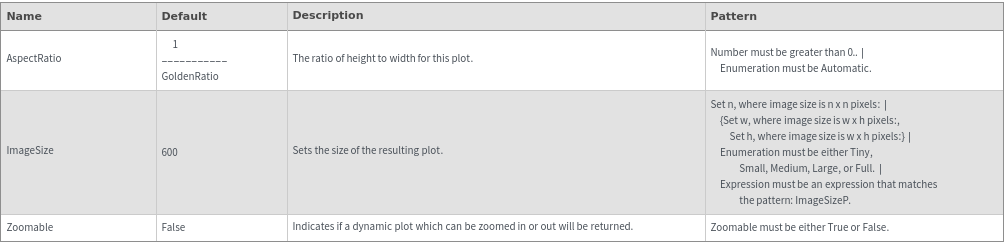
Image Format Options
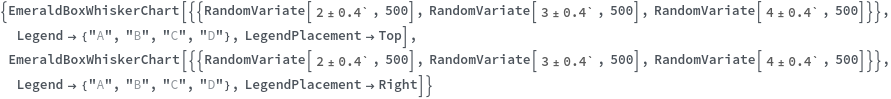
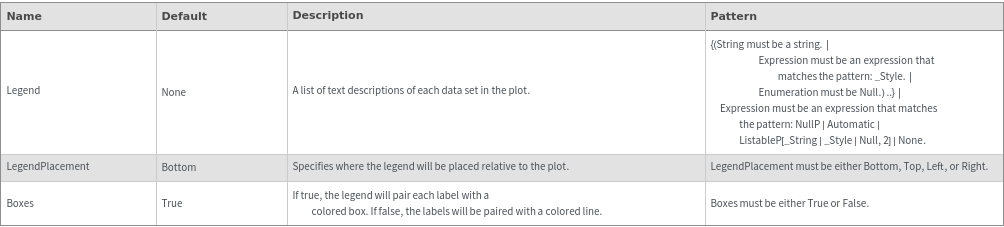
Legend Options
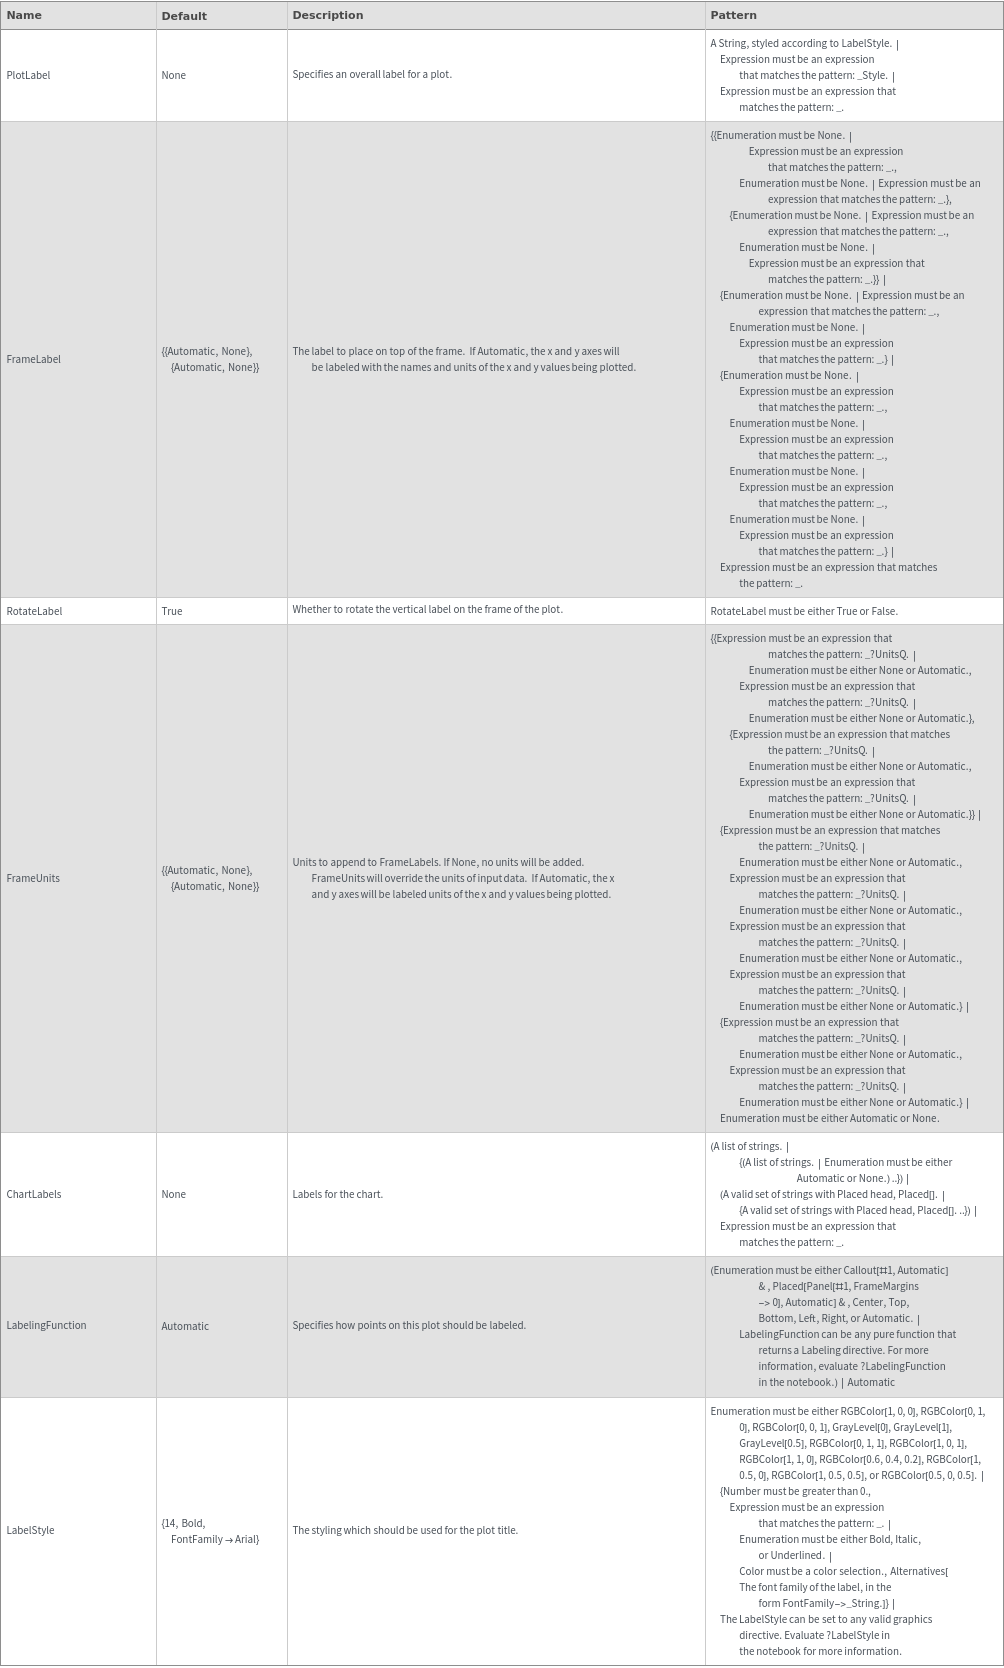
Plot Labeling Options
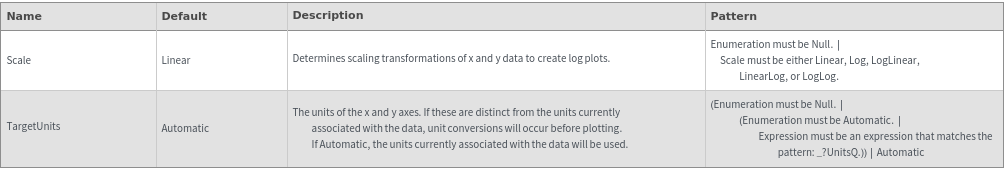
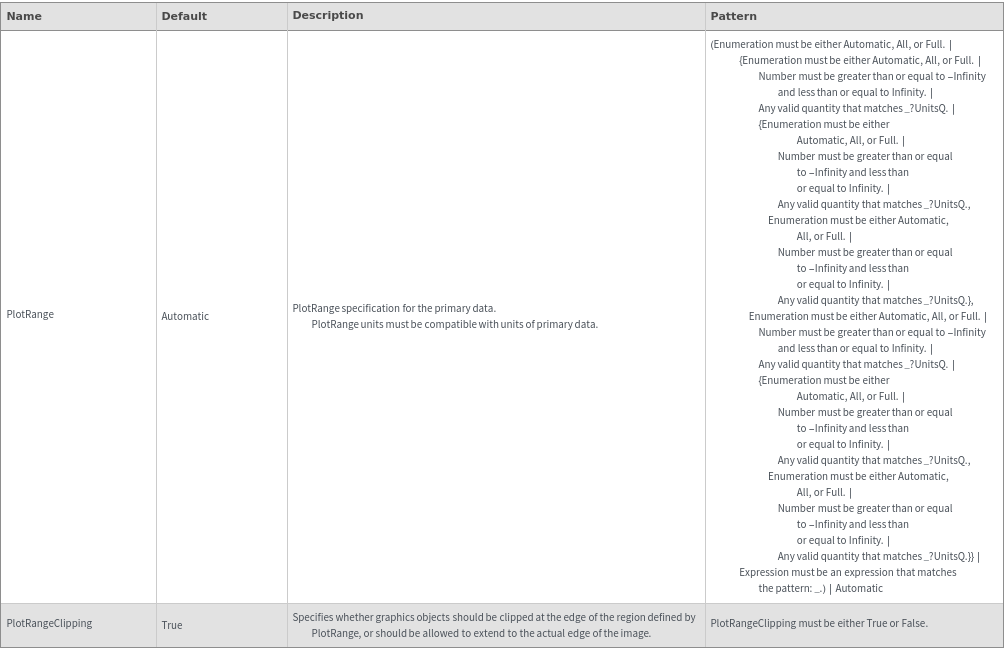
Plot Range Options
Plot Style Options
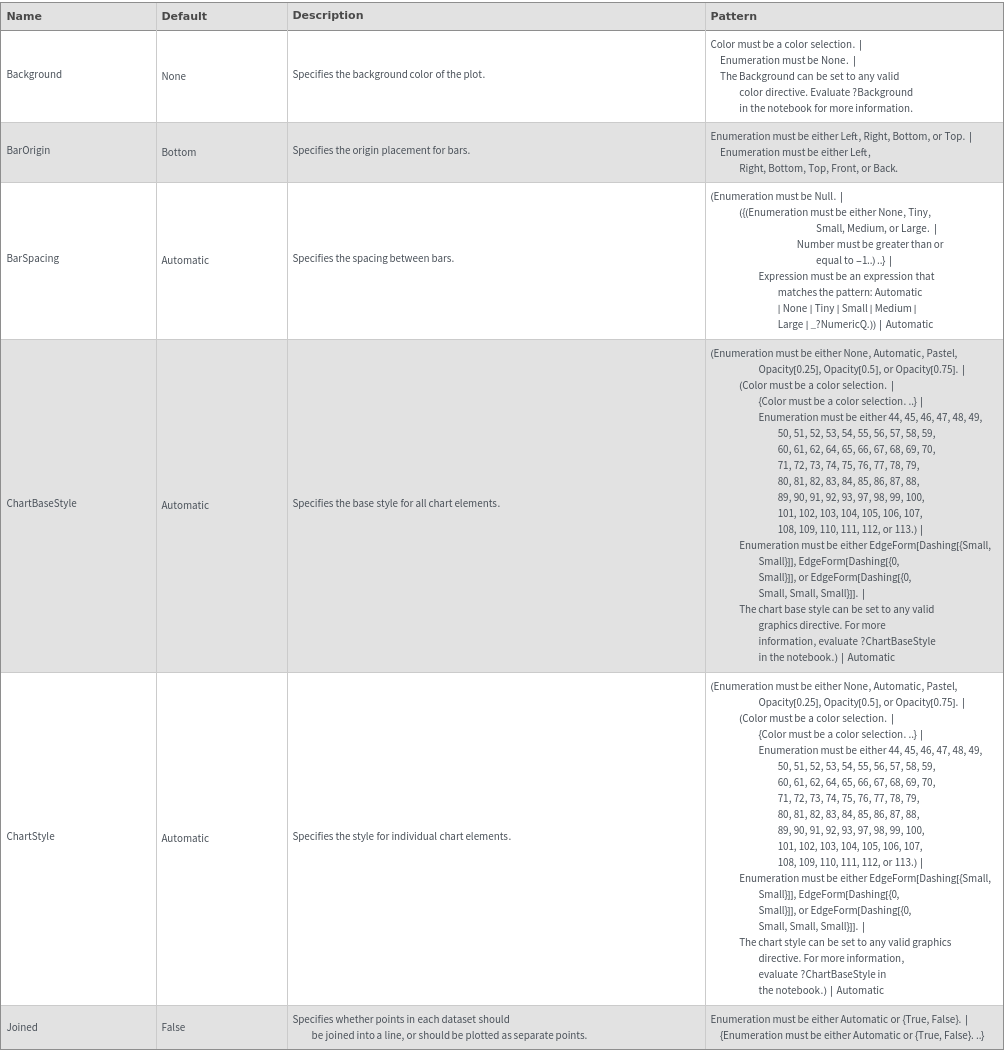
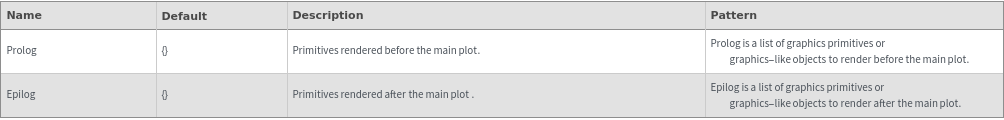
General Options
Examples
Basic Examples (4)


Additional Examples (9)
Missing Data (3)


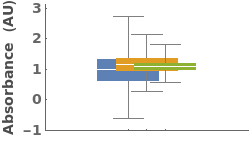
Quantity Arrays (4)


Options (57)


BarSpacing (4)
Specify the spacing between chart elements:

Specify the spacing between chart elements using explicit widths, where 1.0 corresponds to the width of a single box:

Specify the spacing between boxes and the spacing between groups, with the syntax {bars, groups}:


Set a negative spacing to force chart elements to overlap:


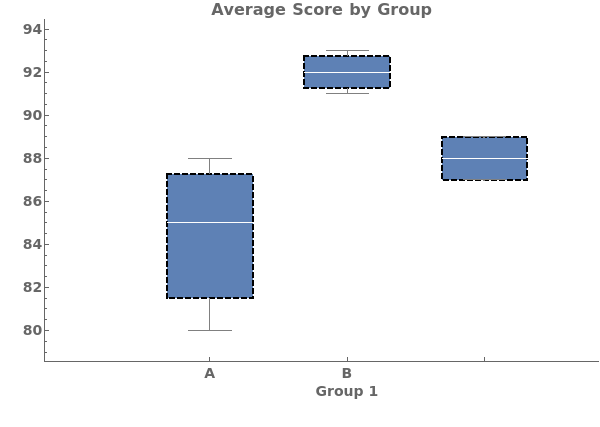
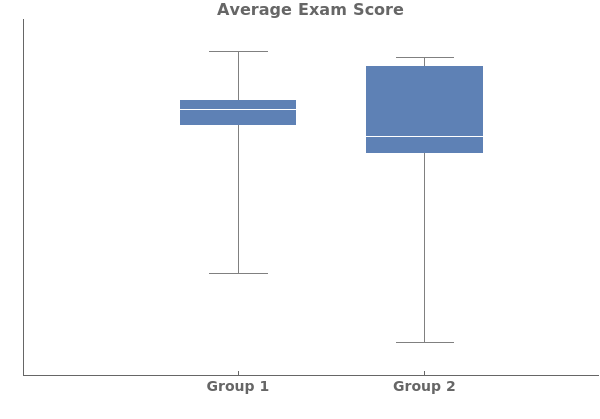
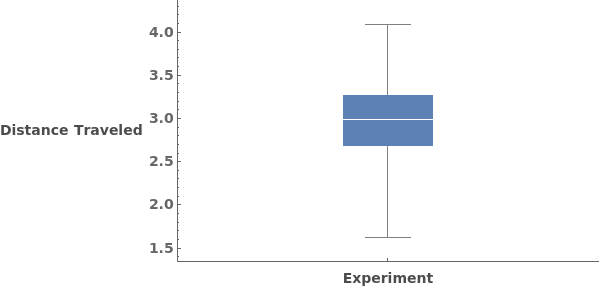
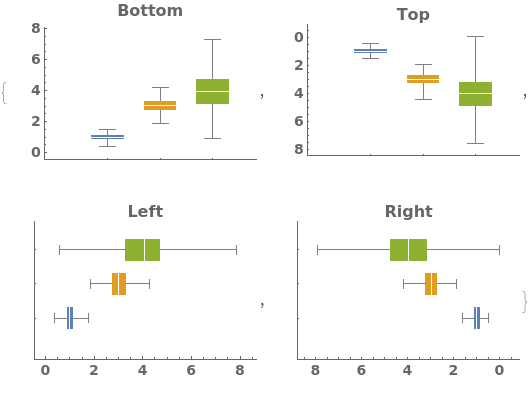
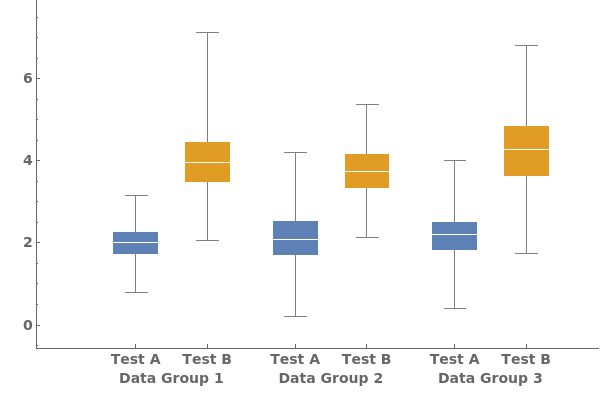
ChartLabels (3)


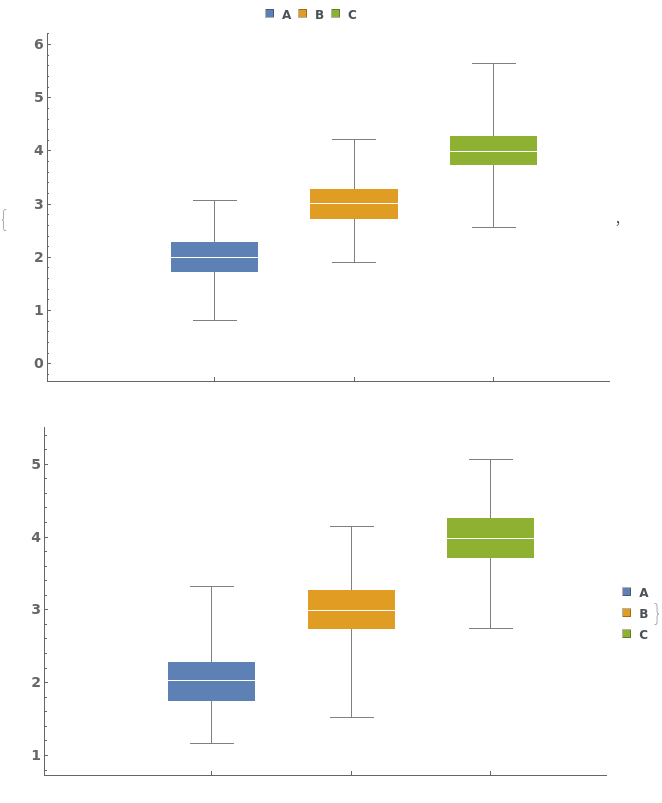
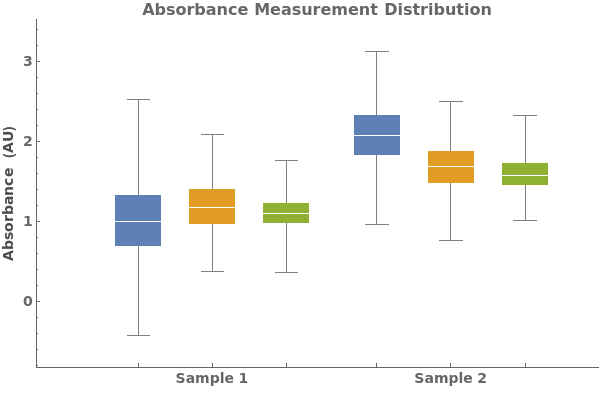
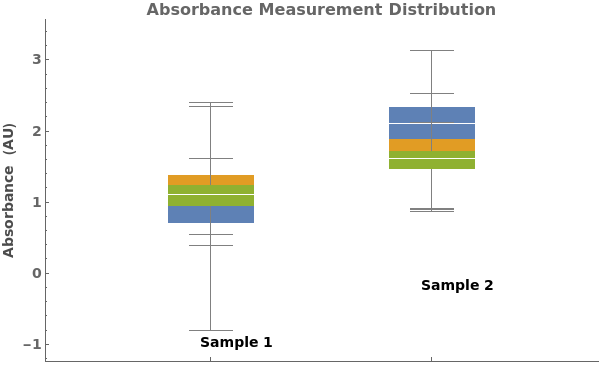
ChartLayout (2)


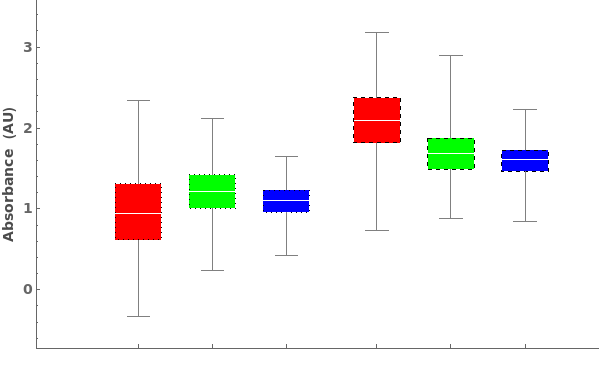
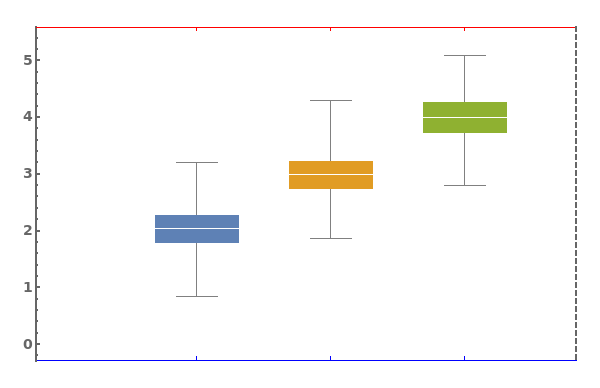
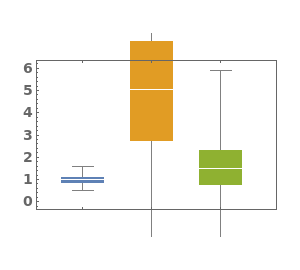
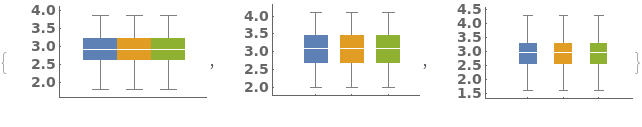
ChartStyle (5)
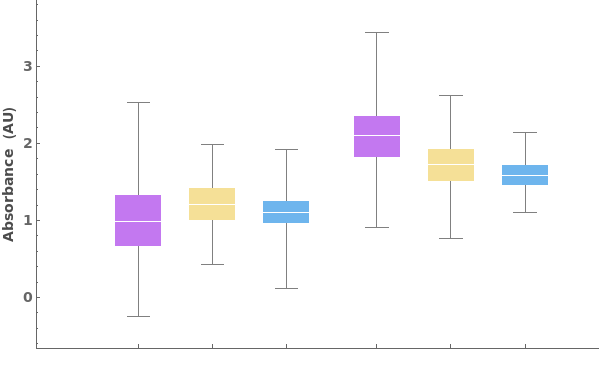
Pass a single argument to ChartStyle to style all boxes the same way:

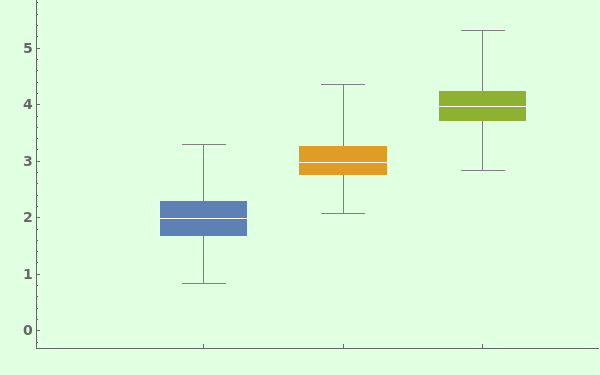
Style the chart using a named color scheme from ColorData[]:

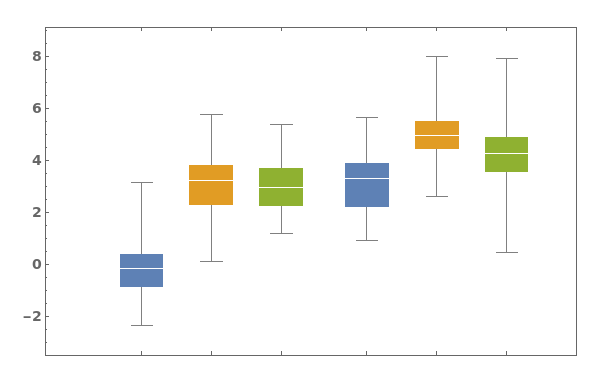
Pass a list of arguments to ChartStyle to apply different styles to each box in each group:

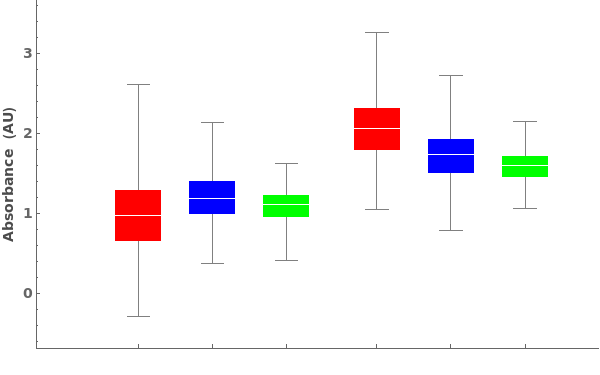
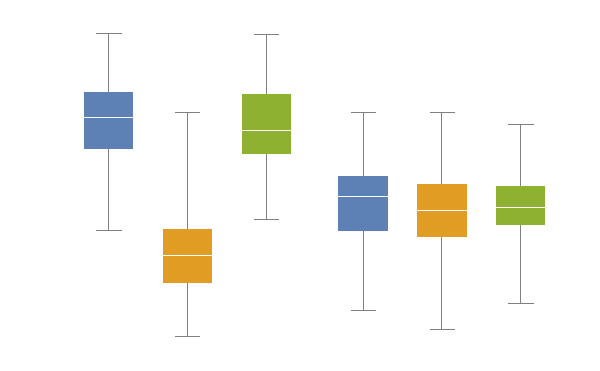
Style each group the same way:

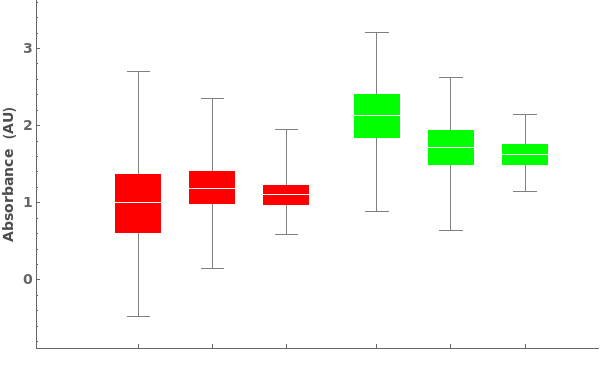
Style each group and each series of boxes in each group, in the format { {group1, group2,..}, {box1,box2,box3,...}}: