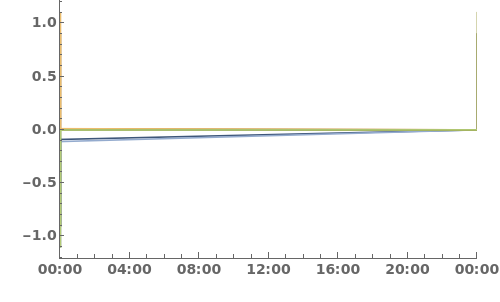
EmeraldDateListPlot
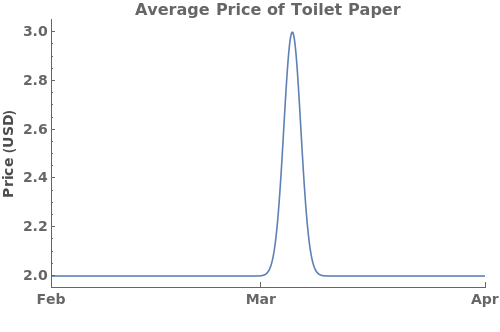
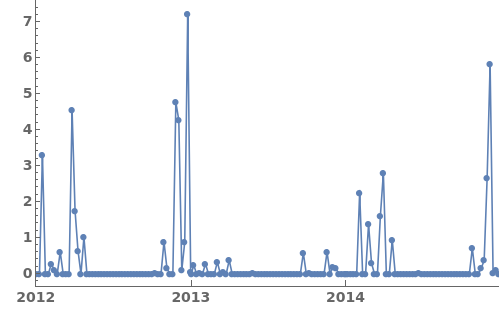
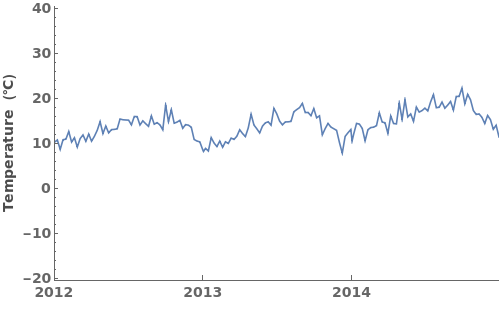
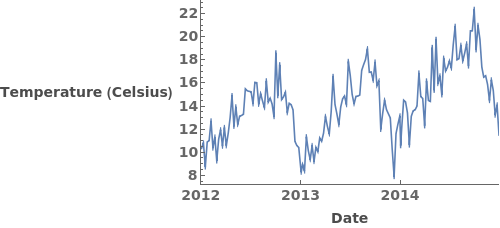
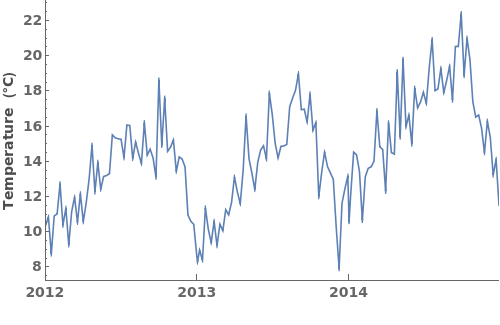
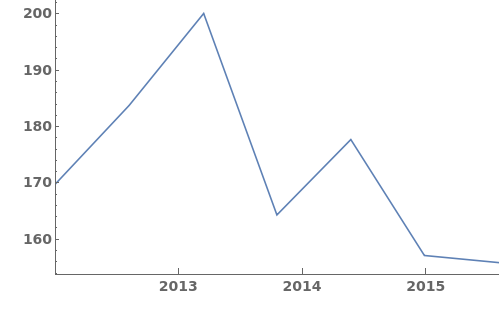
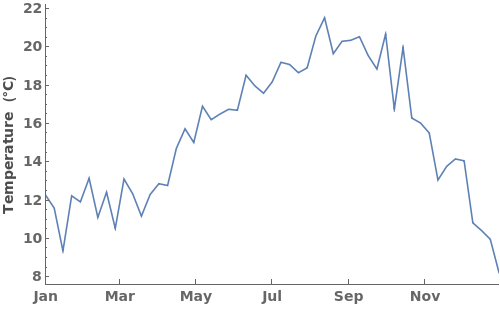
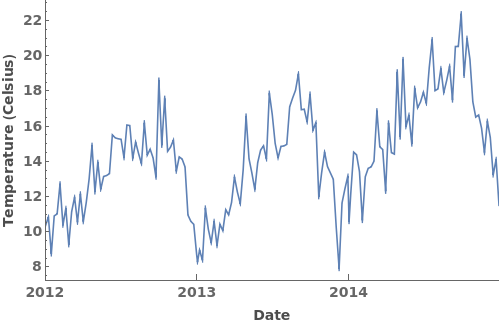
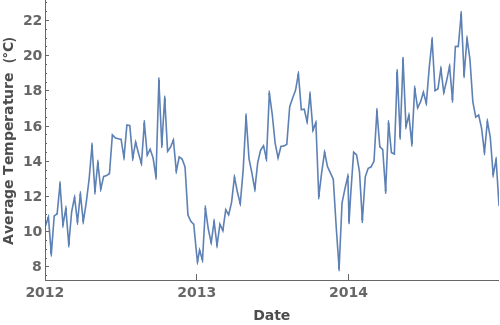
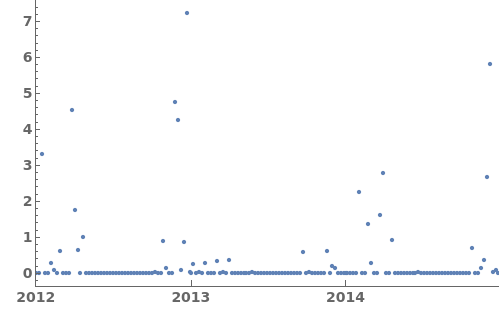
EmeraldDateListPlot[primaryData]⟹fig
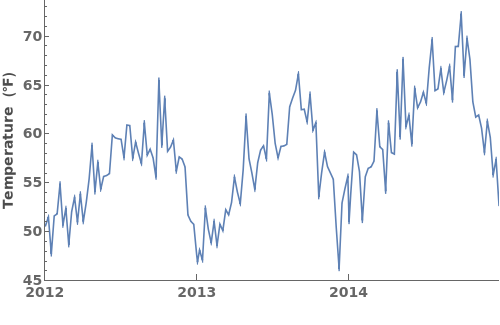
creates a DateListPlot of primaryData.
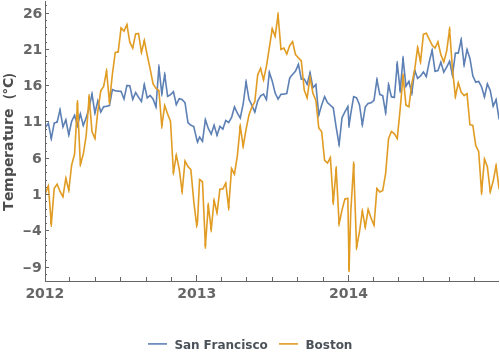
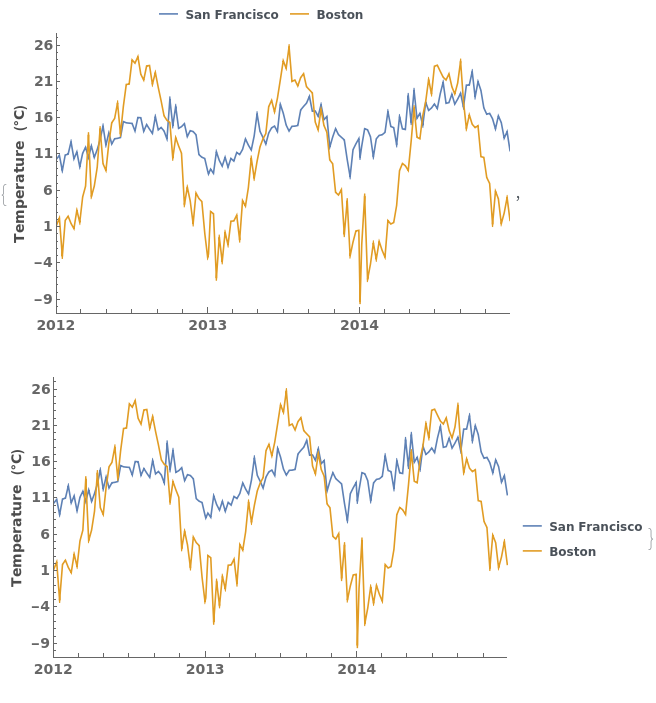
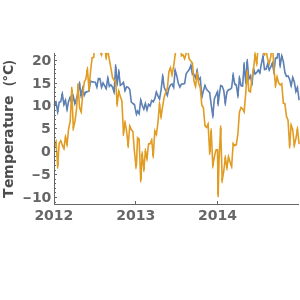
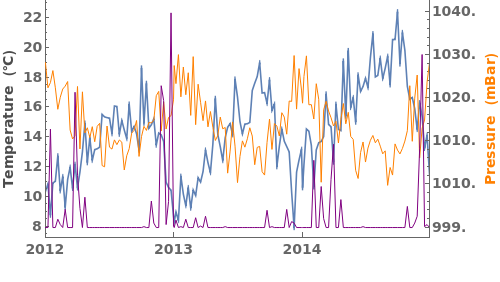
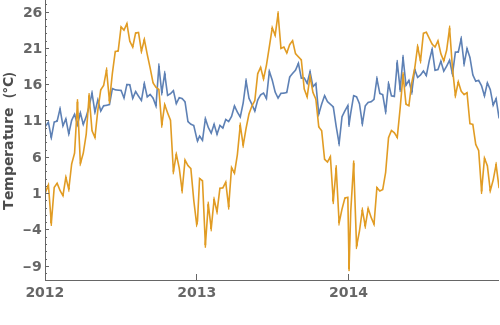
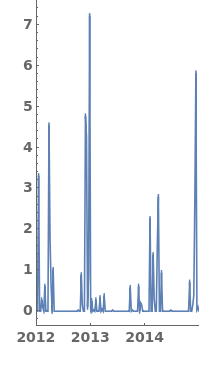
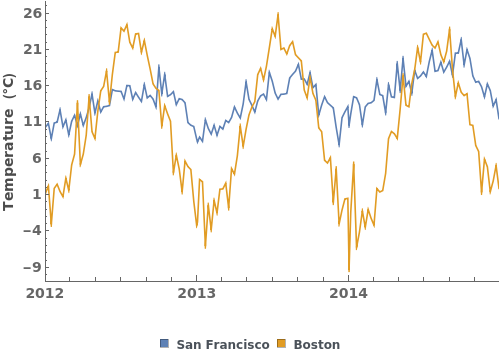
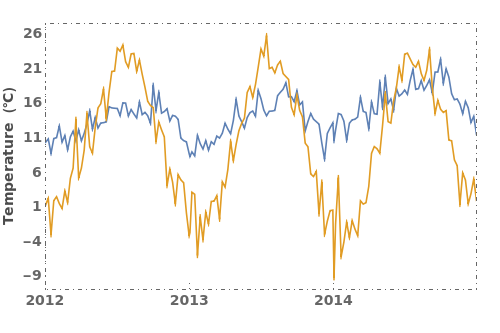
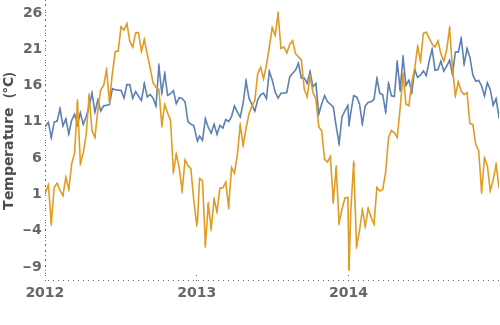
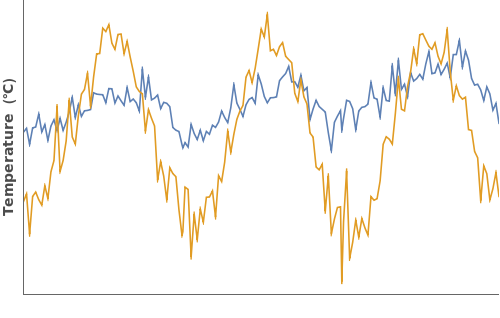
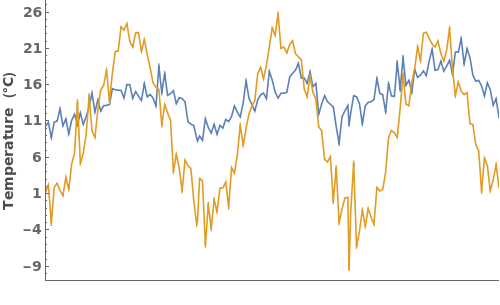
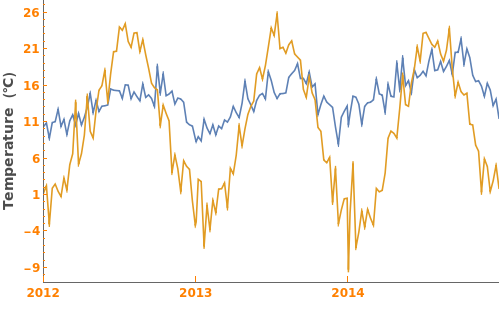
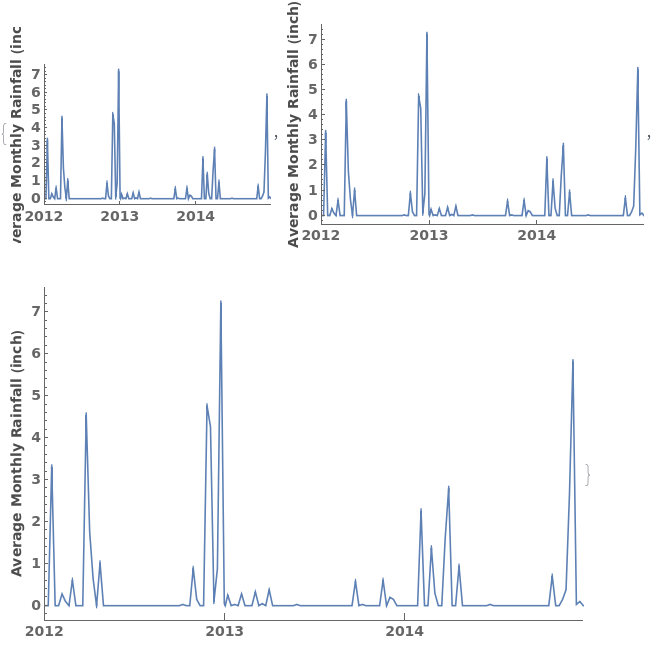
EmeraldDateListPlot[datasets]⟹fig
overlays each dataset in datasets onto a single figure.
Details
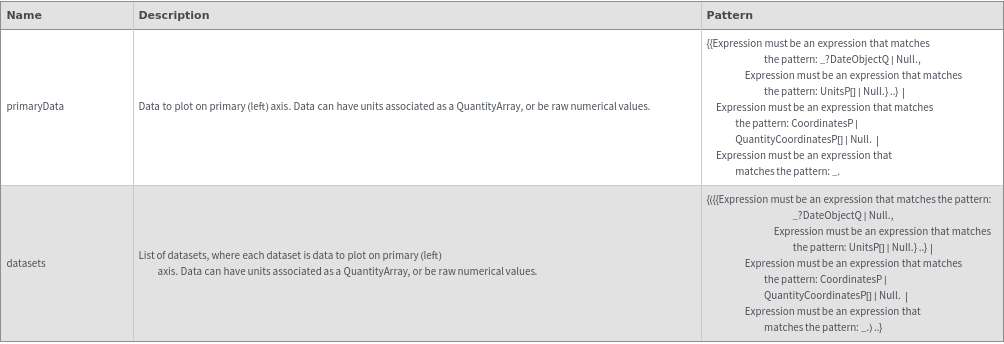
Input
Output

Data Specifications Options
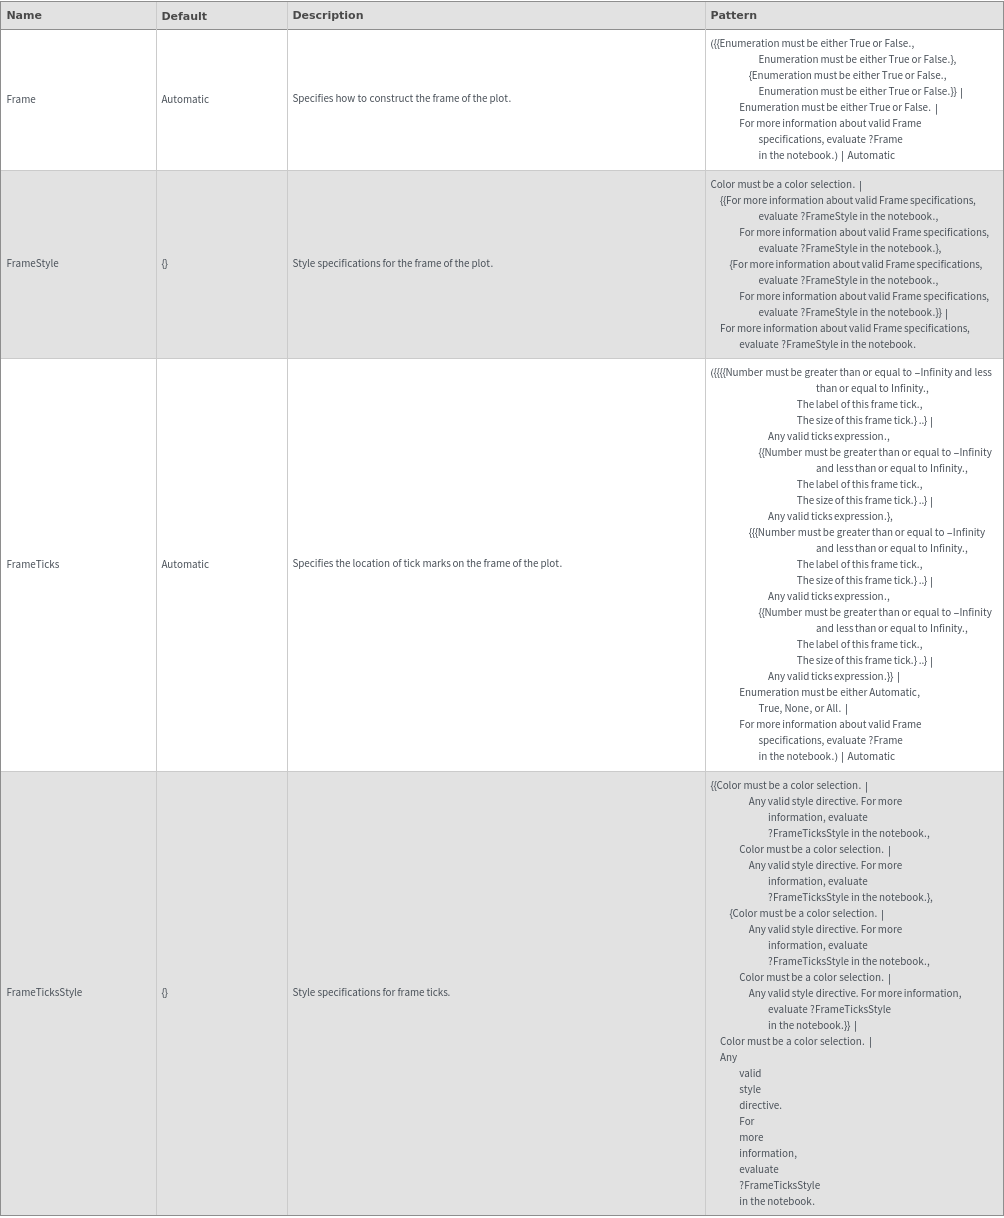
Frame Options
Grid Options
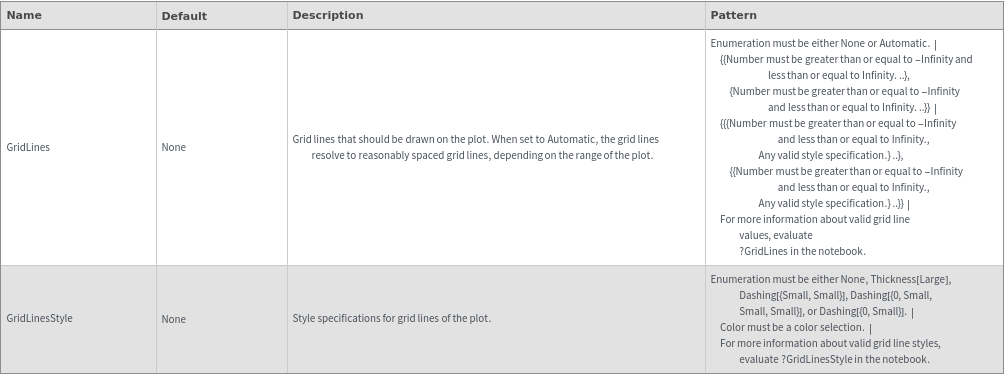
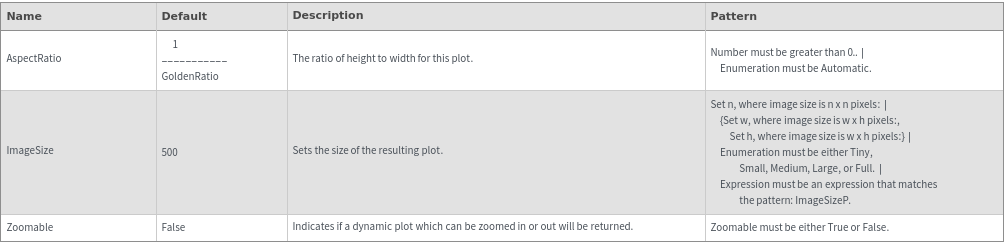
Image Format Options
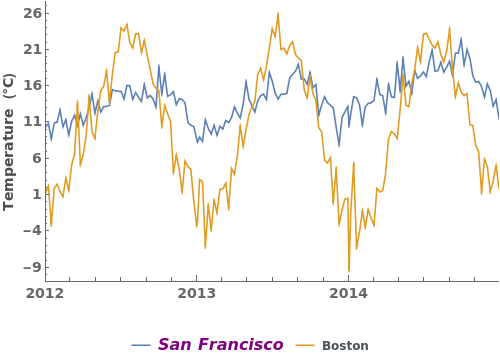
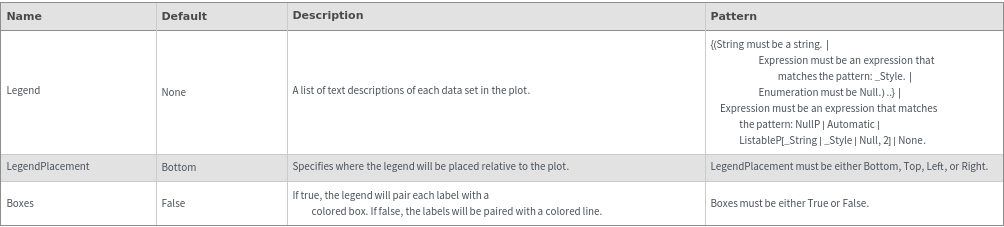
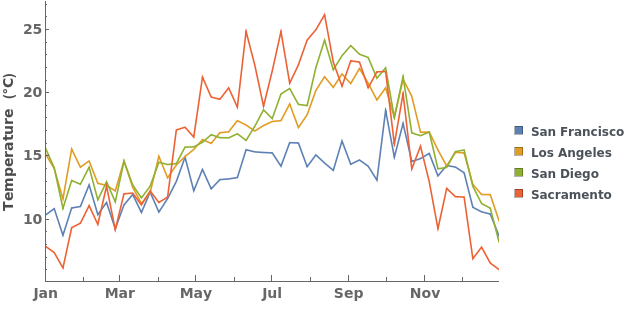
Legend Options
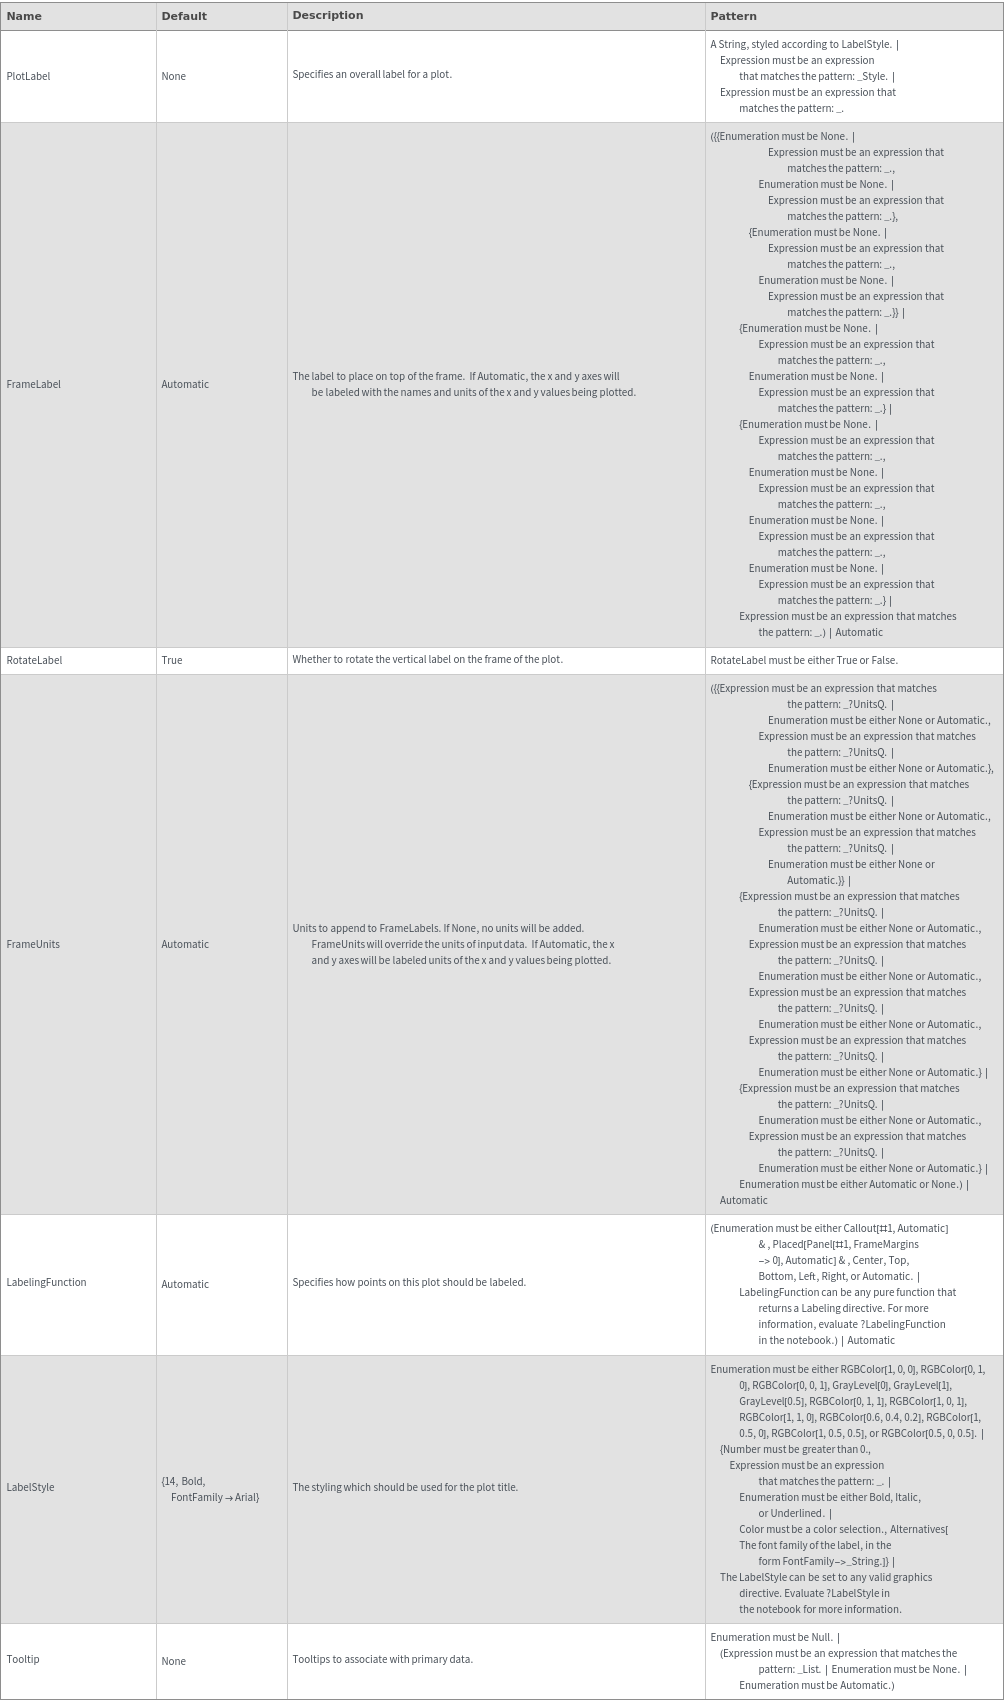
Plot Labeling Options
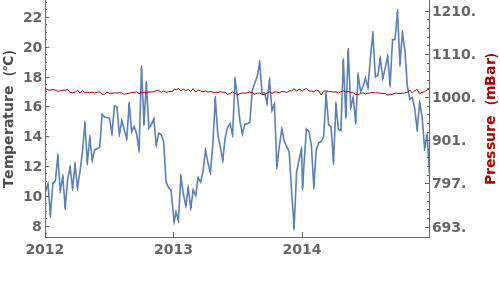
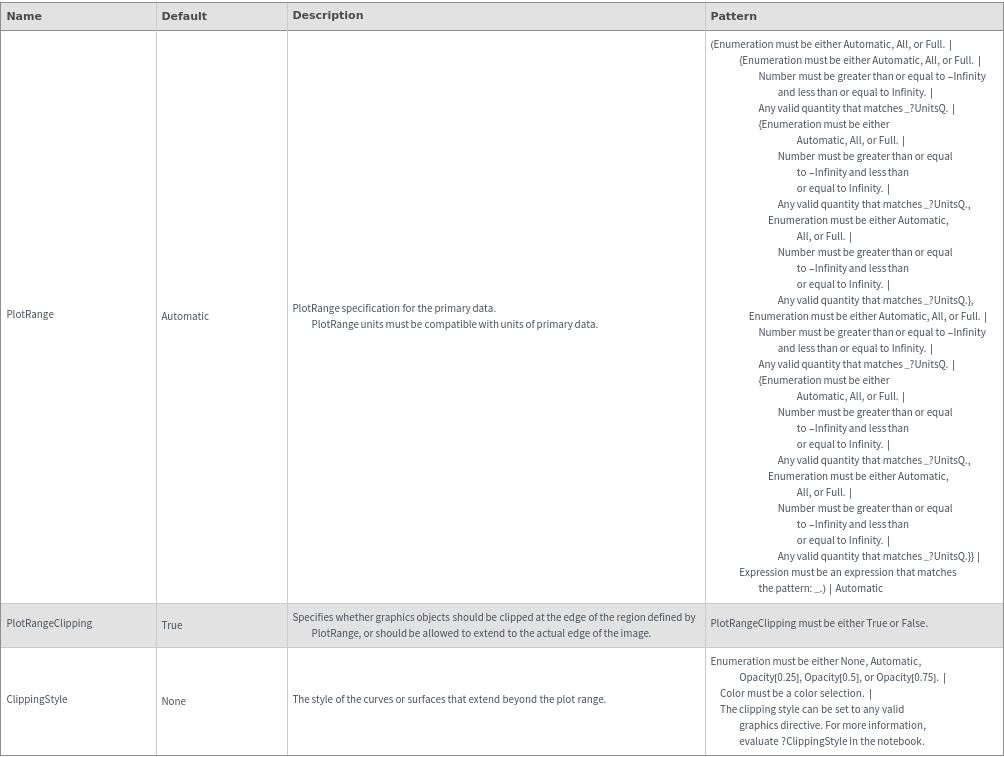
Plot Range Options
Plot Style Options
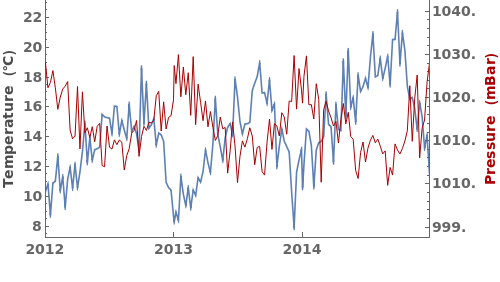
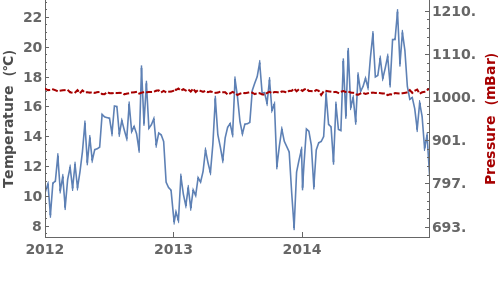
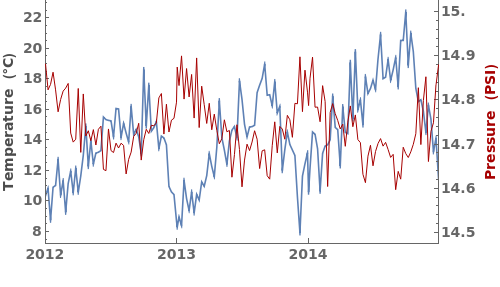
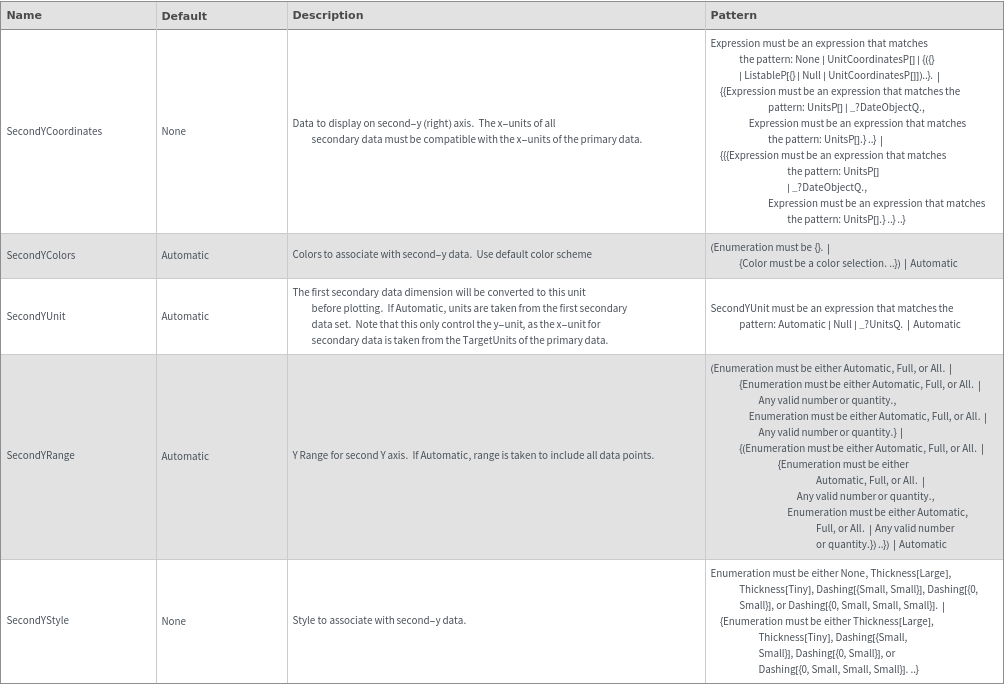
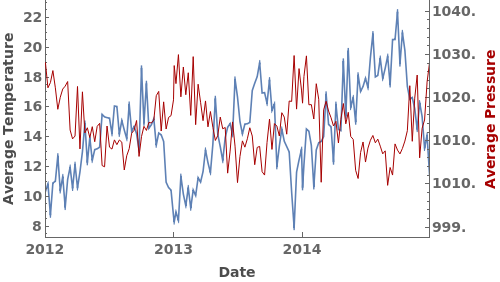
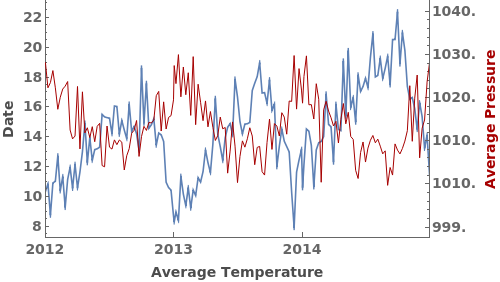
Secondary Data Options
General Options
Examples
Basic Examples (3)


Additional Examples (4)


Options (73)


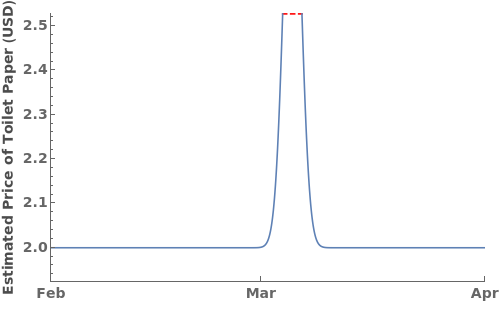
ClippingStyle (1)

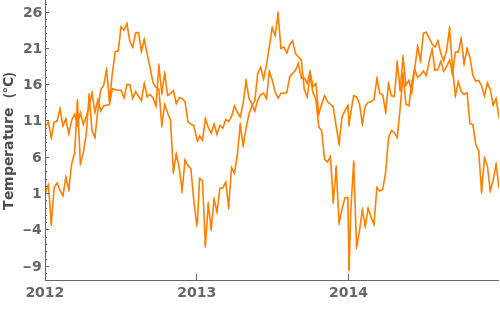
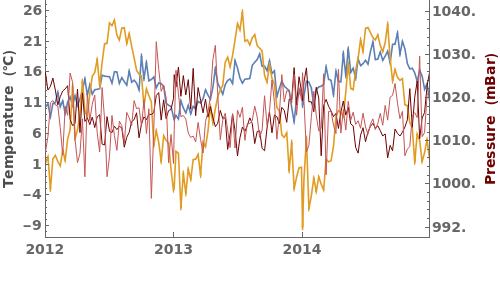
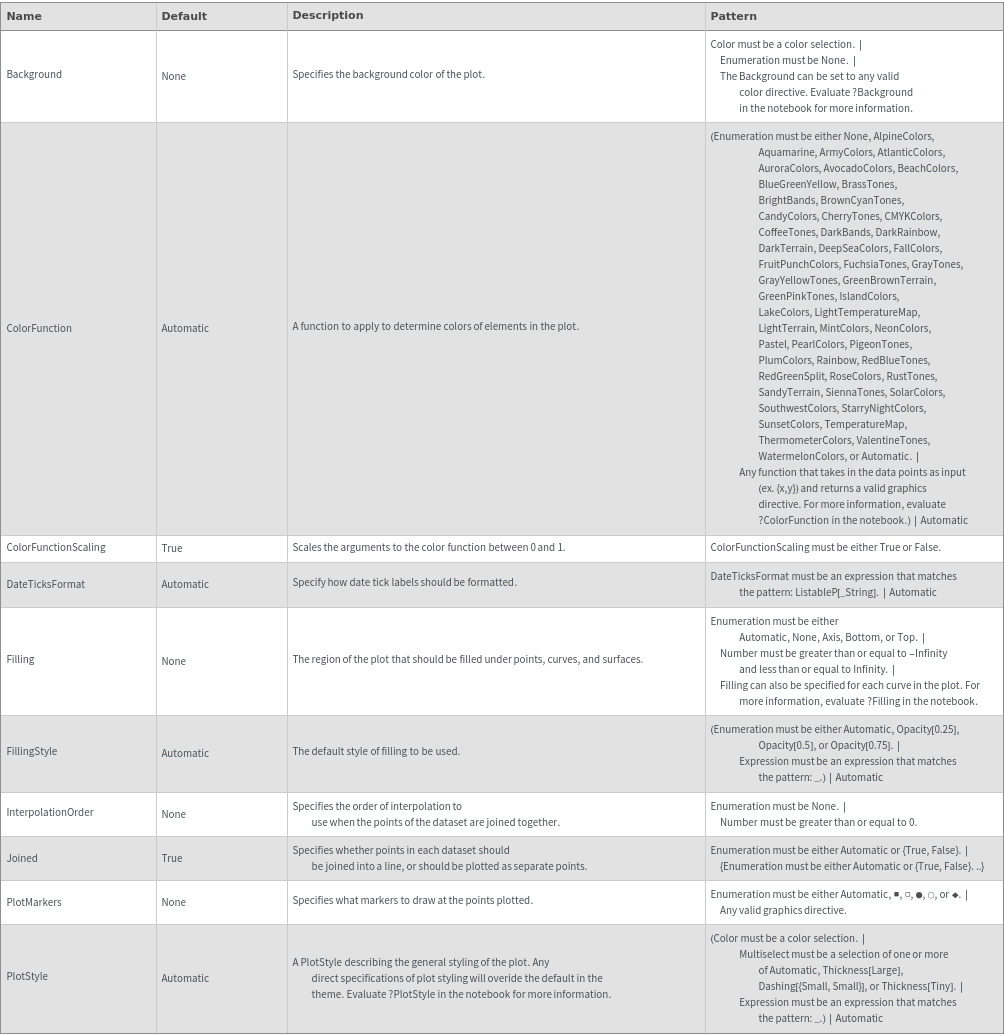
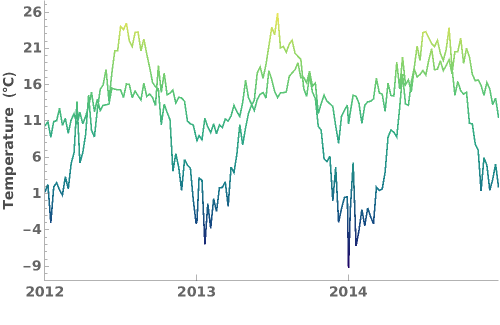
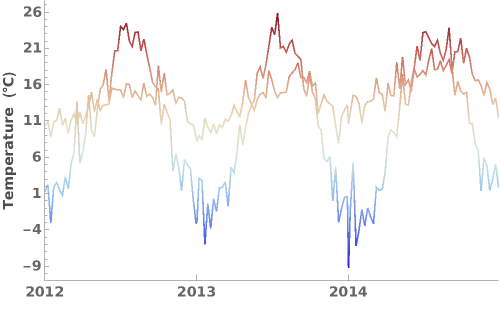
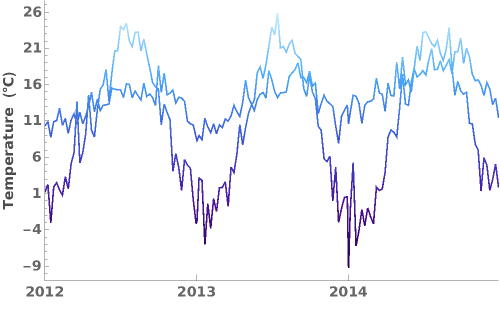
ColorFunction (3)
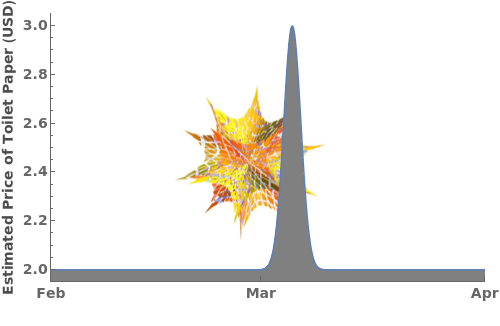
Specify a coloring function for the lines in our plot. To see all of the built in ColorFunctions, evaluate ColorData["Gradients"] in the notebook:

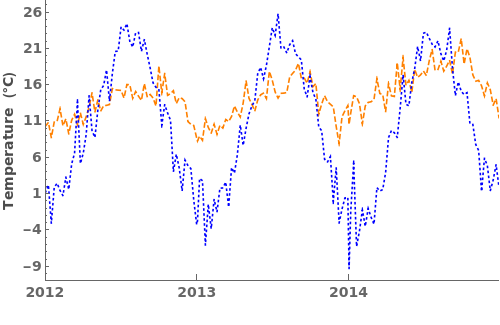
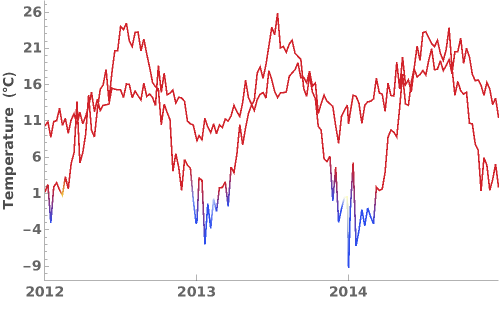
Specify a coloring function for the lines in our plot. To see all of the built in ColorFunctions, evaluate ColorData["Gradients"] in the notebook:

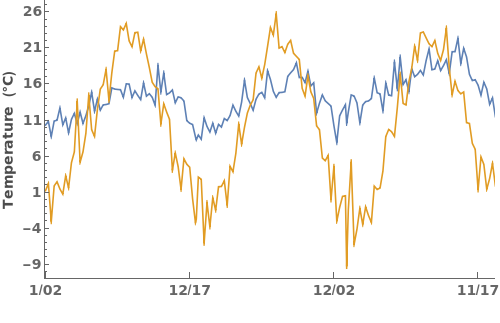
Specify a coloring function for the lines in our plot. To see all of the built in ColorFunctions, evaluate ColorData["Gradients"] in the notebook:

ColorFunctionScaling (1)

DateTicksFormat (2)
Apply MM/DD formatting to the date ticks, using the "MonthShort" and "Day" date strings as placeholders for the month and day in the data. To see a full list of special DateStrings, please run ?DateString in the notebook:

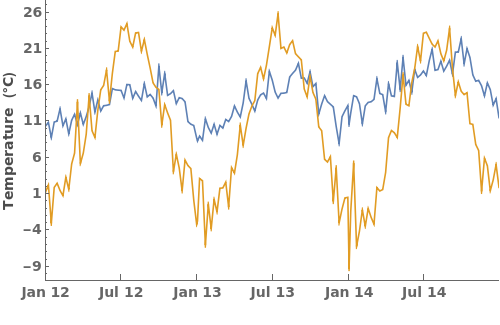
Use the abbreviated name of the month and the last two digits of the year to format date ticks:

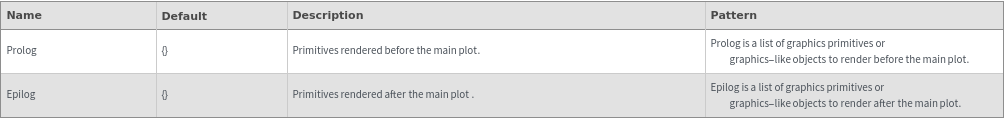
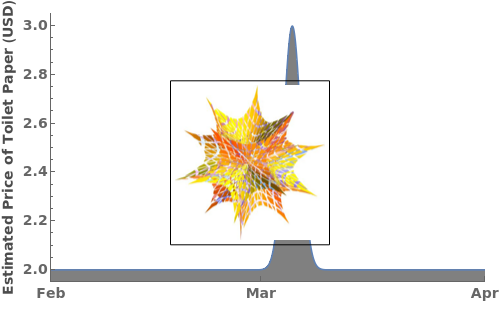
Epilog (1)

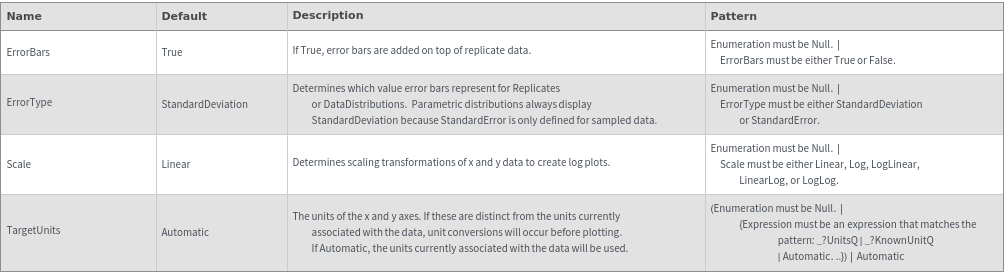
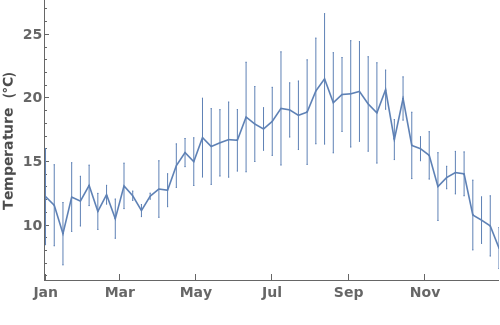
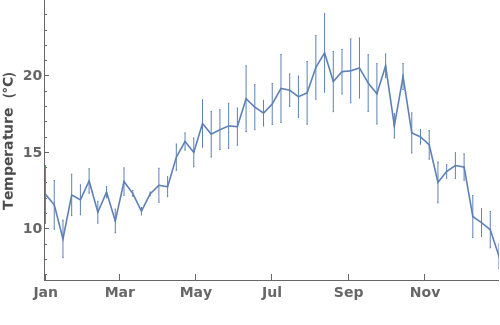
ErrorBars (2)


ErrorType (2)


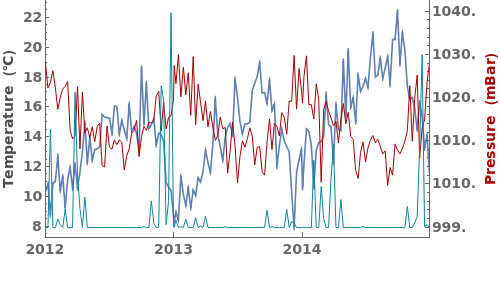
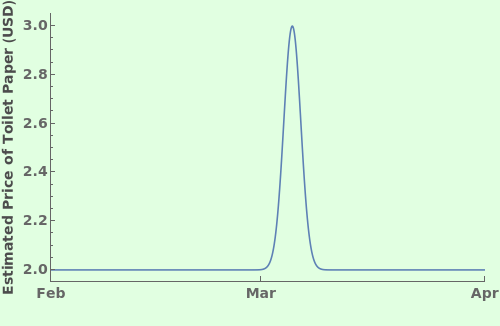
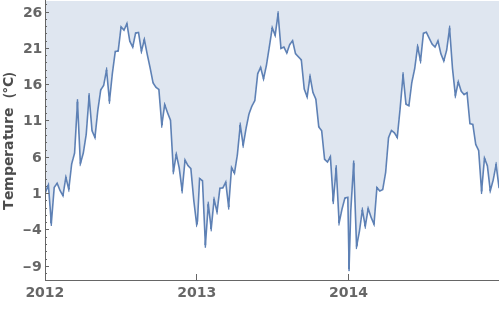
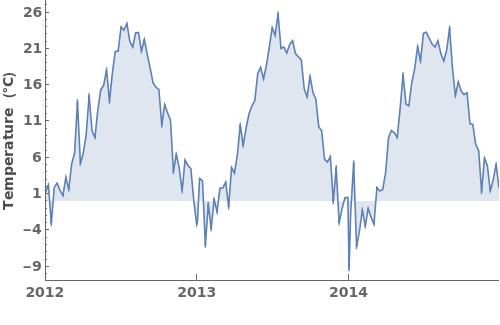
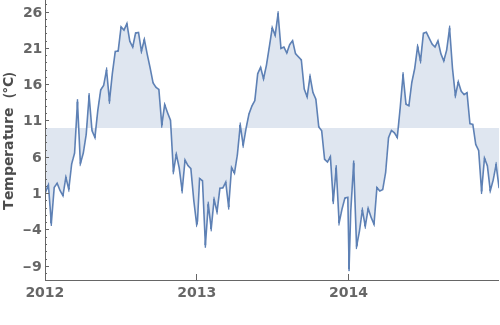
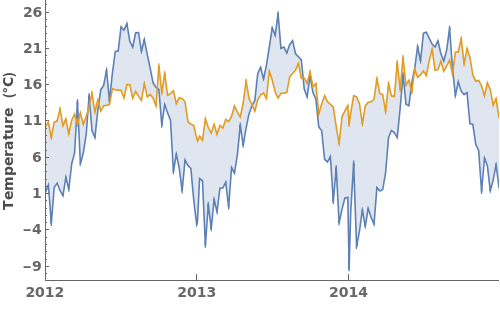
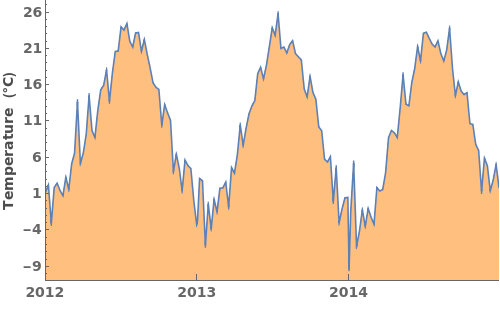
Filling (5)


FillingStyle (1)

Frame (2)
Specify which parts of the plot's frame should be visible. Frame is specified in the format {{Left Frame, Right Frame},{Bottom Frame, Top Frame}}. In the following example, all frame borders are visible:

Specify which parts of the plot's frame should be visible. Frame is specified in the format {{Left Frame, Right Frame},{Bottom Frame, Top Frame}}. In the following example, only the left and bottom frame borders are visible:


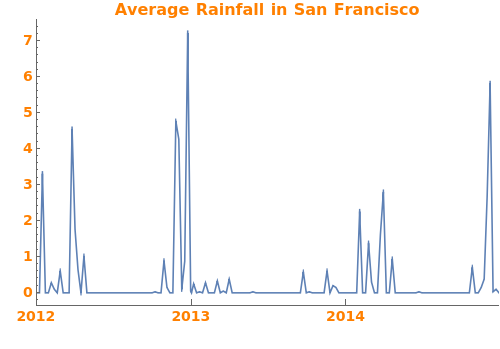
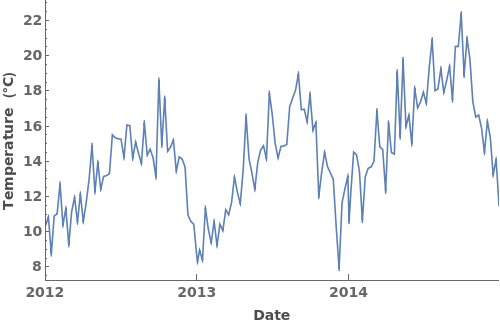
FrameLabel (4)


FrameStyle (3)
Specify the style of the plot's frame. FrameStyle can be set to any valid graphics directive. For more information, evaluate ?FrameStyle in the notebook:

Specify the style of the plot's frame. FrameStyle can be set to any valid graphics directive. For more information, evaluate ?FrameStyle in the notebook:

Specify the style of the plot's frame. FrameStyle can be set to any valid graphics directive. For more information, evaluate ?FrameStyle in the notebook:


FrameTicks (2)


FrameTicksStyle (1)


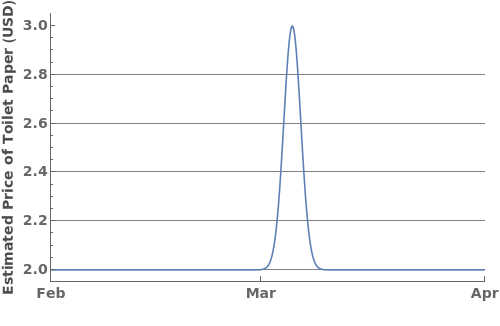
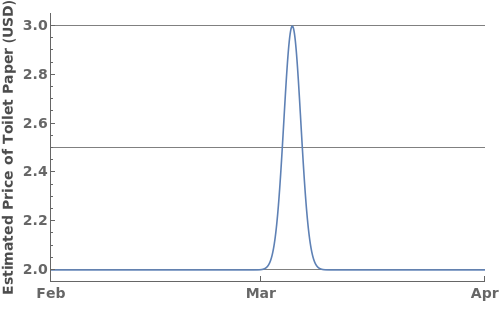
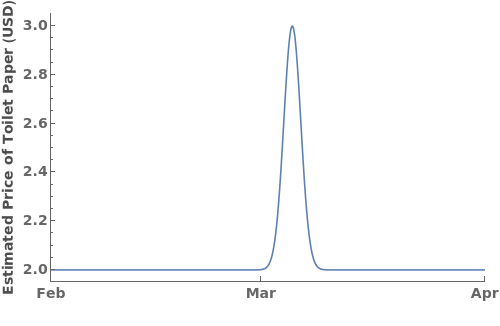
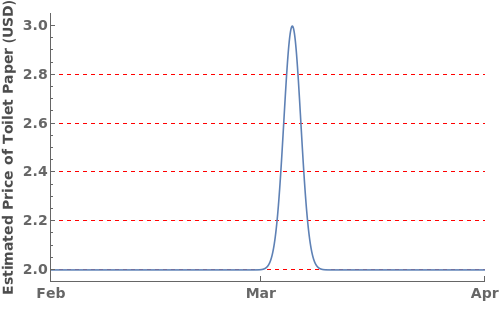
GridLines (3)


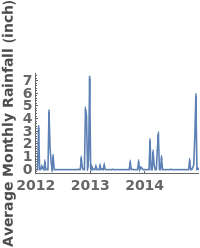
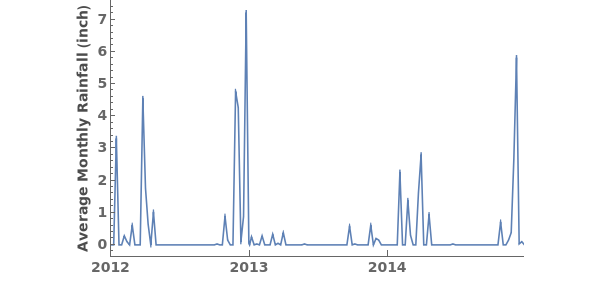
ImageSize (3)


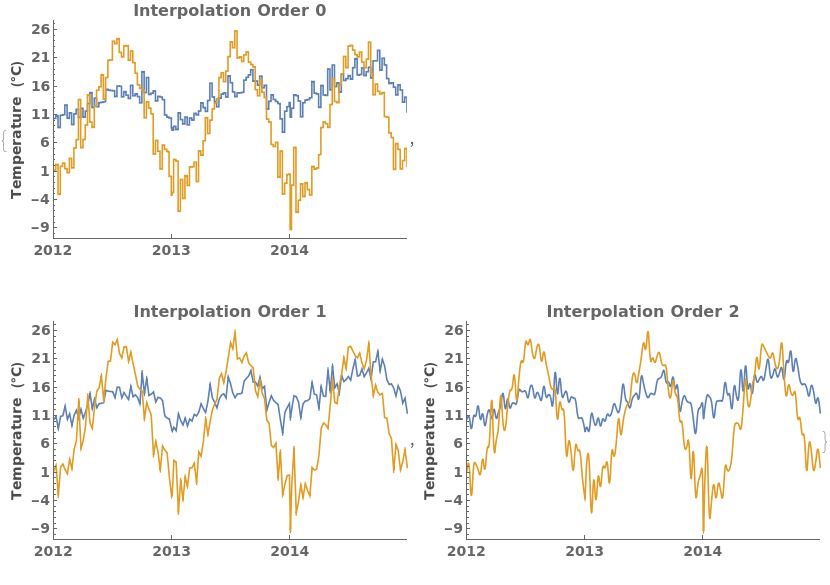
InterpolationOrder (1)


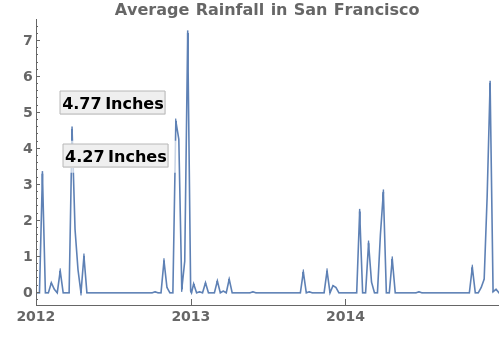
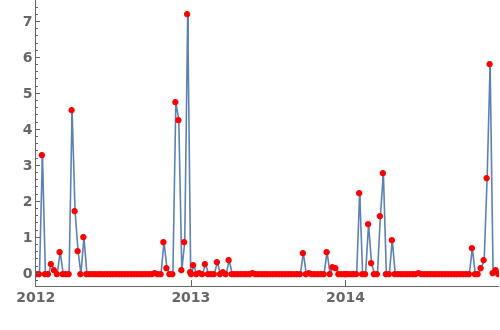
LabelingFunction (1)
Specify a pure function that generates labels for each point in the plot. This function should take in coordinates and return graphics primitives. For example, the following LabelingFunction creates a text label for each data point with a y-value greater than 4.0. For more information, evaluate ?LabelingFunction in the notebook: