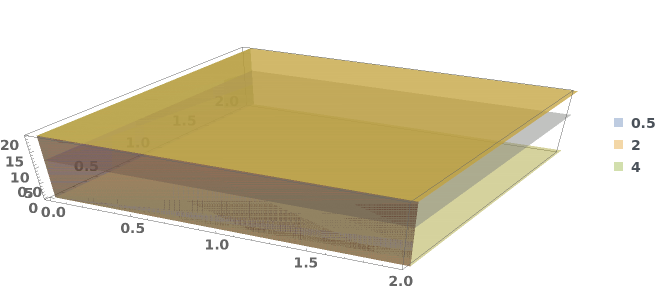
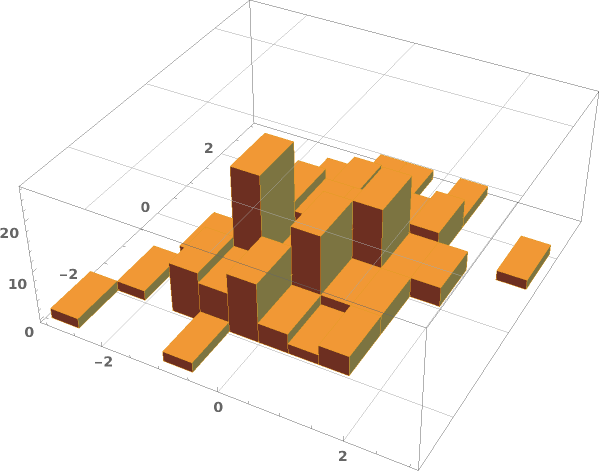
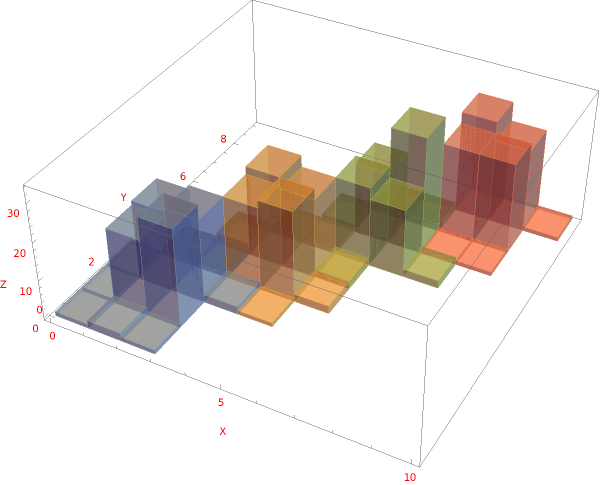
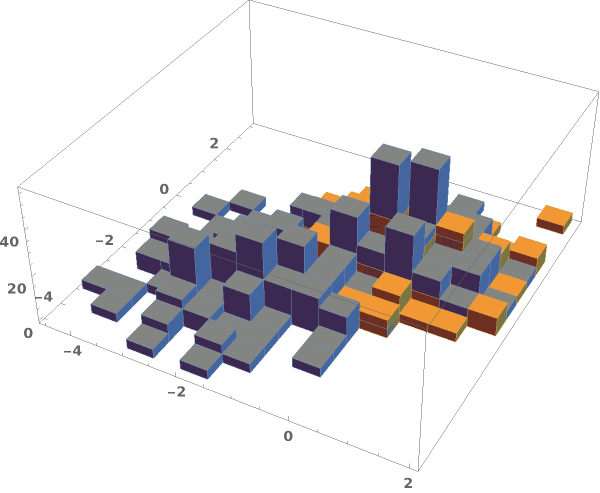
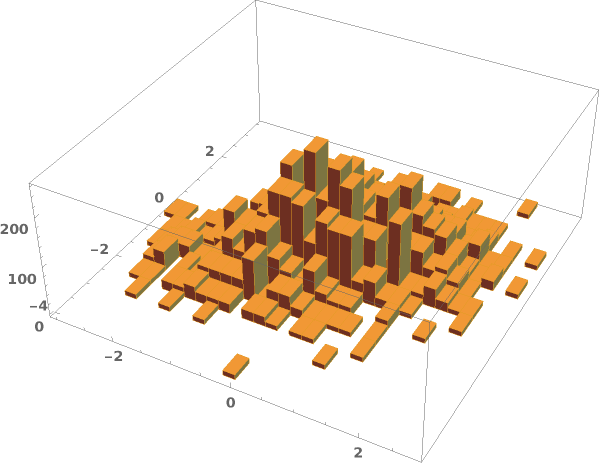
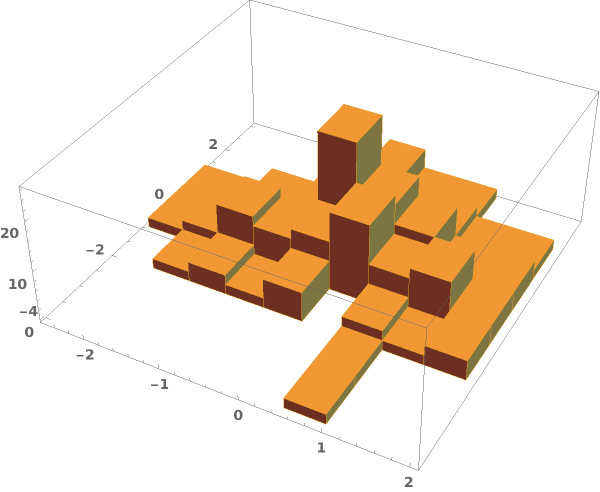
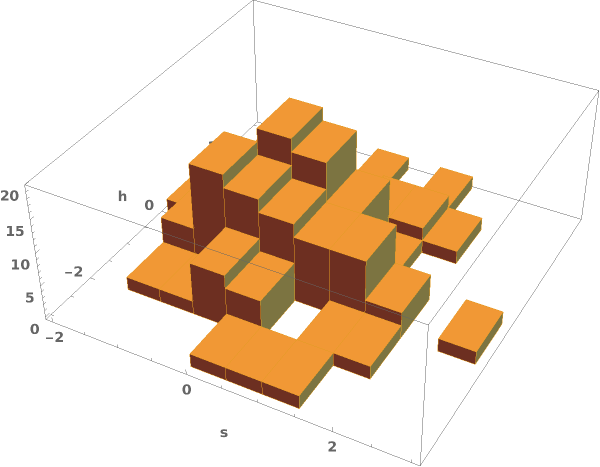
EmeraldHistogram3D
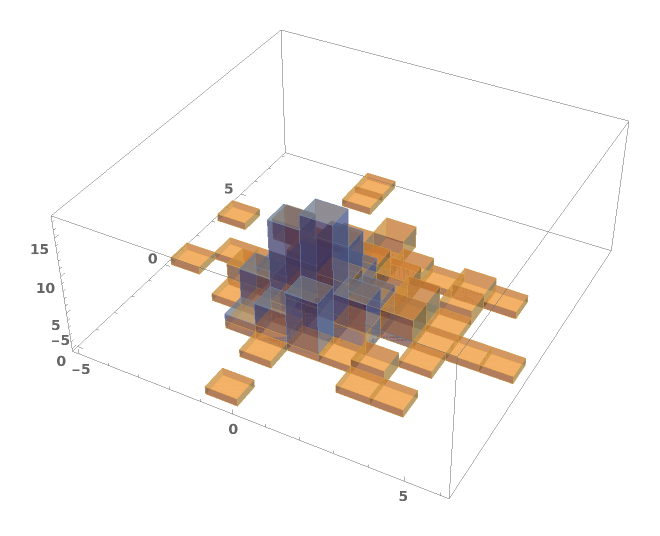
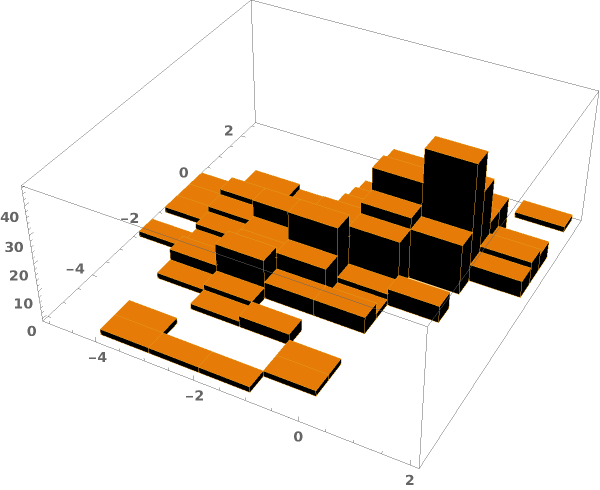
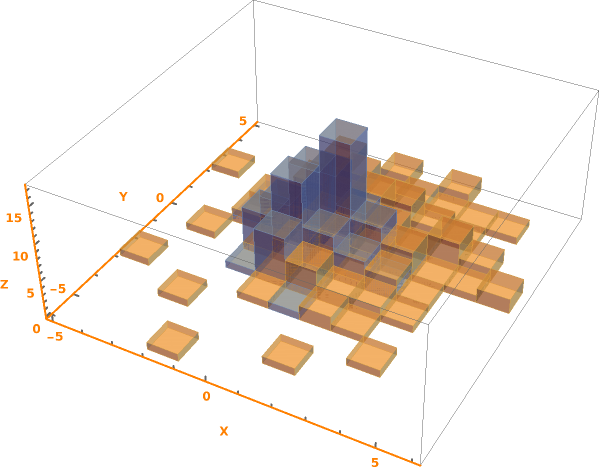
EmeraldHistogram3D[dataset]⟹chart
creates a Histogram3D from the provided dataset.
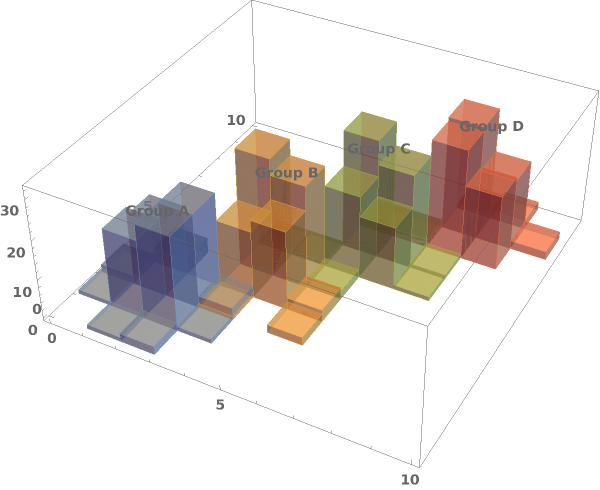
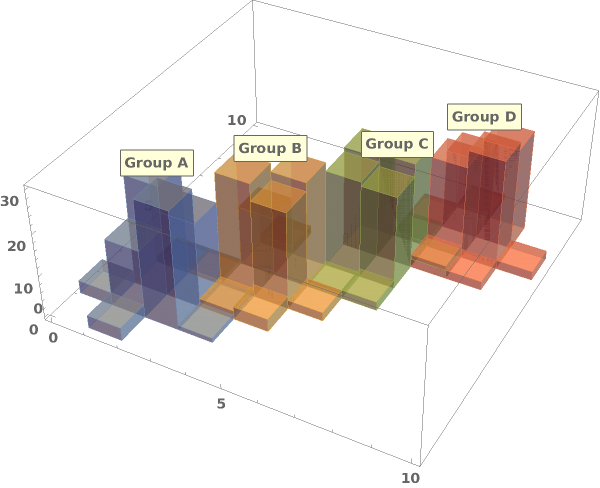
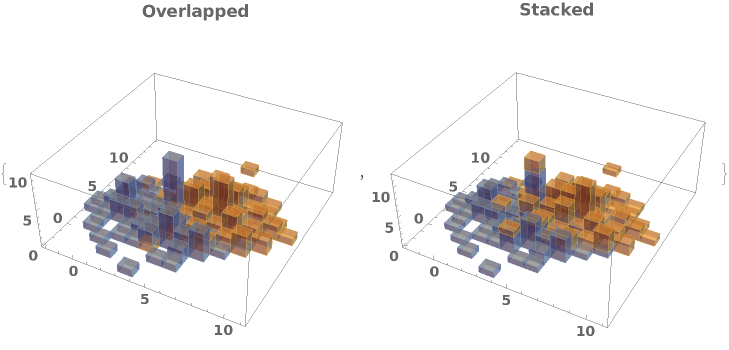
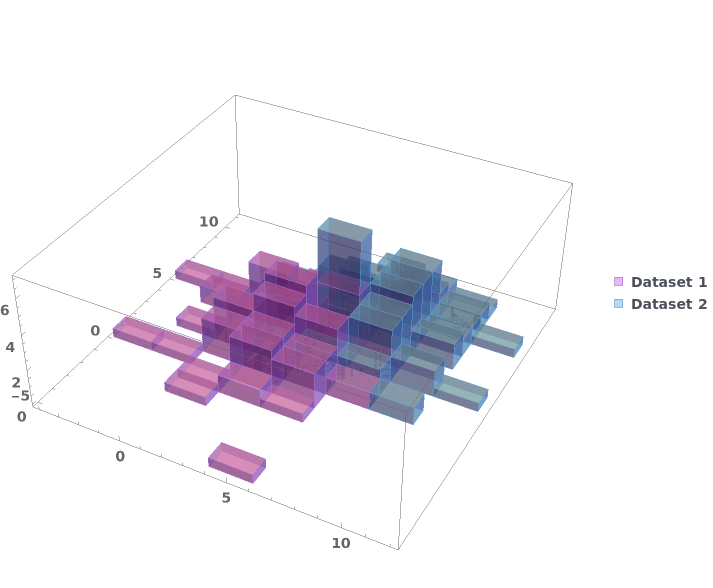
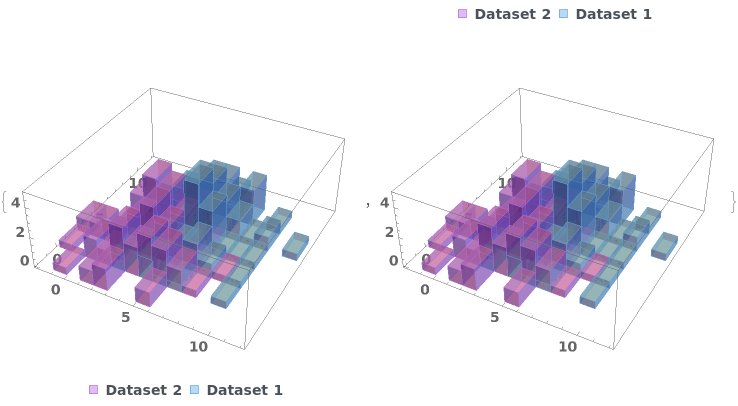
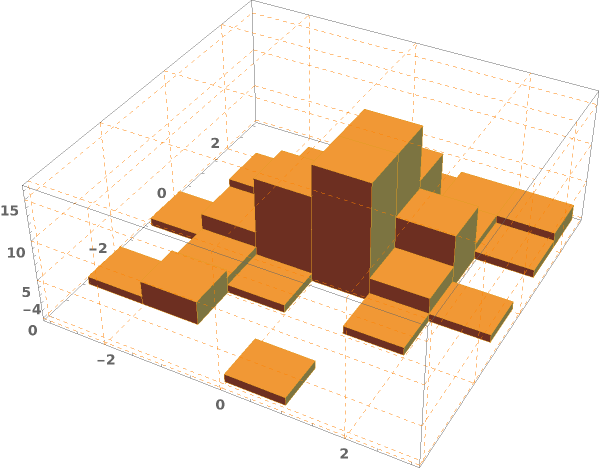
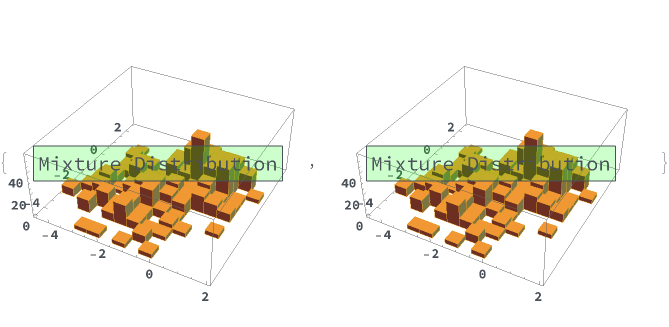
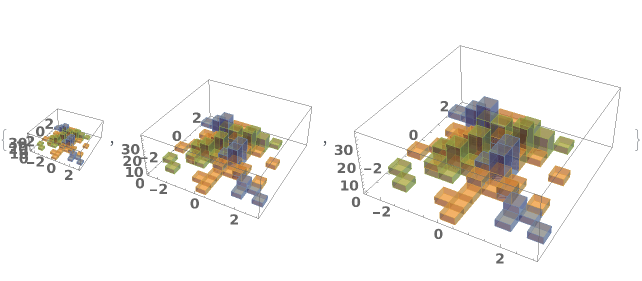
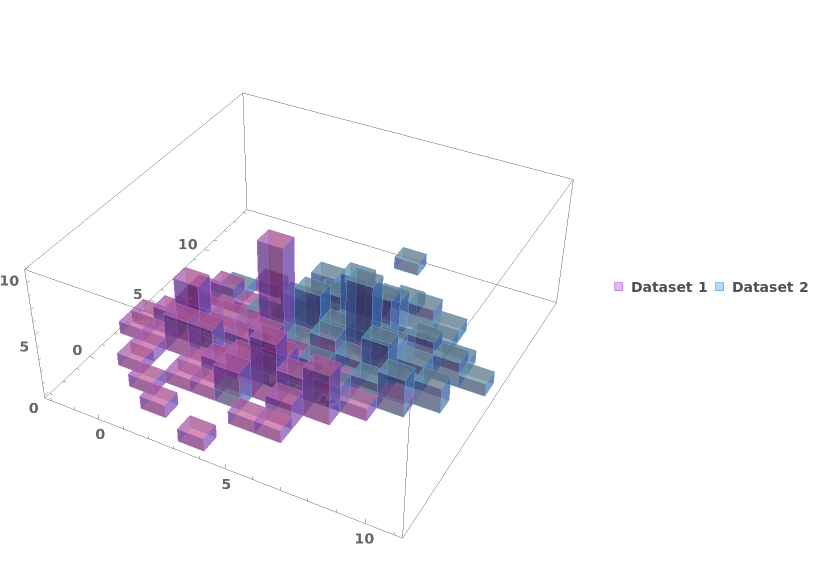
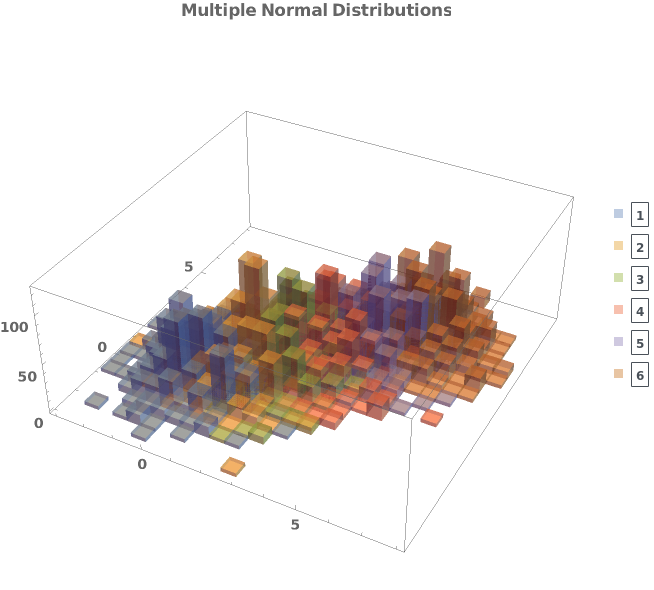
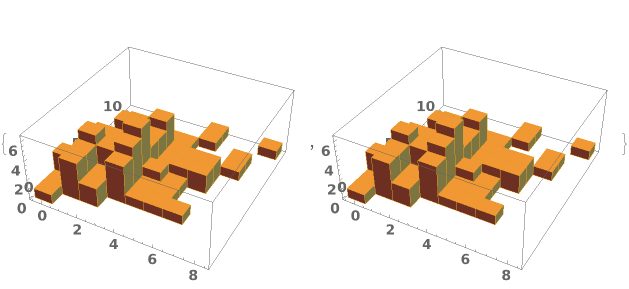
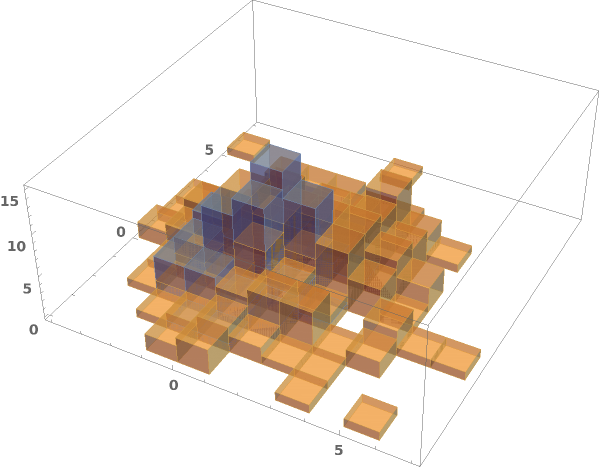
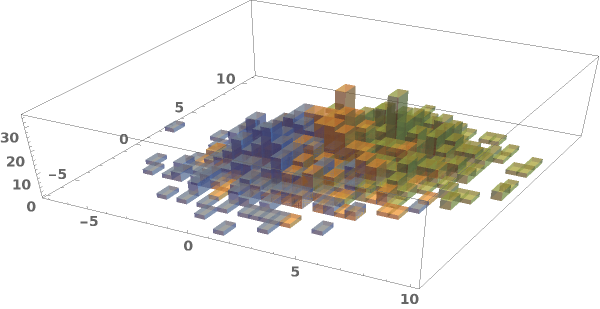
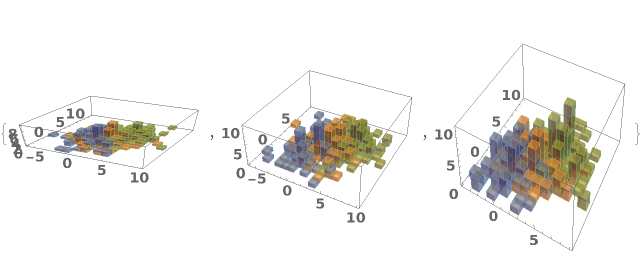
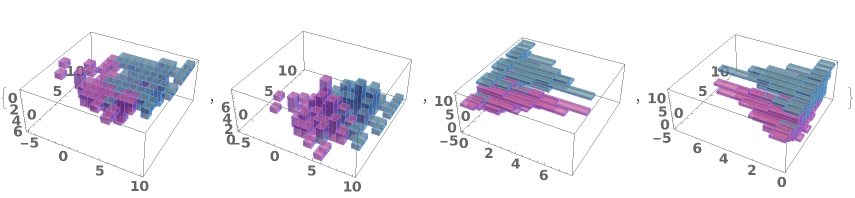
EmeraldHistogram3D[datasets]⟹chart
creates a Histogram3D displaying each input dataset in datasets.
Details
Input
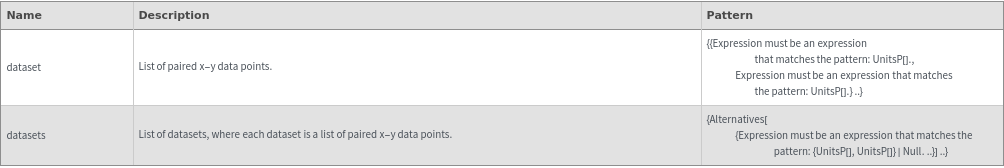
Output

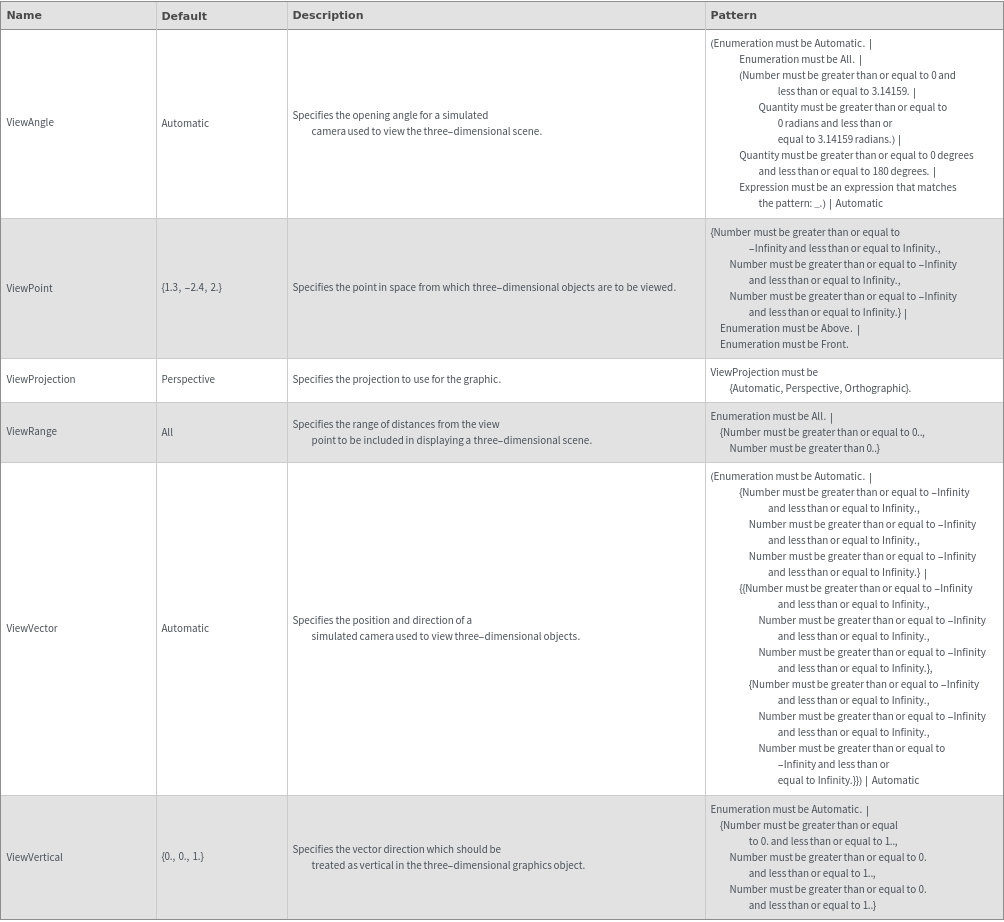
3D View Options
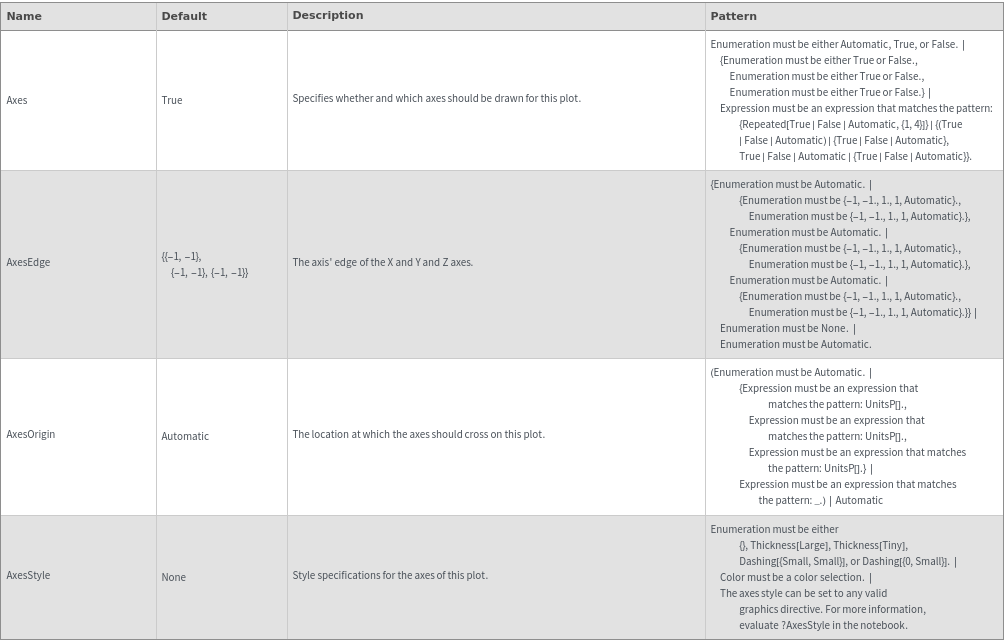
Axes Options
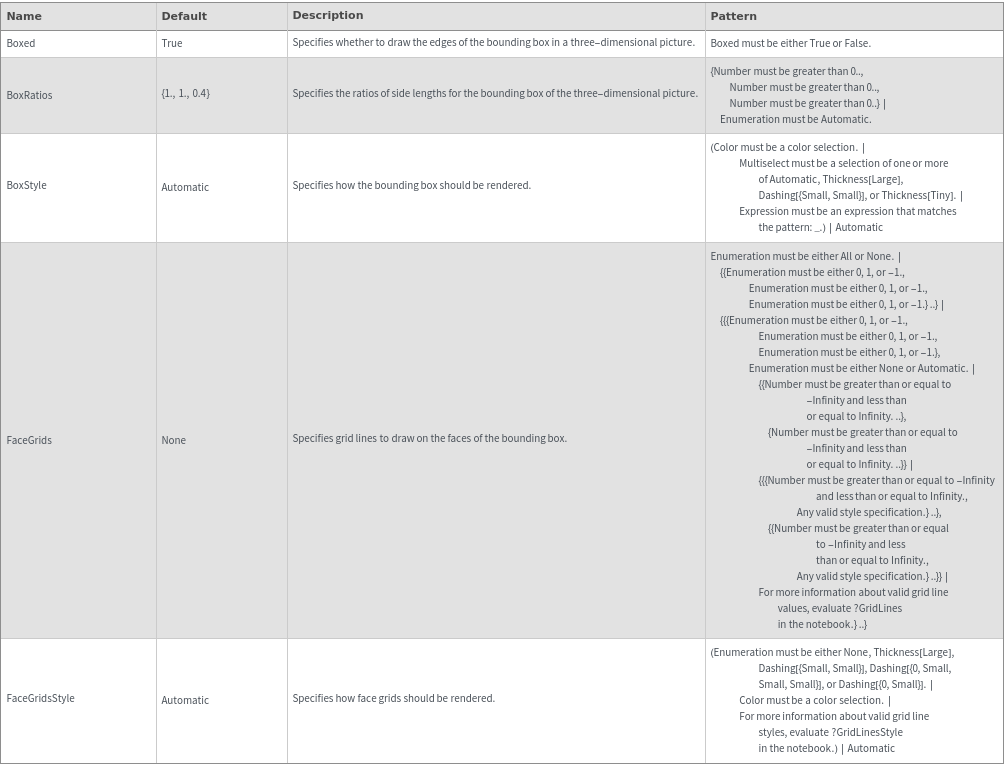
Box Options
Data Specifications Options
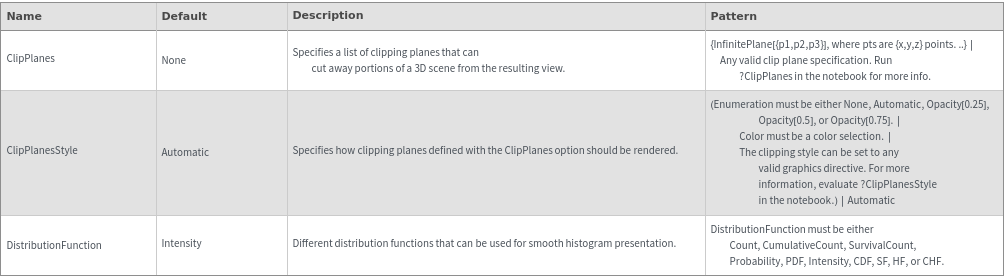
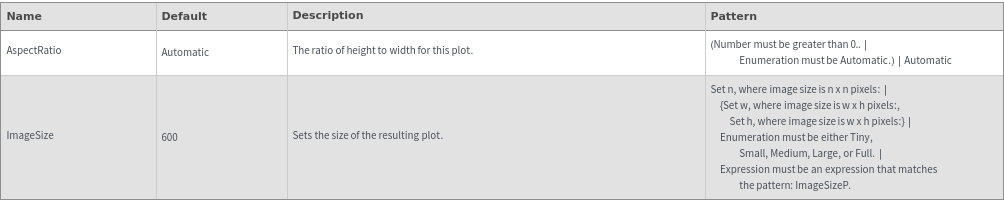
Image Format Options
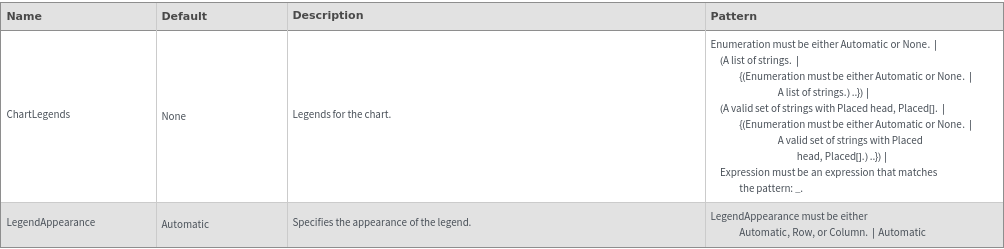
Legend Options
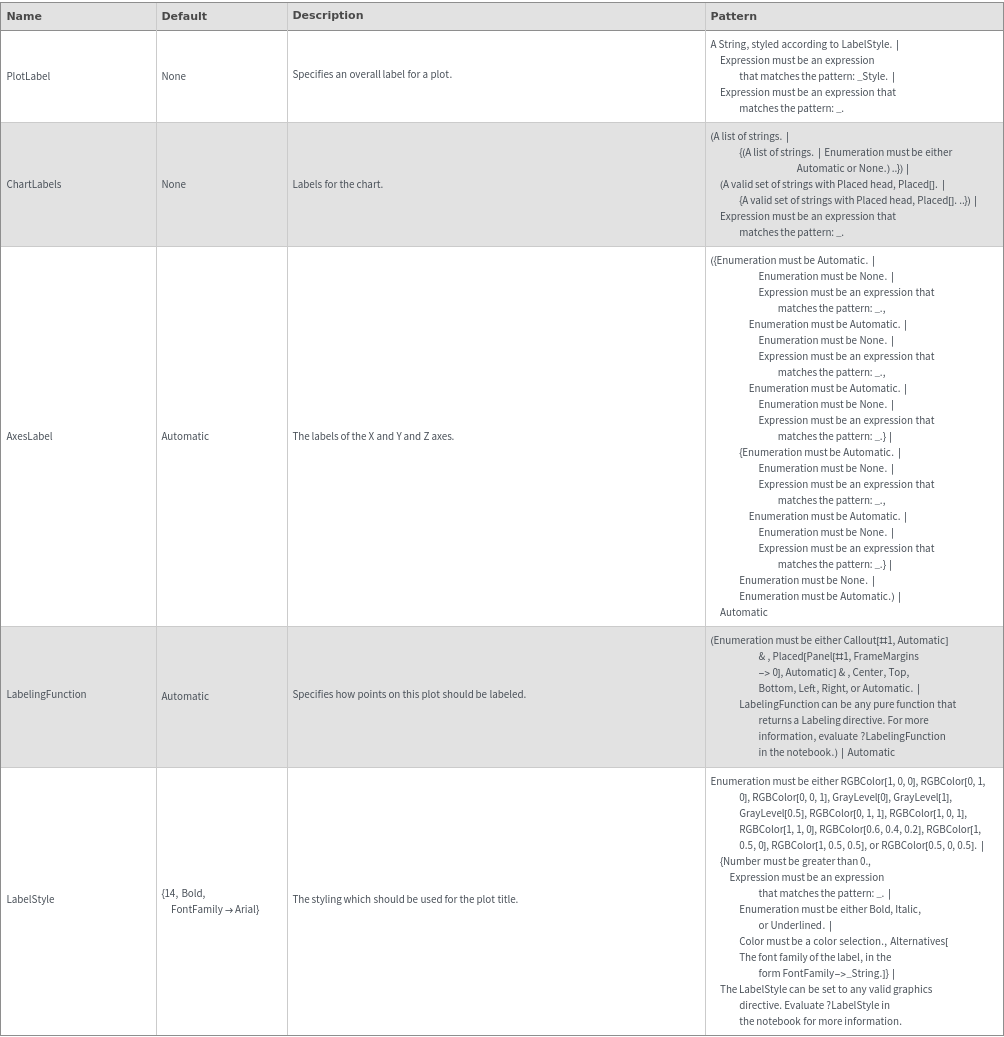
Plot Labeling Options
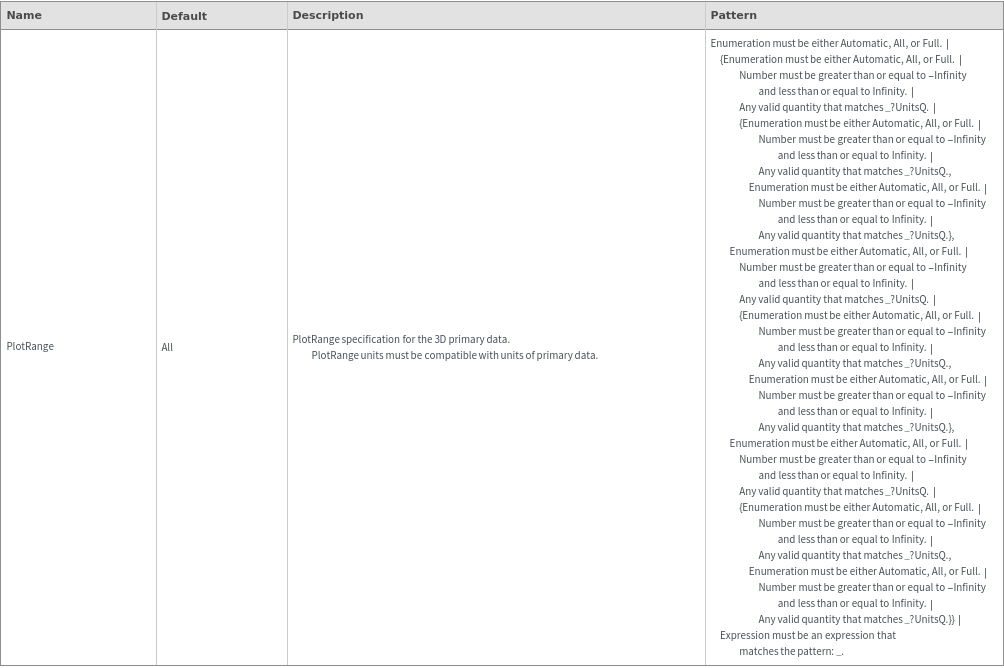
Plot Range Options
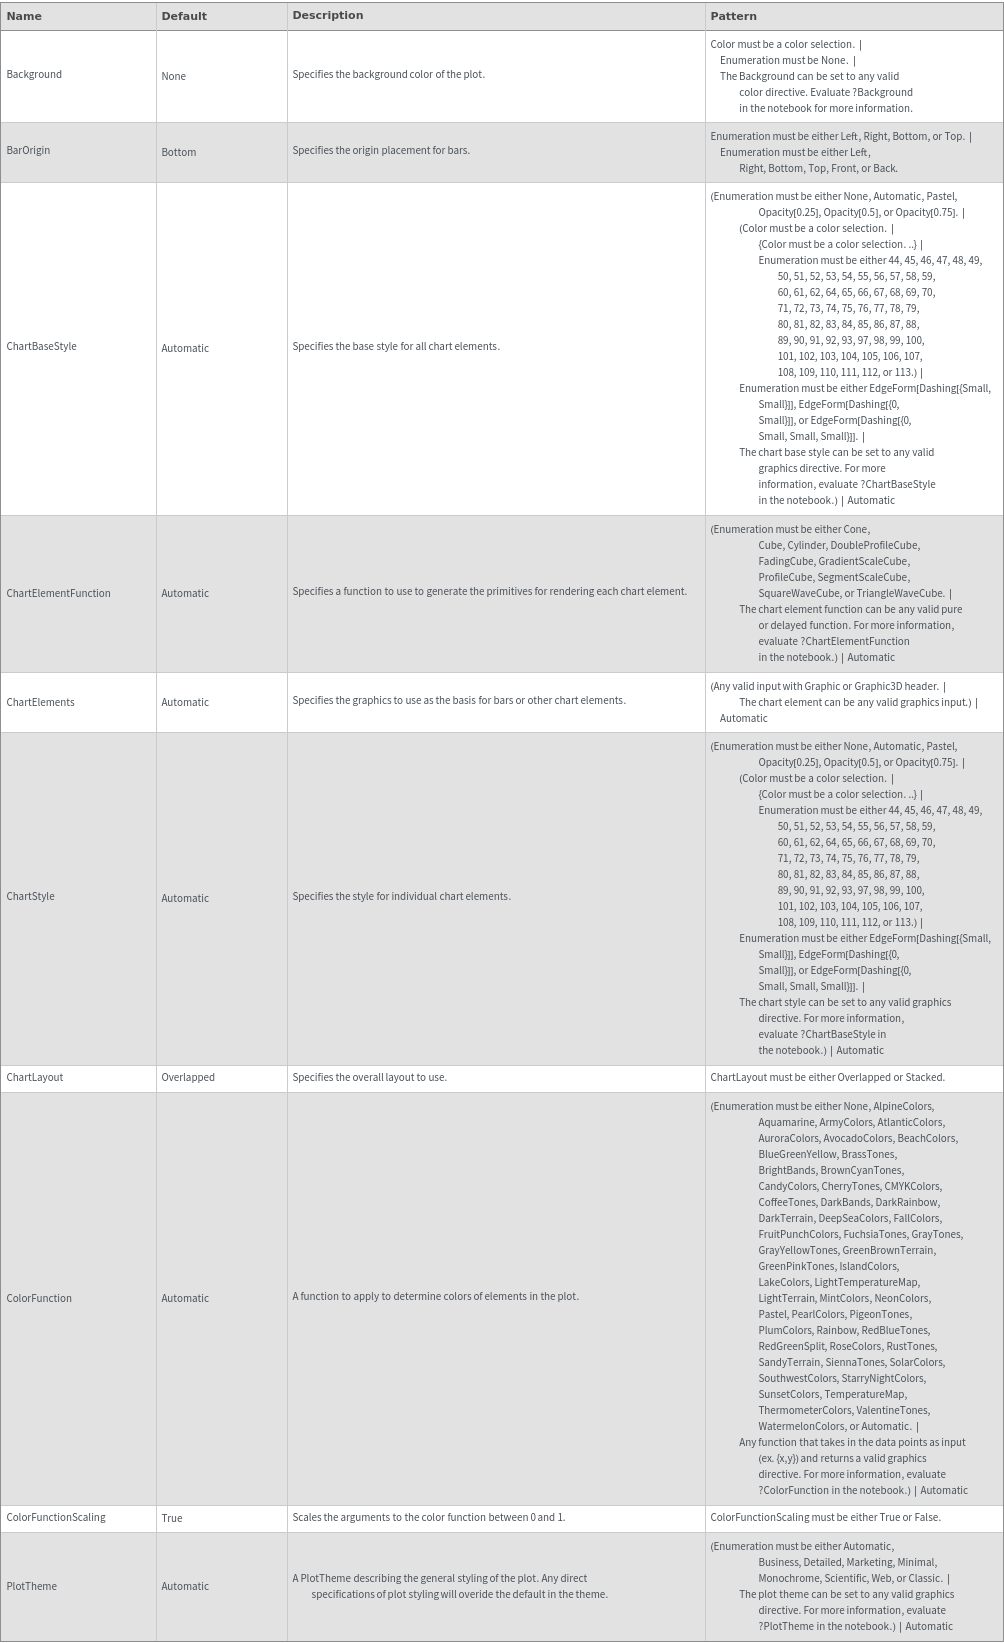
Plot Style Options
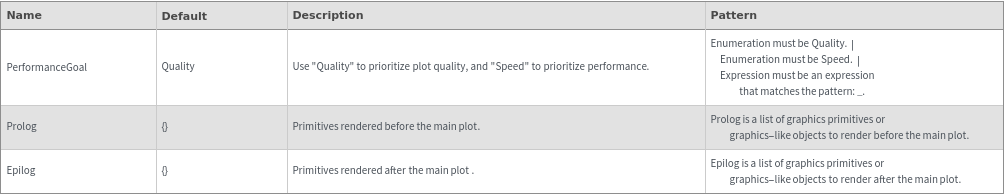
General Options
Examples
Basic Examples (3)


Options (70)
AlignmentPoint (1)


AxesEdge (1)


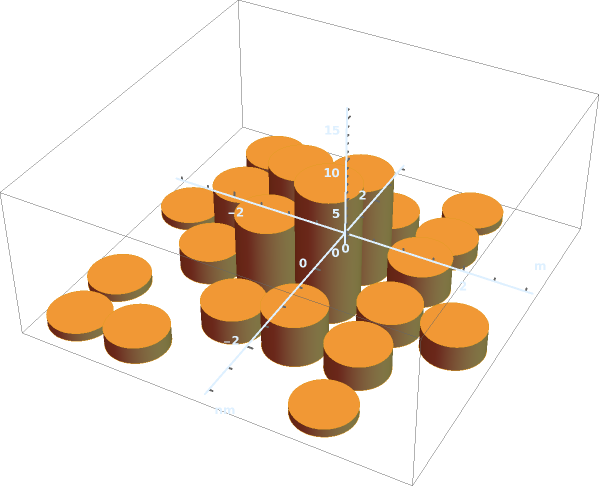

AxesUnits (2)


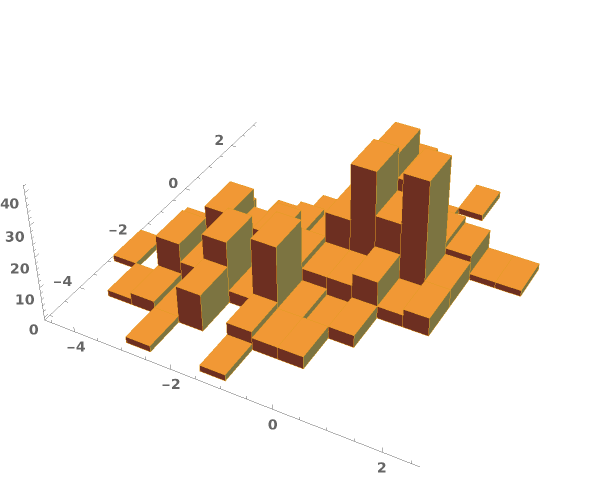


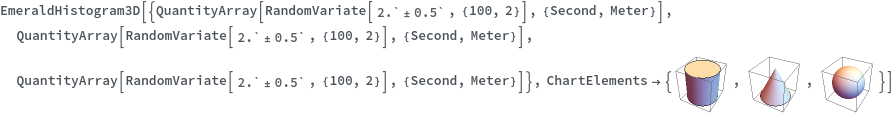
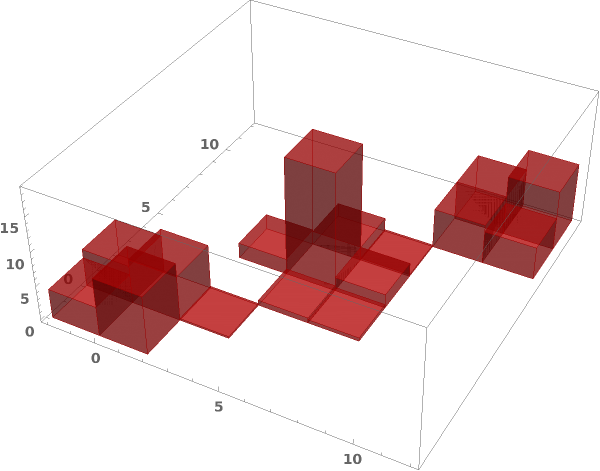
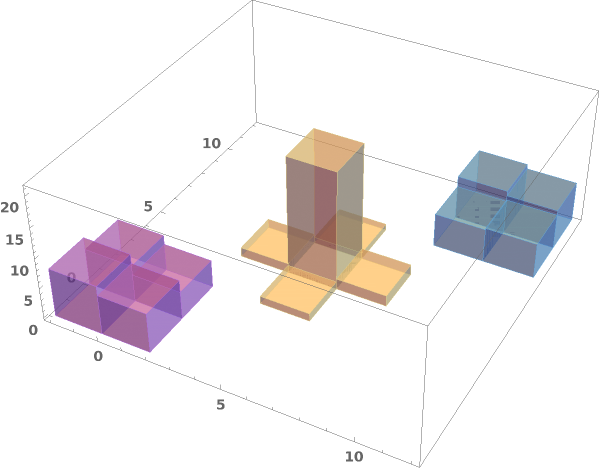
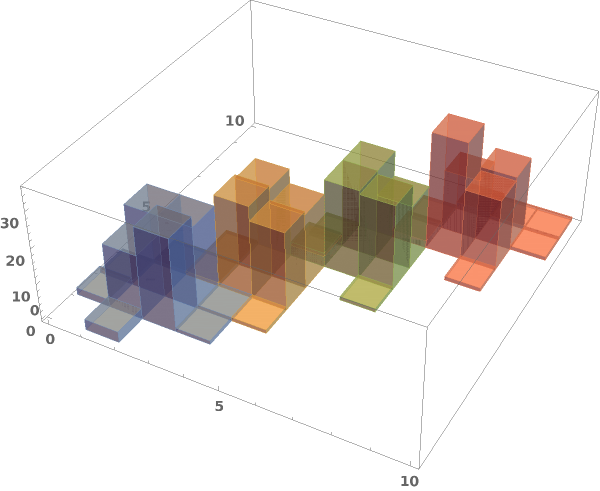
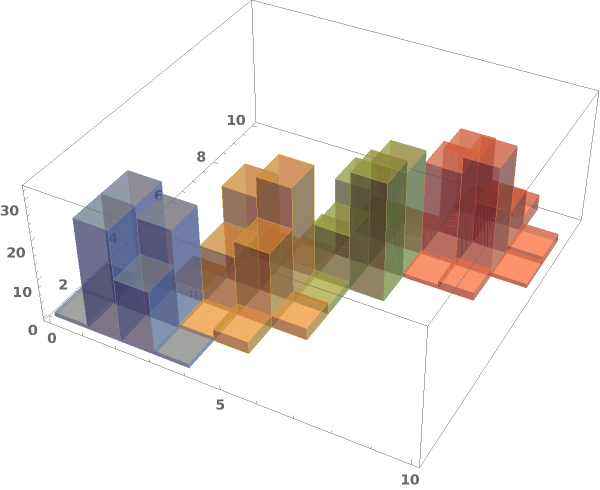
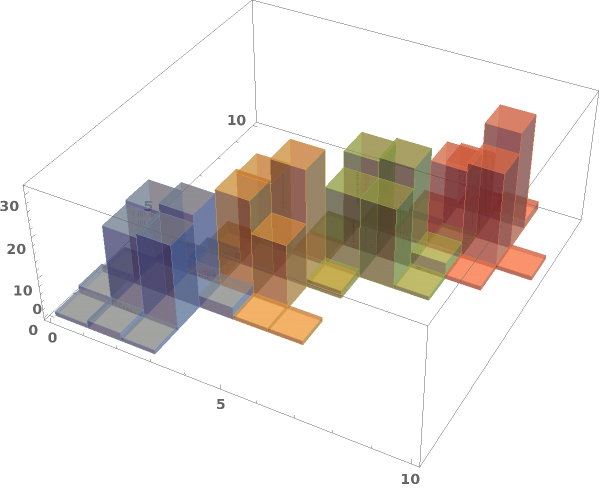
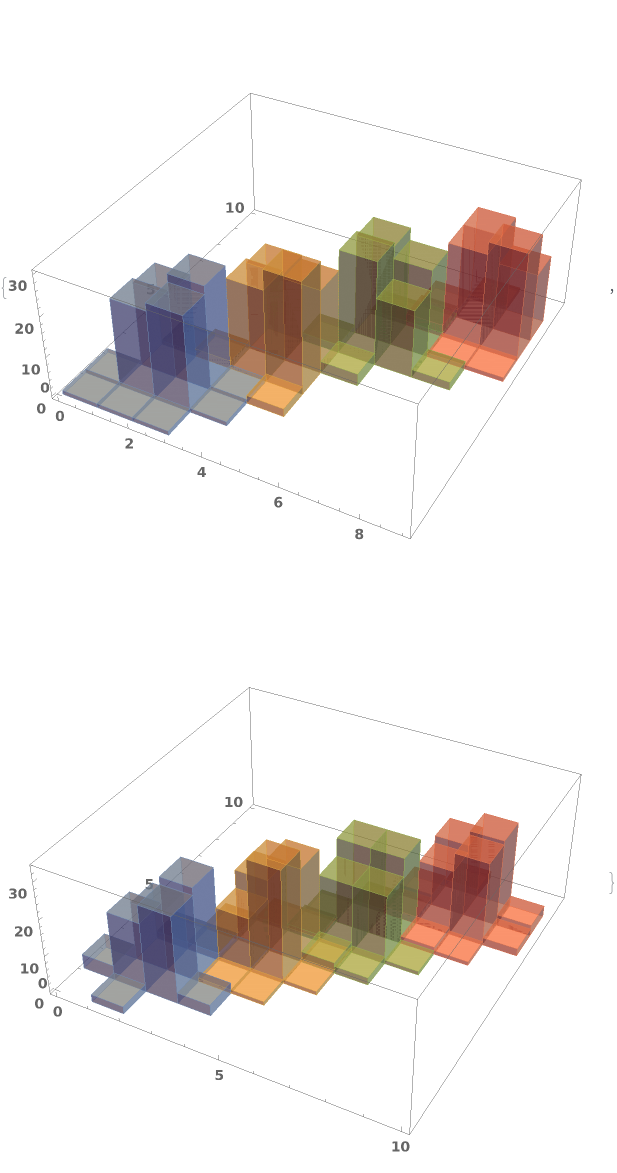
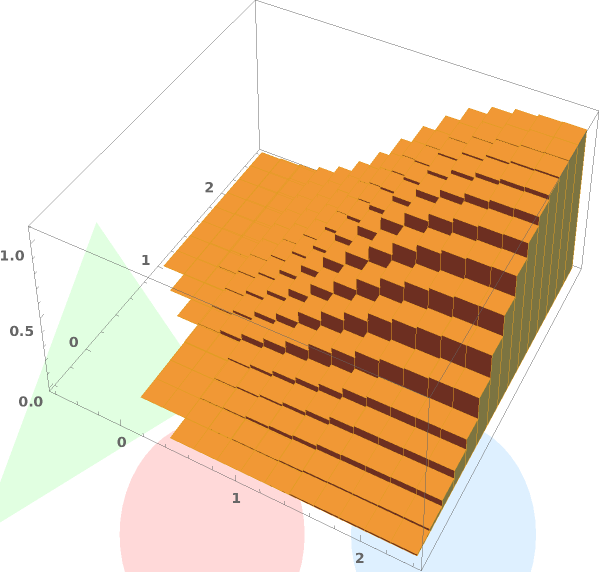
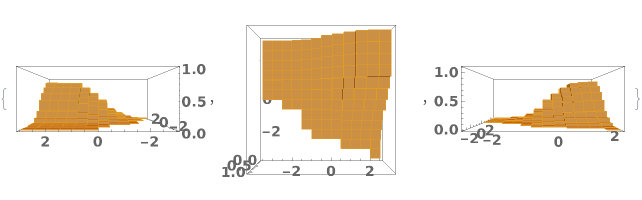
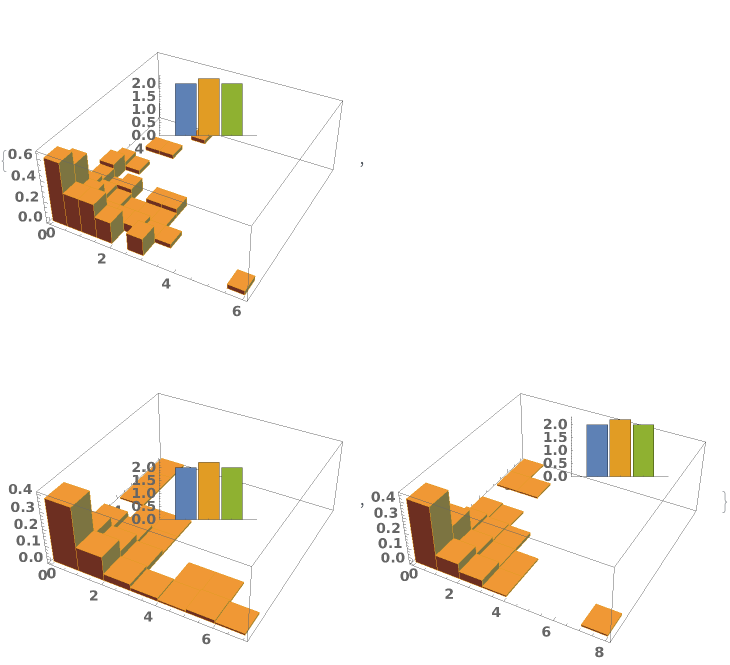
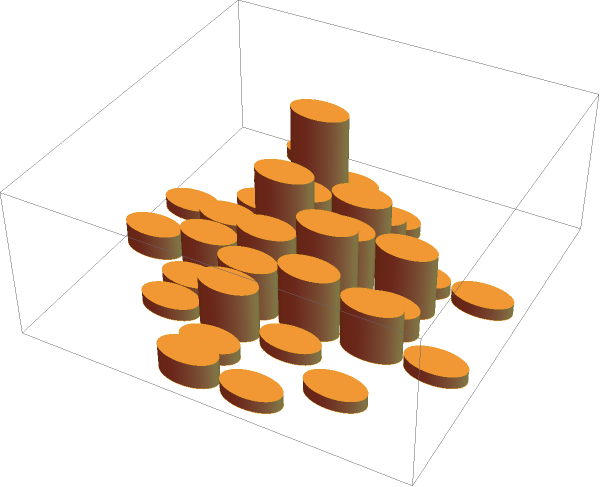
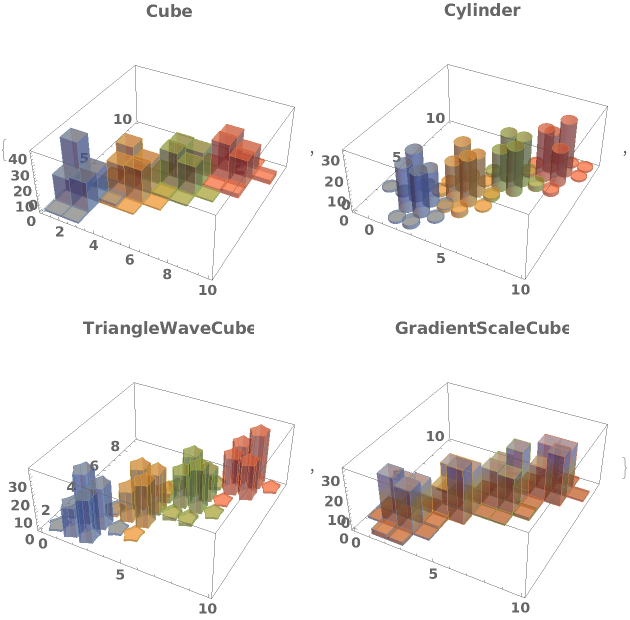
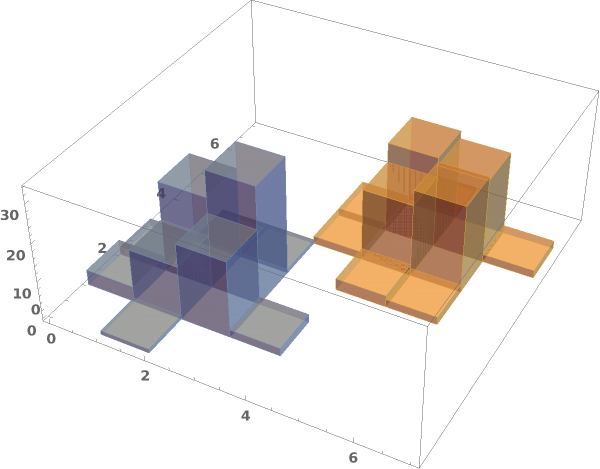
ChartElementFunction (4)
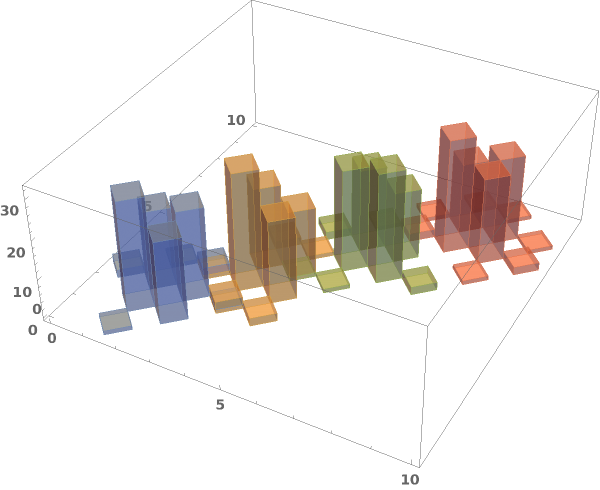
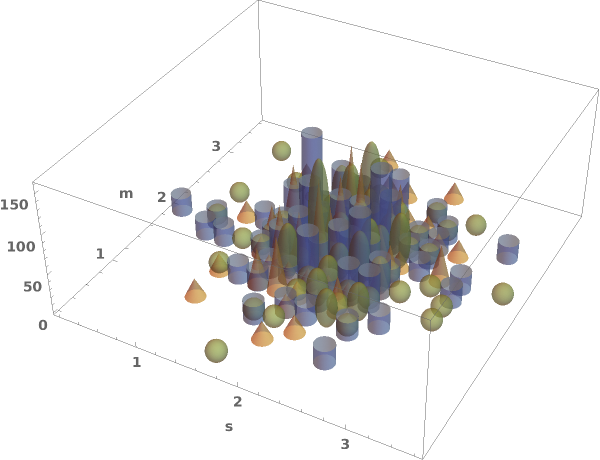
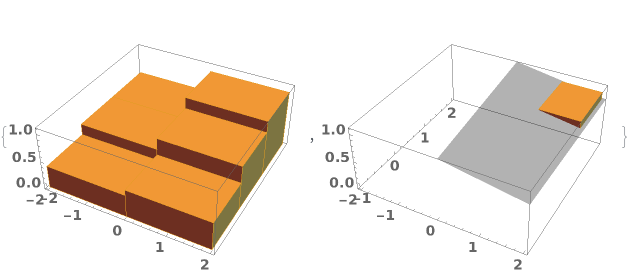
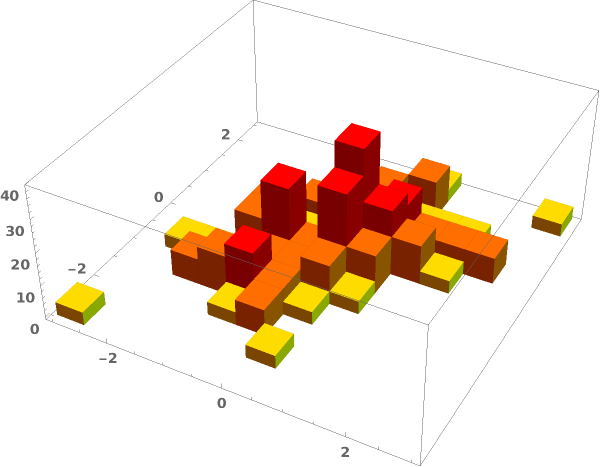
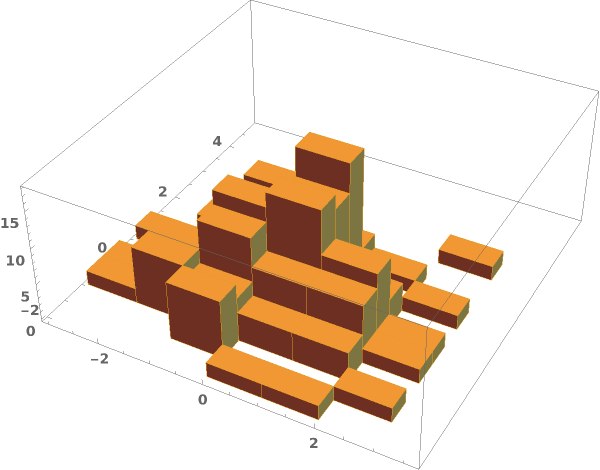
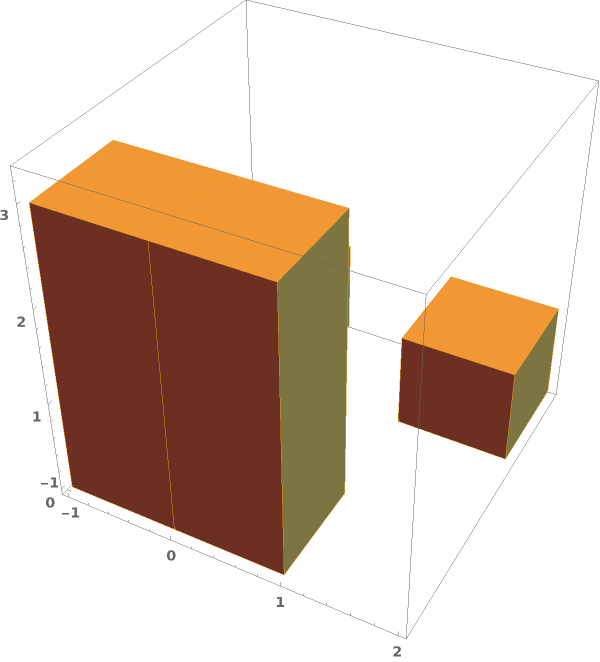
Choose a chart element function from a list of presets, which can be viewed by running ChartElementData["Histogram"] in the notebook. Automatic defaults to "Cube":

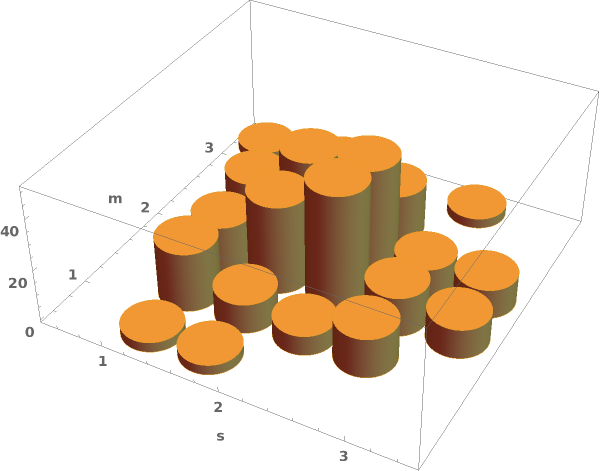
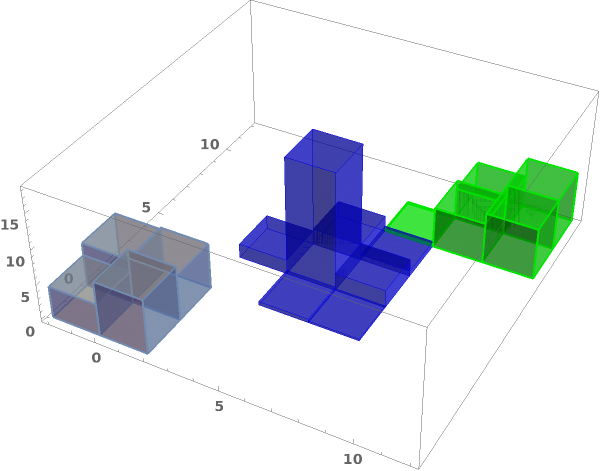
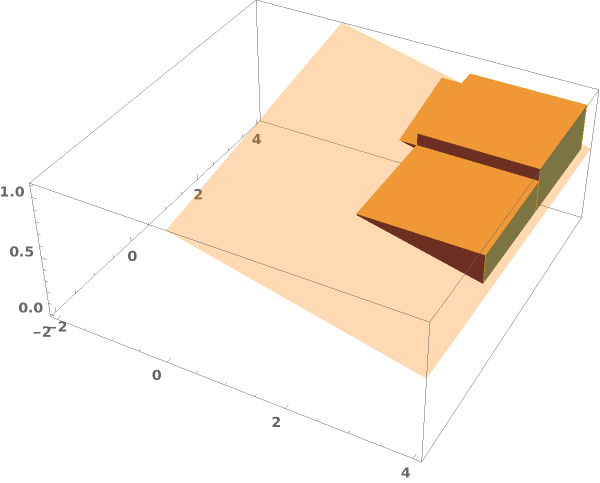
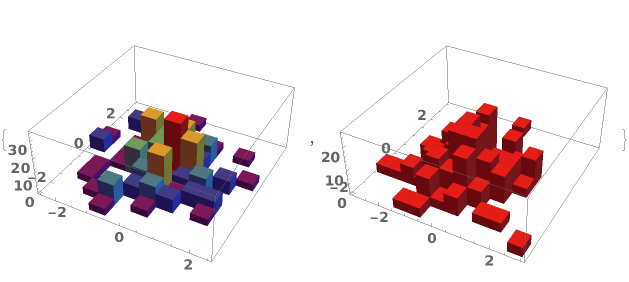
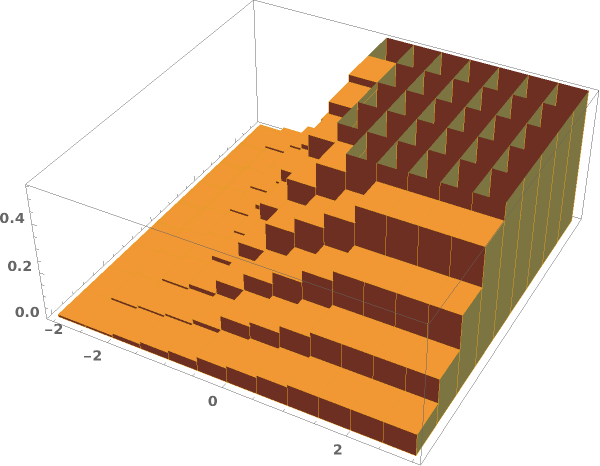
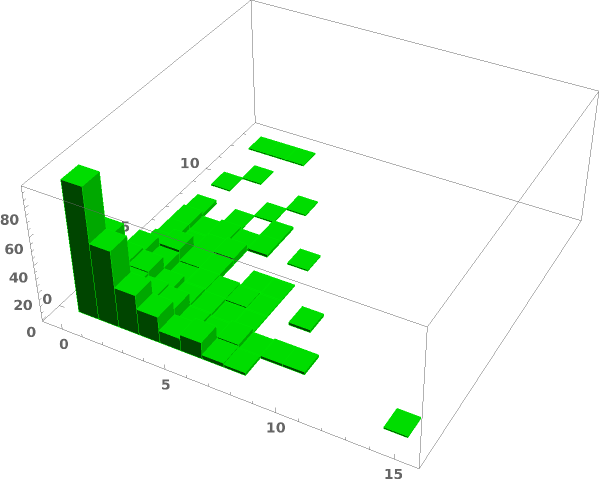
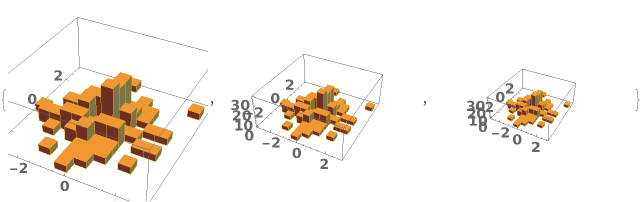
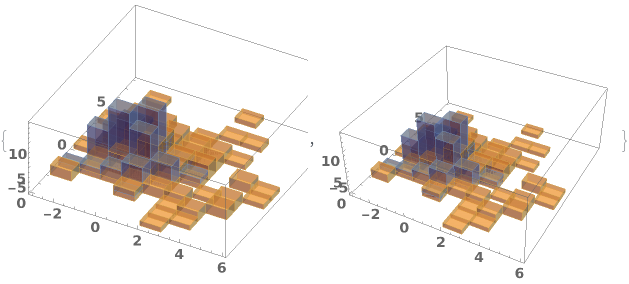
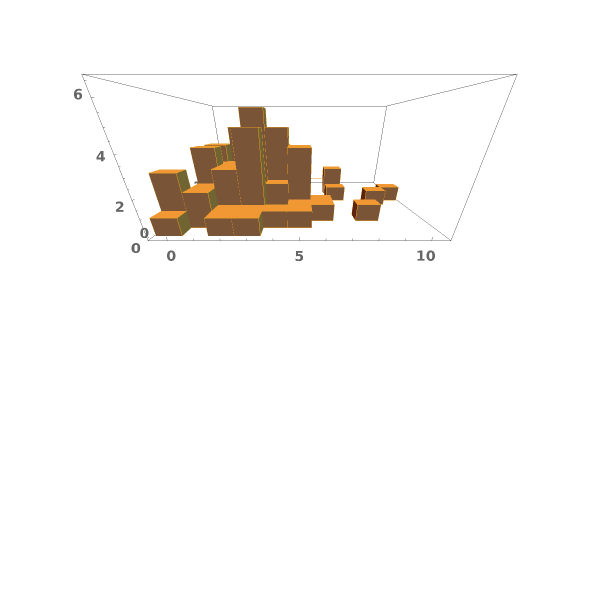
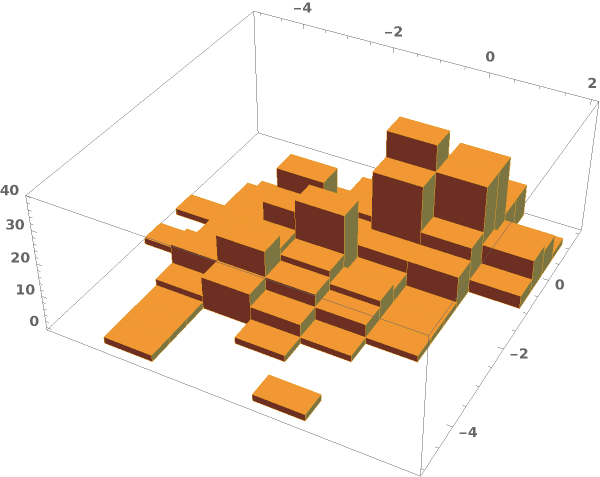
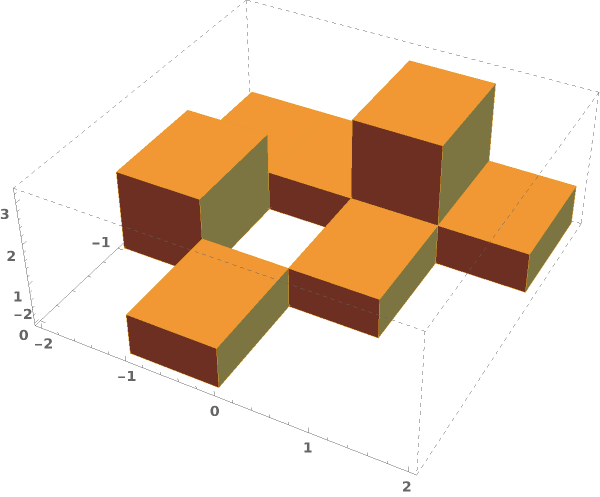
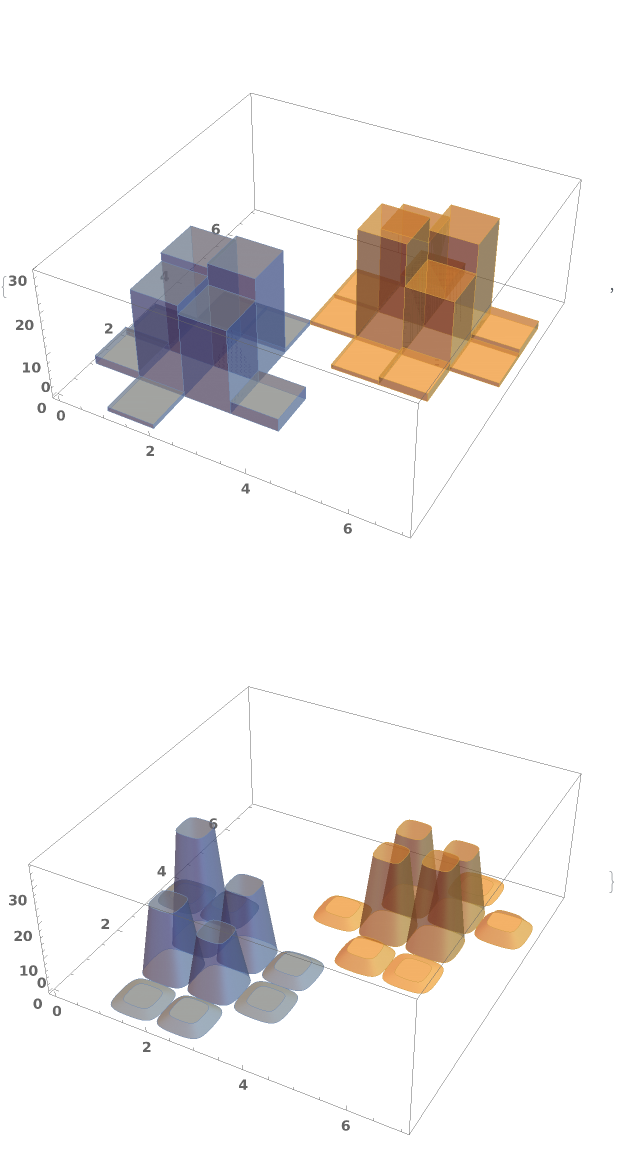
Write a custom ChartElementFunction:

Write a custom ChartElementFunction:

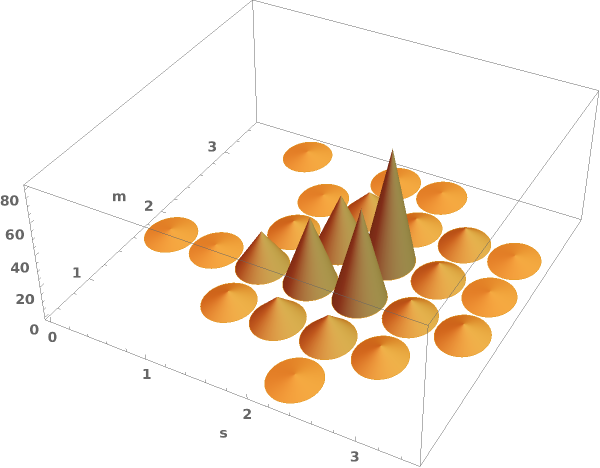
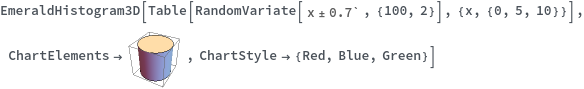
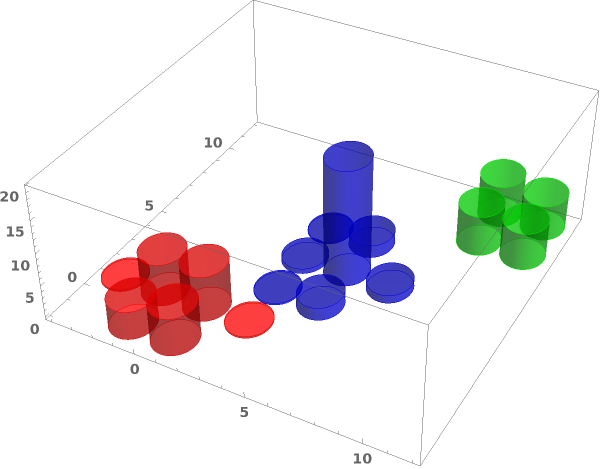
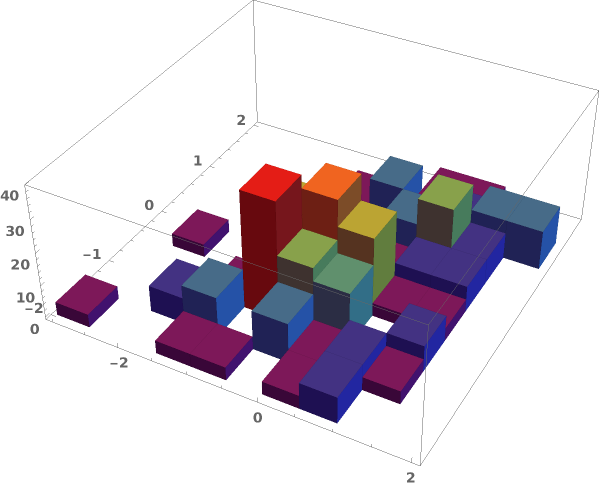
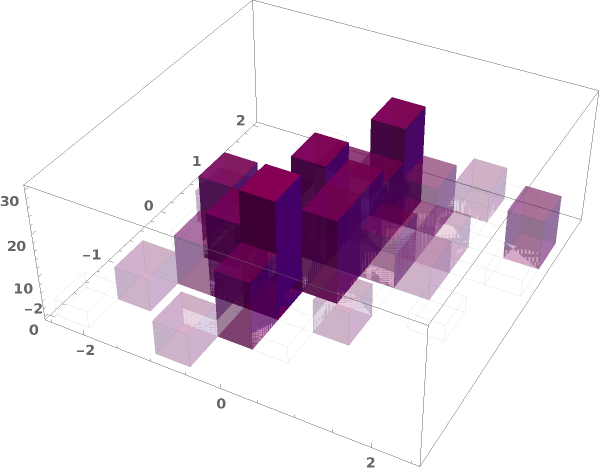
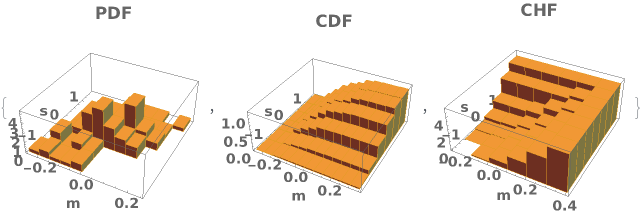
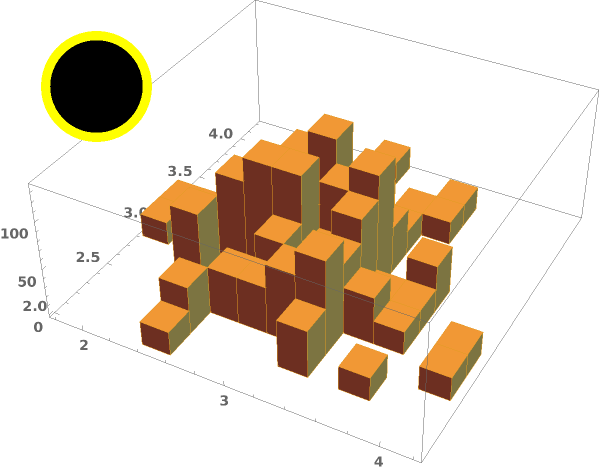
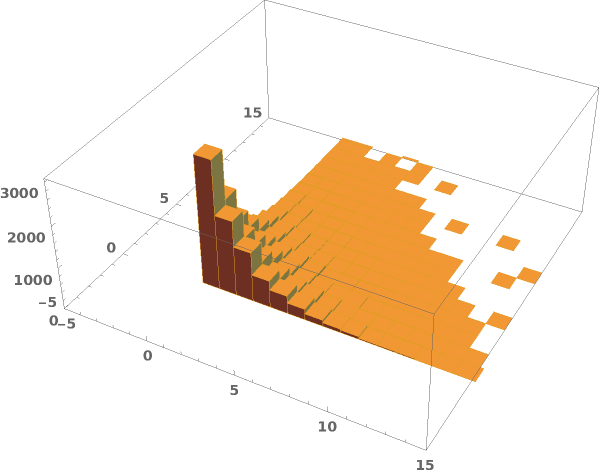
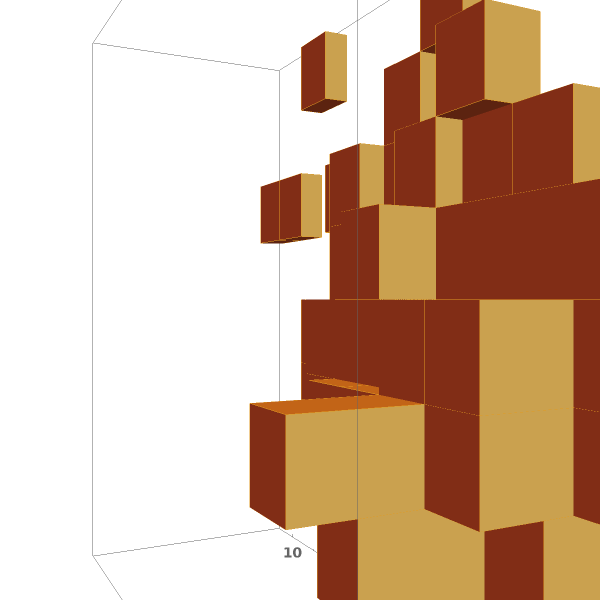
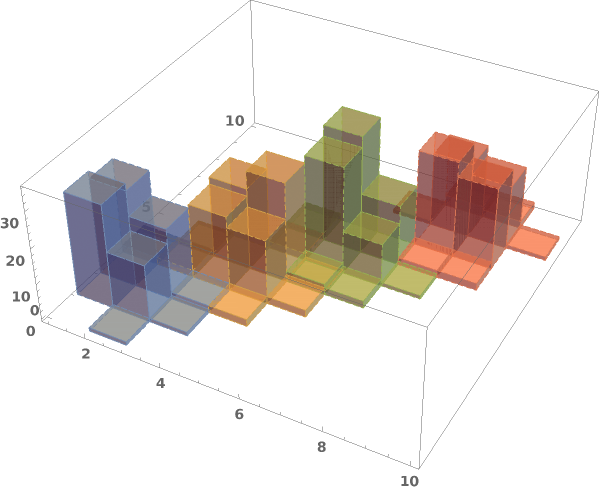
Some built-in chart element functions take options. As an example, you can view the options for the default Rectangle function by running ChartElementData["Histogram3D"] in the notebook: