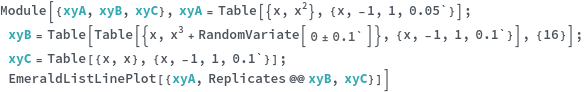
EmeraldListLinePlot
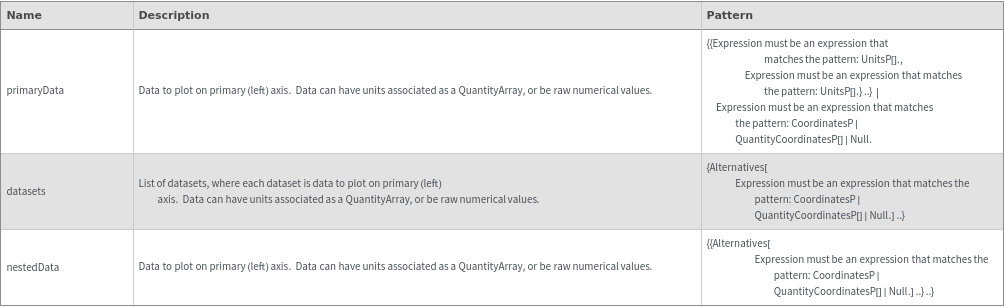
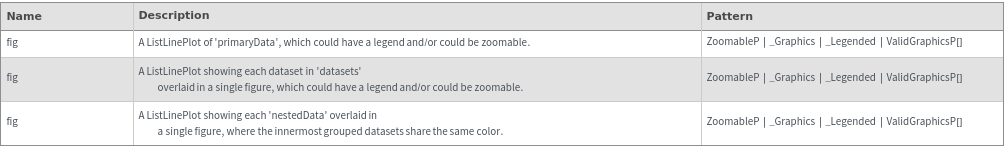
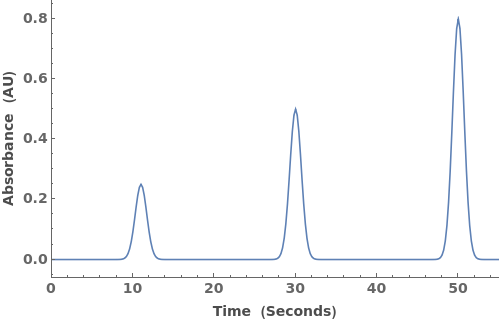
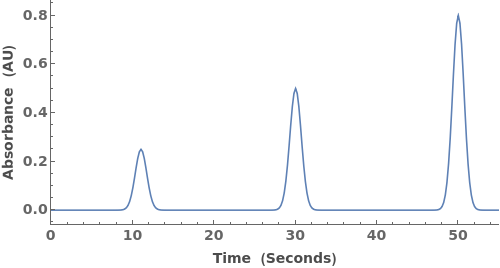
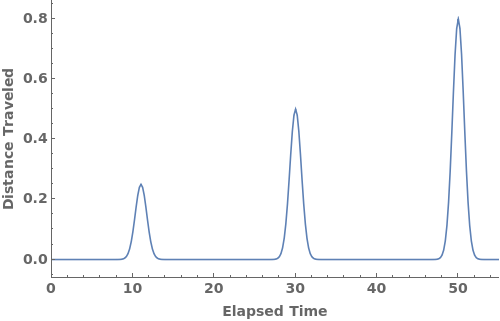
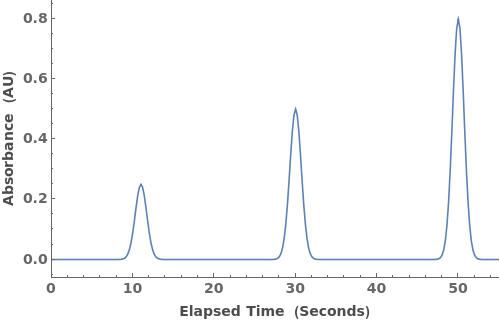
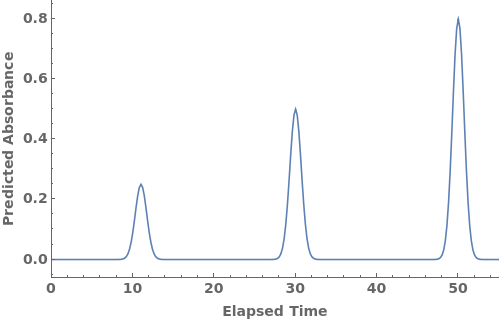
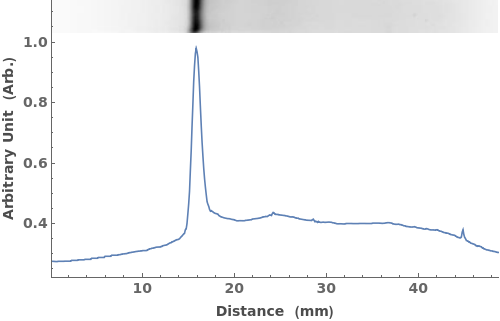
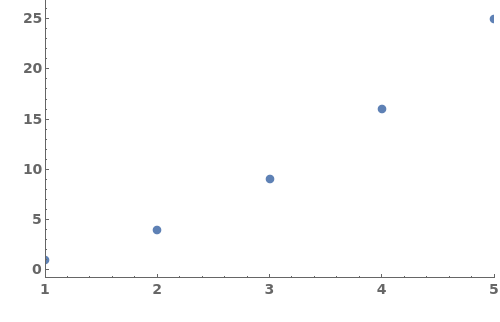
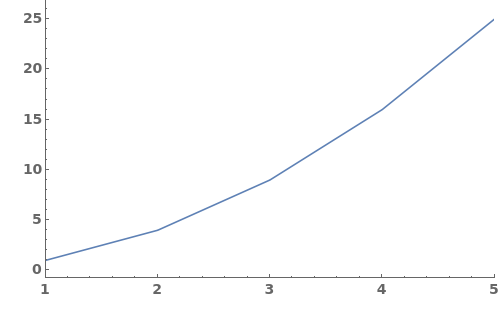
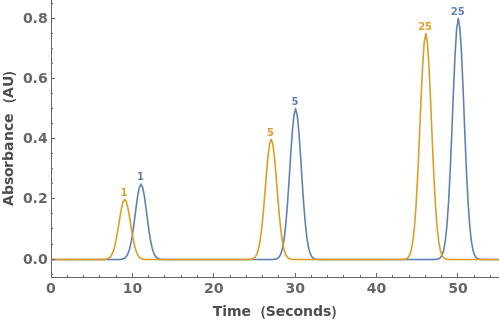
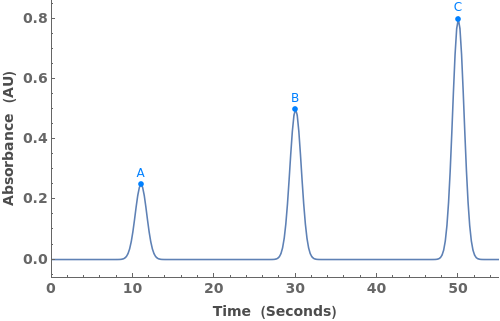
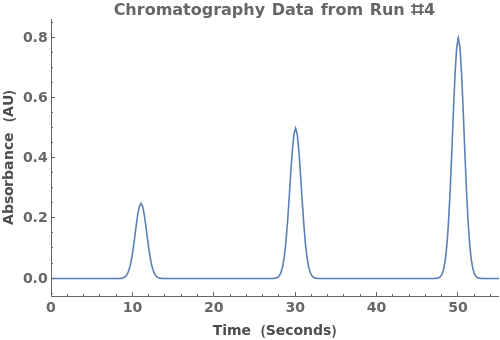
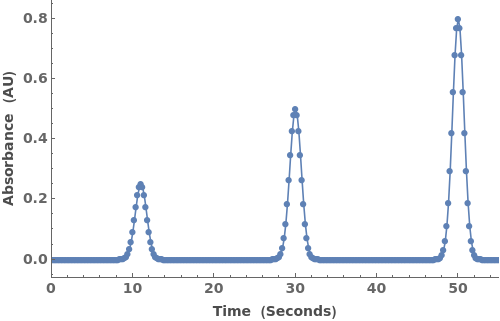
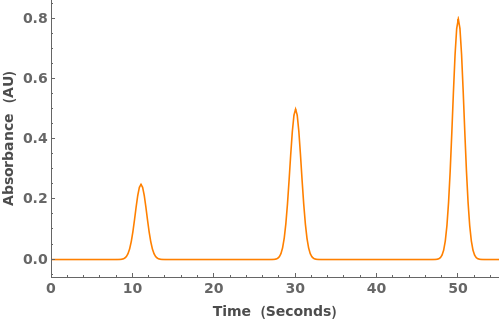
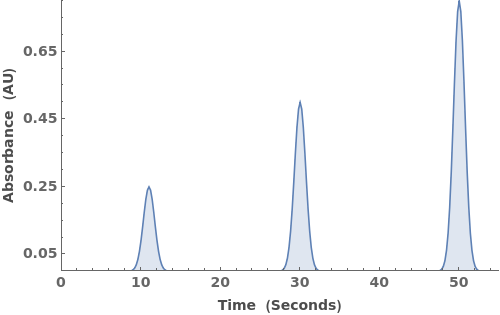
EmeraldListLinePlot[primaryData]⟹fig
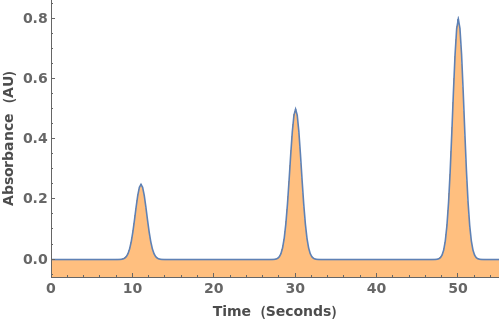
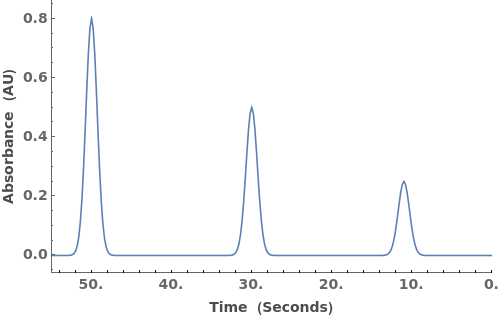
creates a ListLinePlot of primaryData.
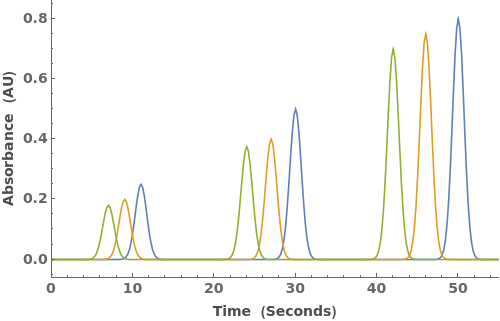
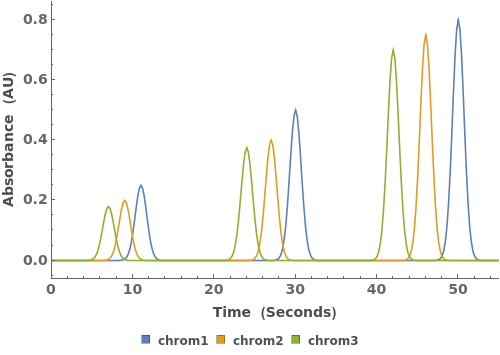
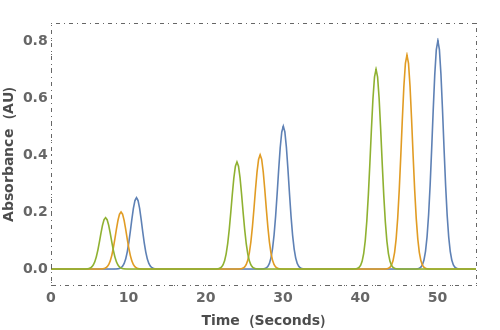
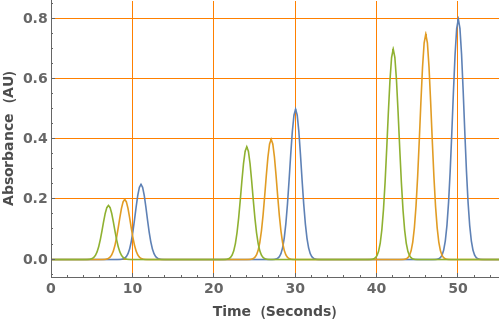
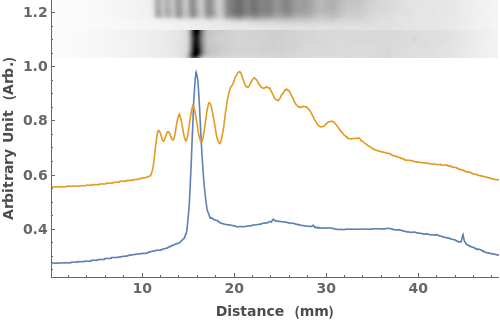
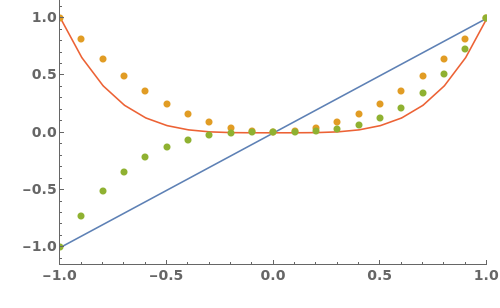
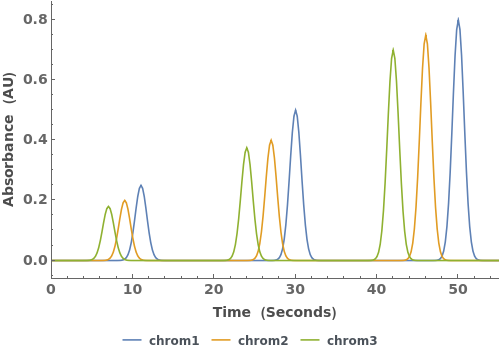
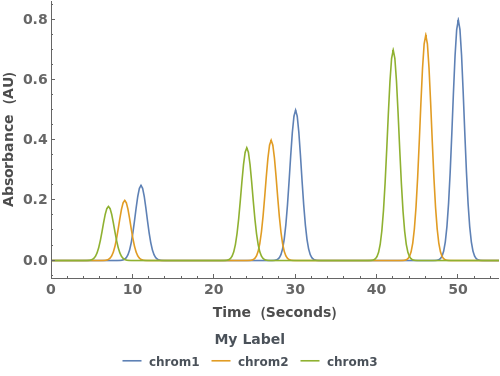
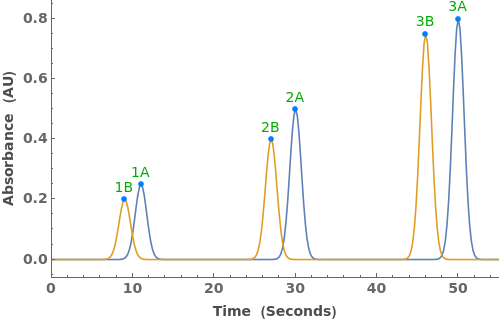
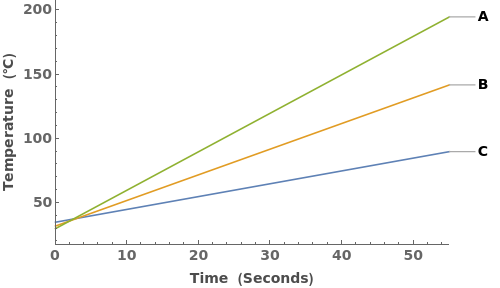
EmeraldListLinePlot[datasets]⟹fig
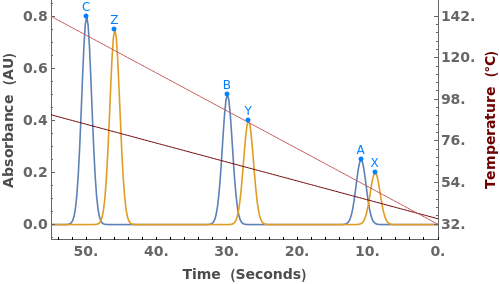
overlays each dataset in datasets onto a single figure.
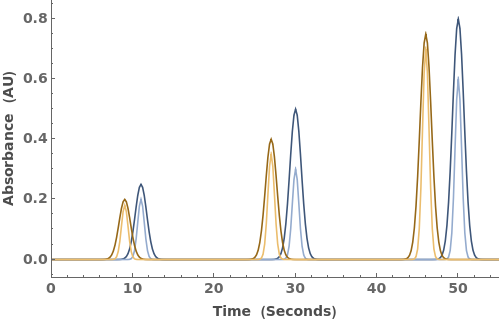
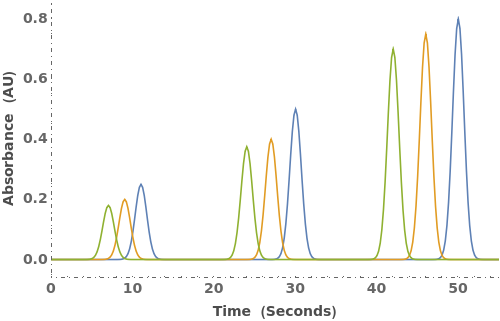
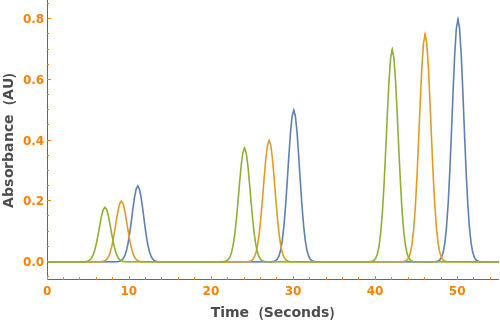
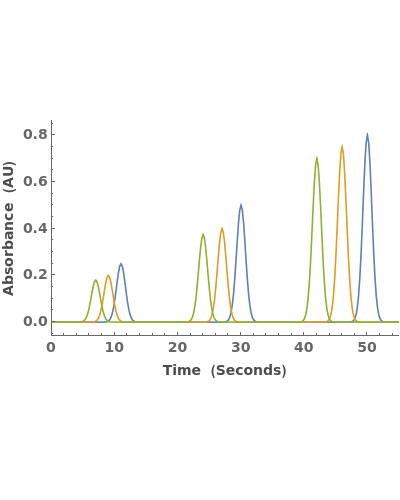
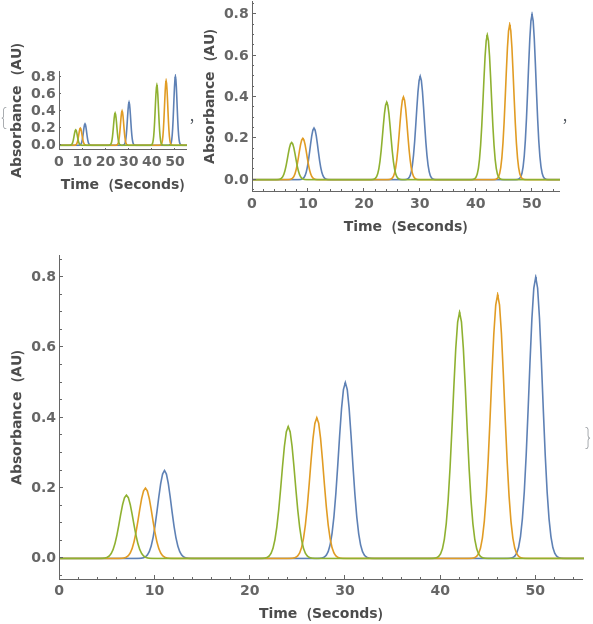
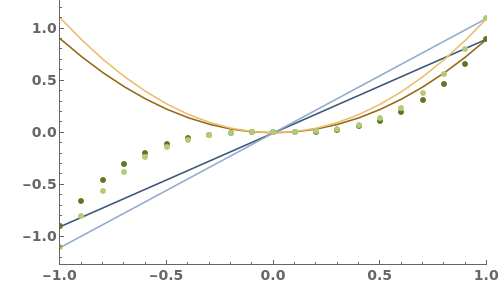
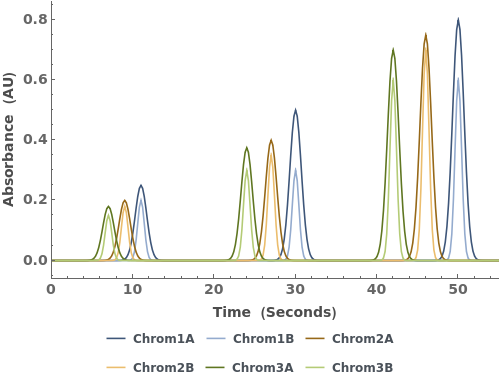
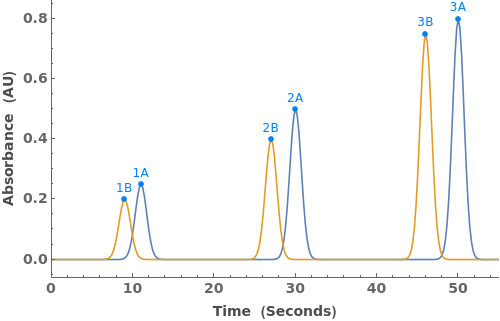
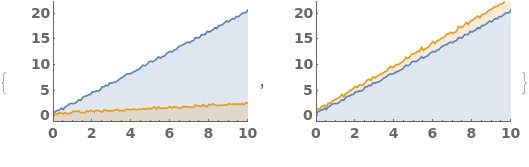
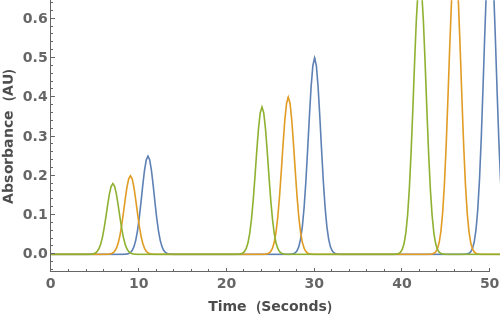
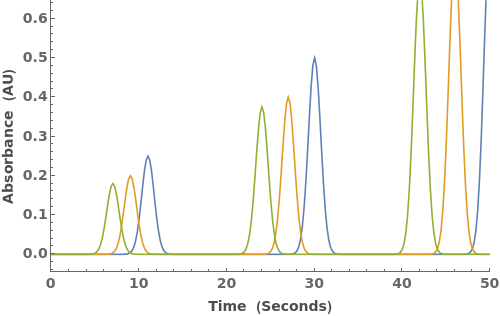
EmeraldListLinePlot[{{nestedData..}..}]⟹fig
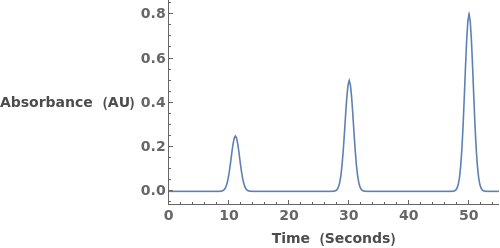
overlays all primaryData onto one figure, while associating the innermost data sets to one another through color.
Details
-
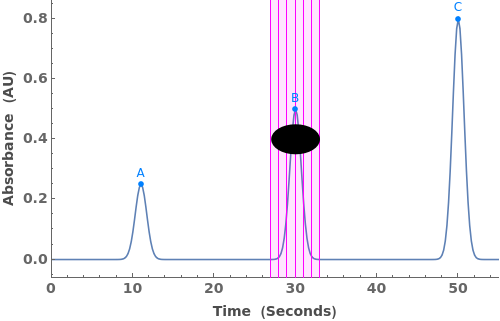
BadPeaks Peaks option format not recognized. Peak epilogs could not be created. PeakLabels The peak label specifications could not be associated with the peaks. For each set of peaks, please provide a list of the strings you would like to use to label the peaks.
Input
Output
Data Specifications Options
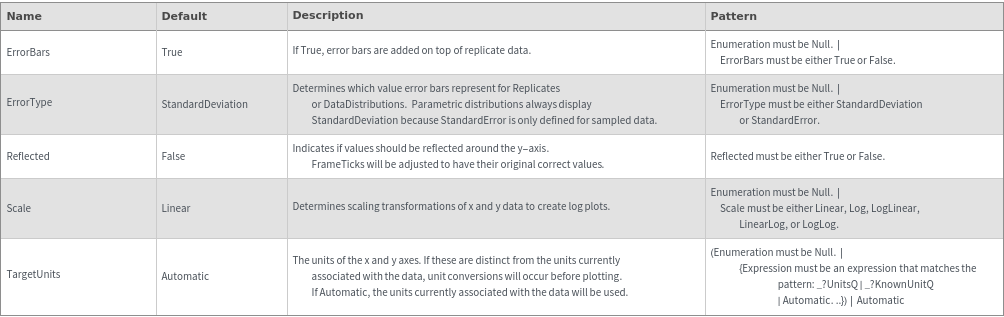
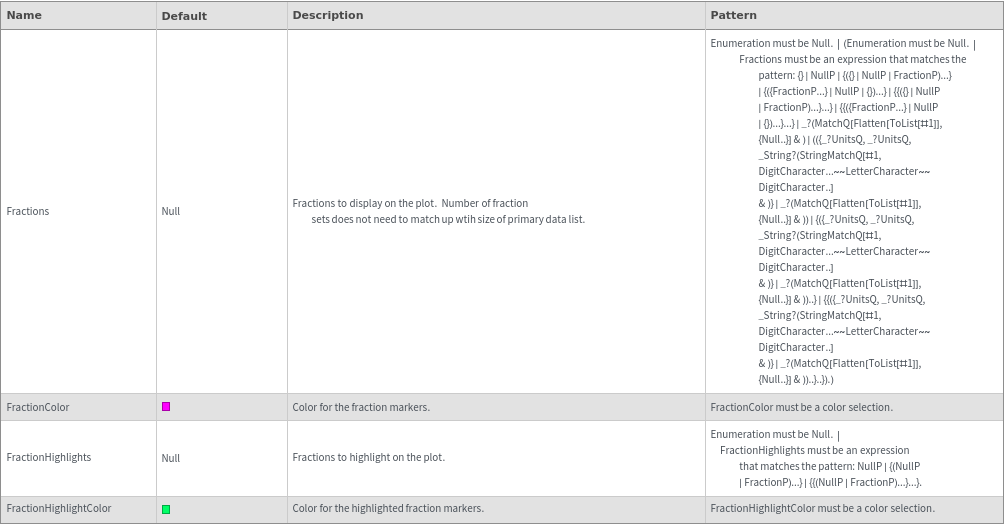
Fractions Options
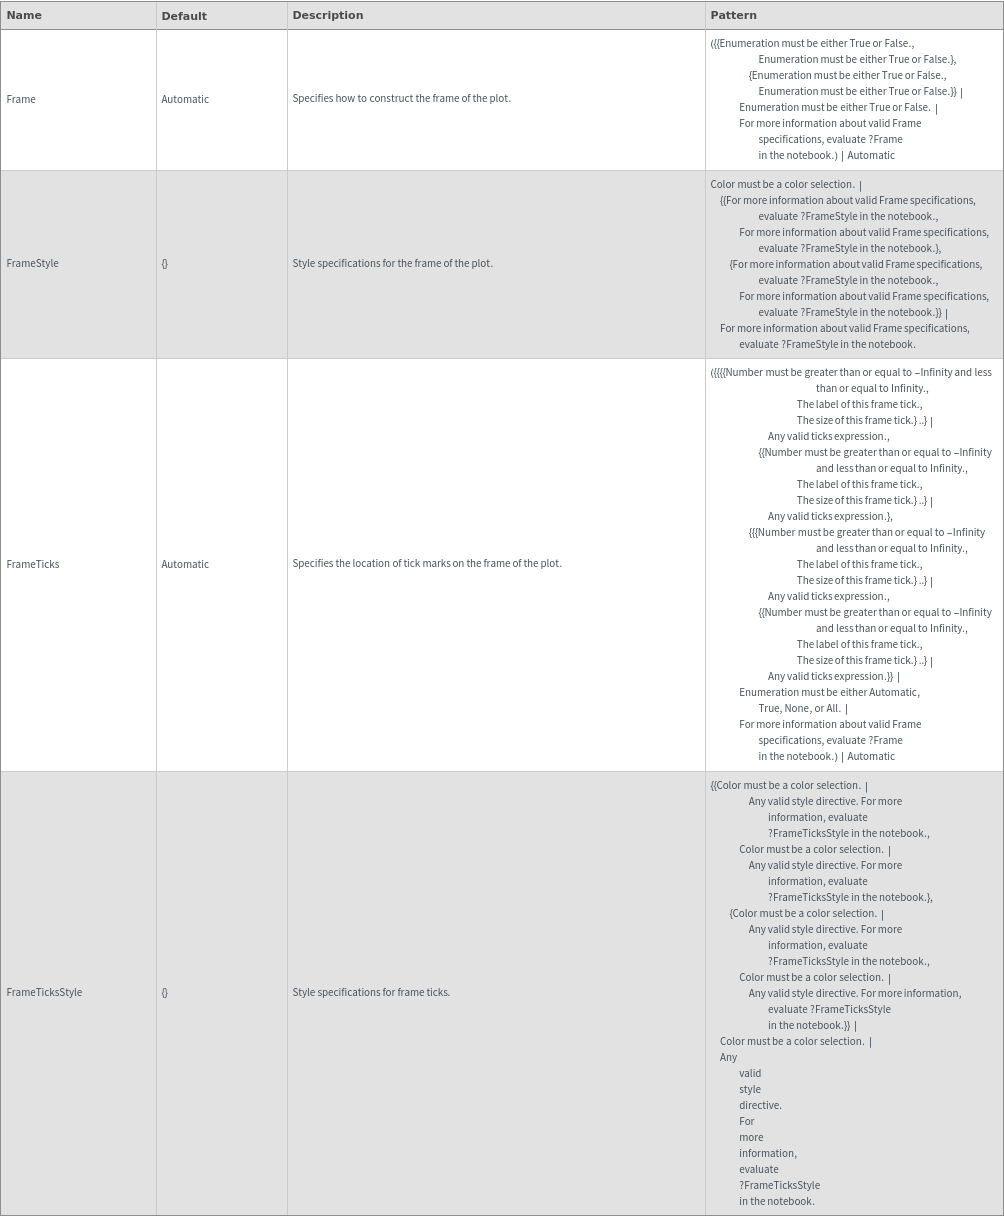
Frame Options
Grid Options
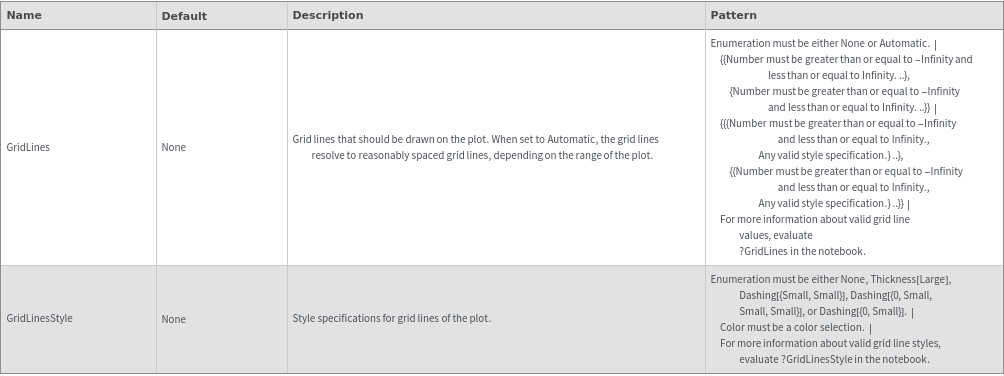
Image Format Options
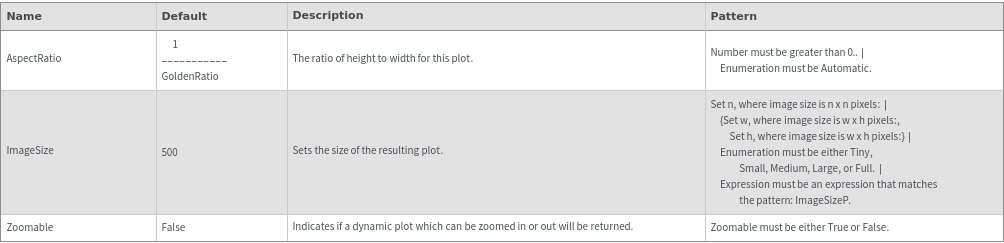
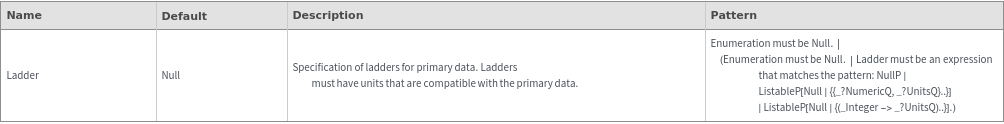
Ladder Options
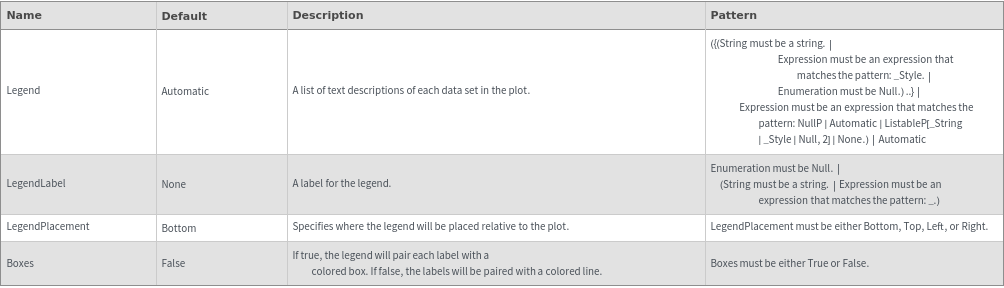
Legend Options
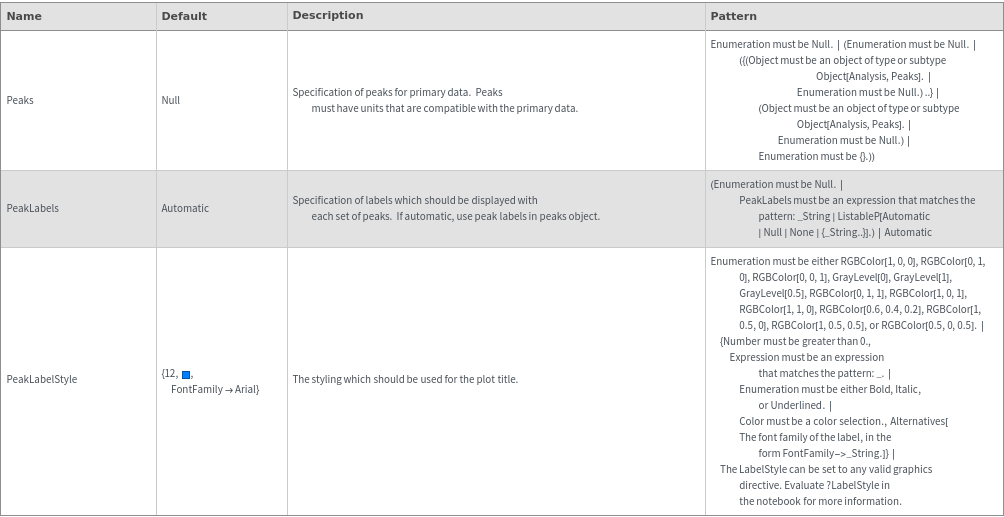
Peaks Options
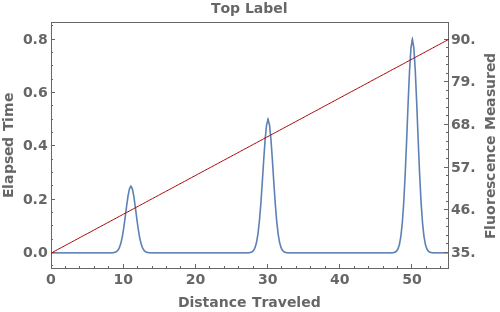
Plot Labeling Options
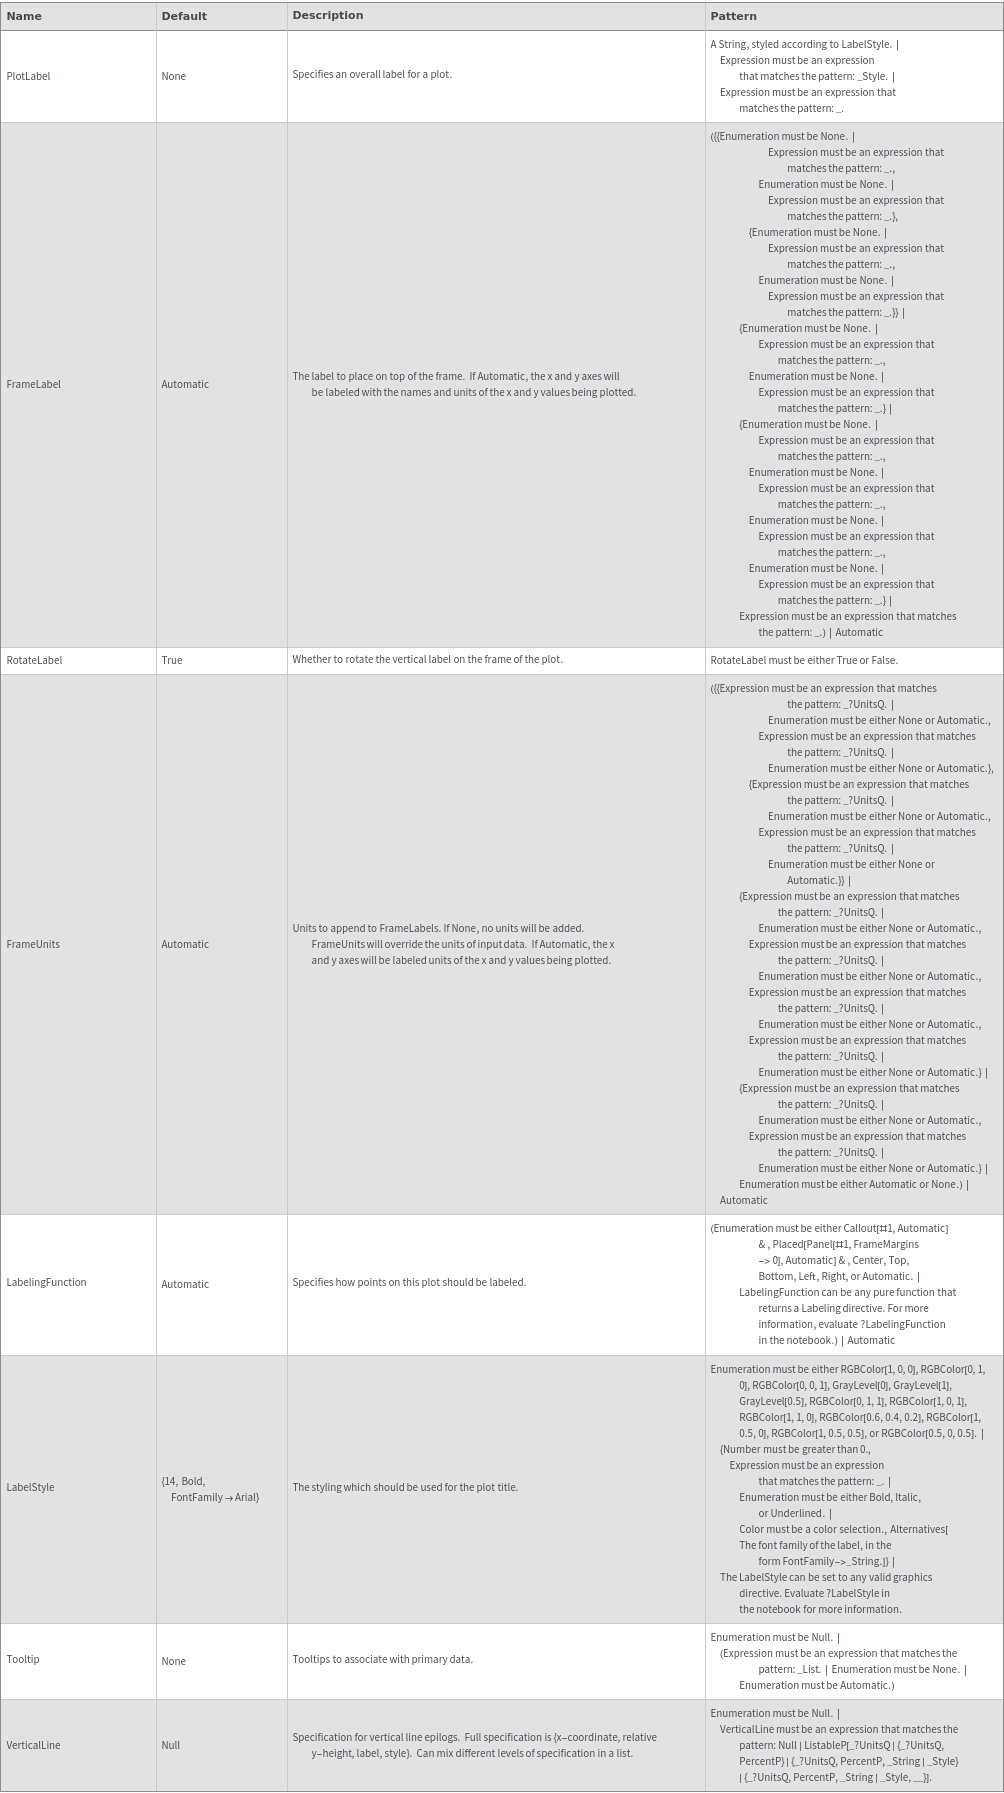
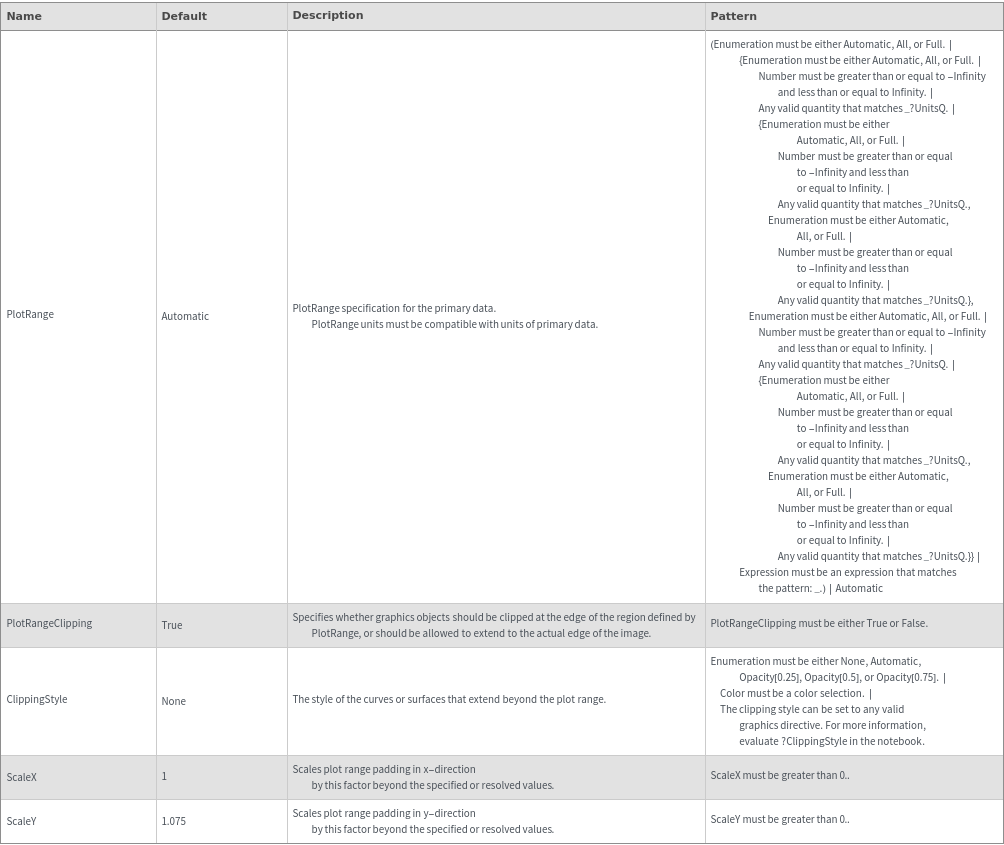
Plot Range Options
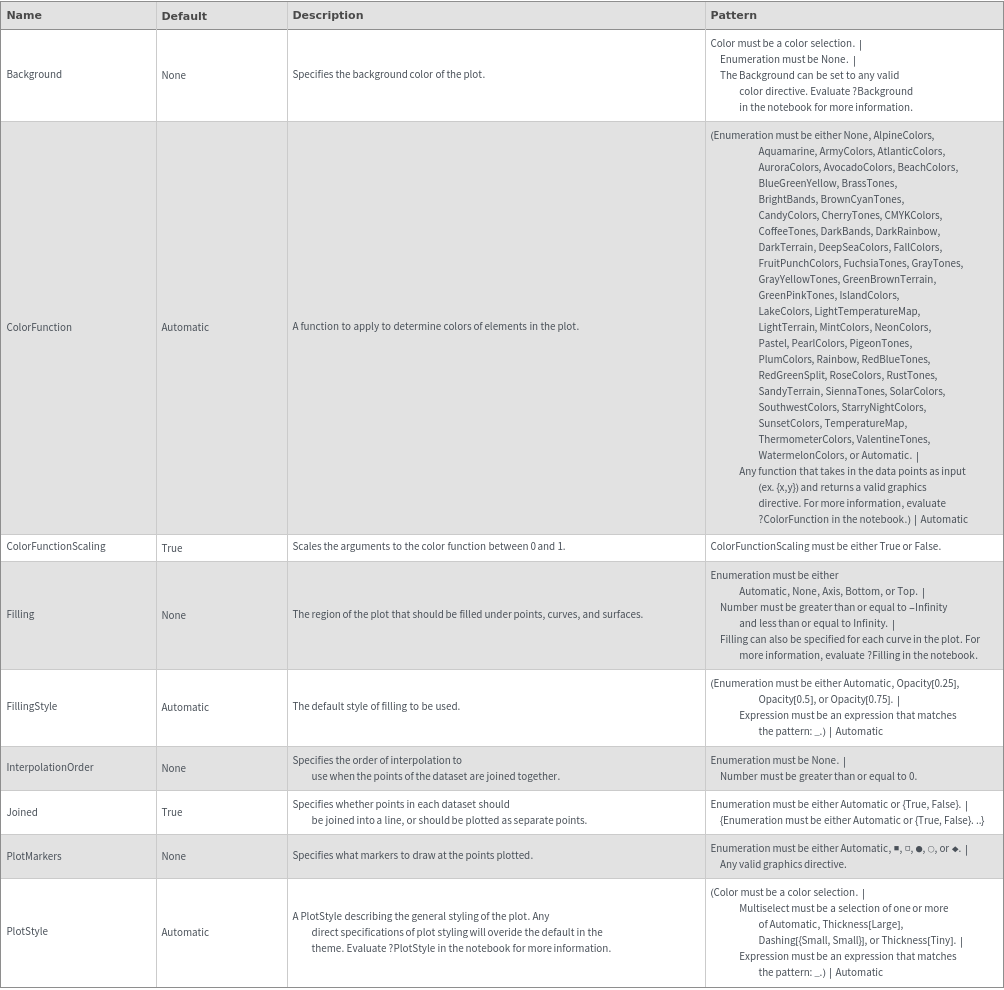
Plot Style Options
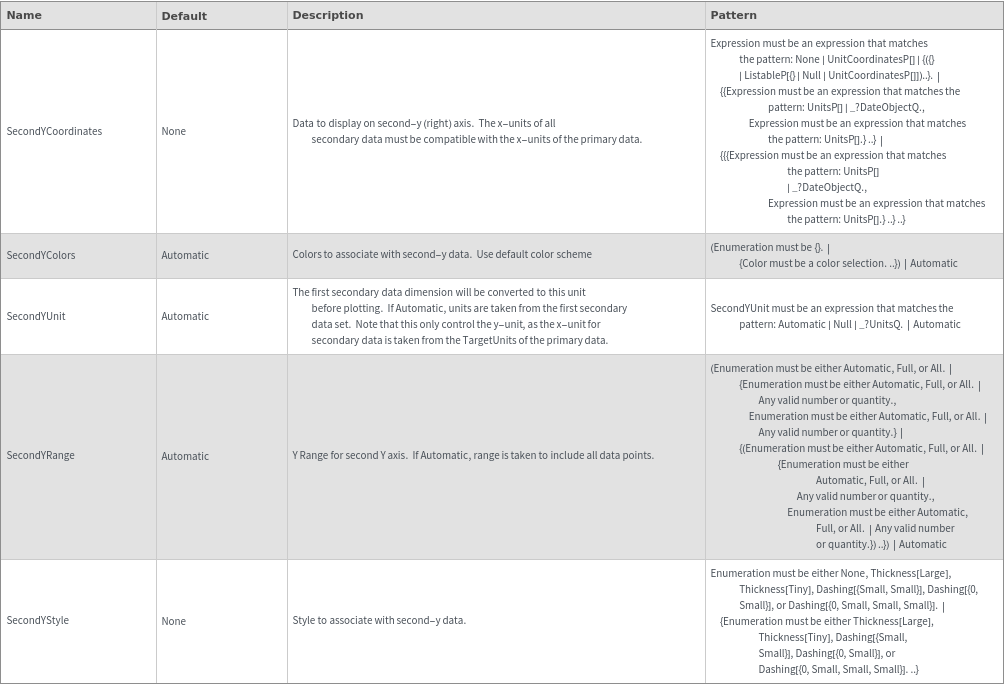
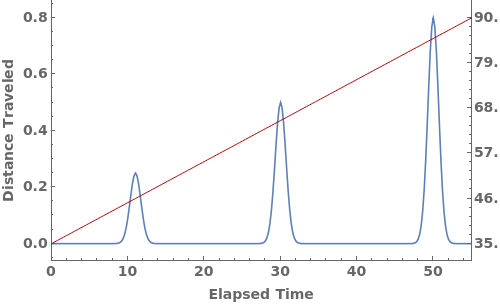
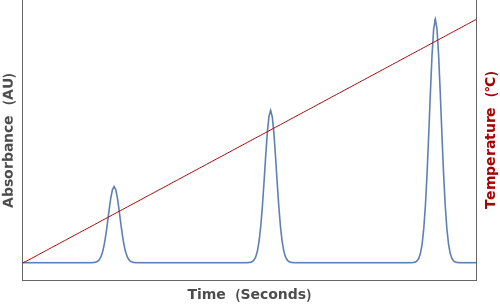
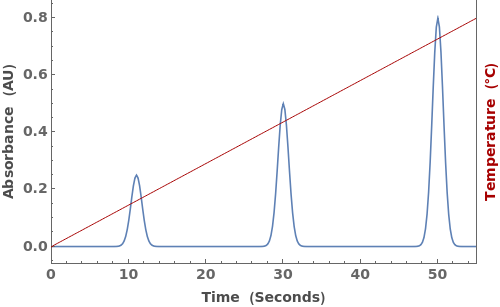
Secondary Data Options
General Options
Messages
Examples
Basic Examples (3)


Additional Examples (14)


Missing Data (8)
Null values in a coordinate list are ignored and not connected:

Null values in primary data set are ignored:

Null values in secondary data set are ignored:

Null values at top level of secondary data set skip that data entirely:

Null is also the placeholder for absent Peaks:

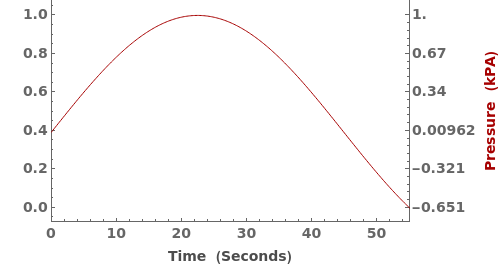
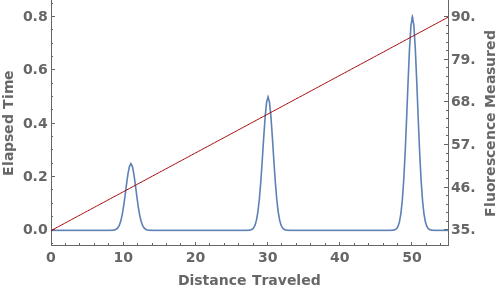
Secondary axis is labeled with first signal that is not completely null:

An empty plot is returned if no data is given:

Can specify secondary data without primary data:


Options (120)
AspectRatio (2)


ClippingStyle (2)


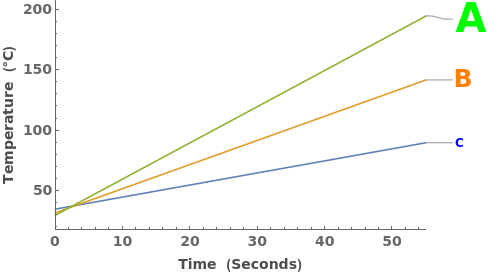
ColorFunction (3)
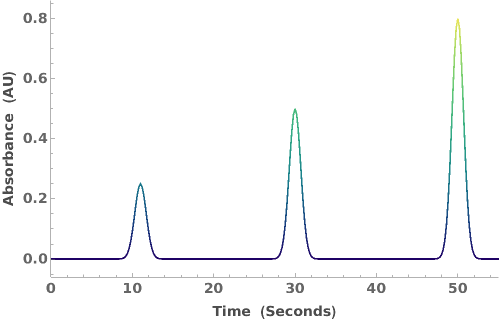
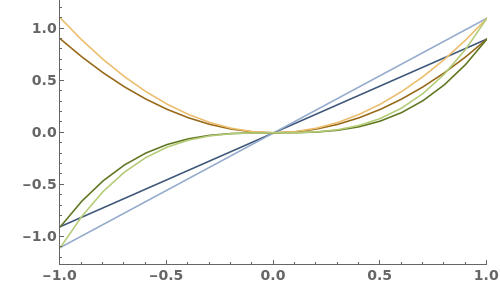
Specify a coloring function for the lines in our plot. To see all of the built in ColorFunctions, evaluate ColorData["Gradients"] in the notebook:

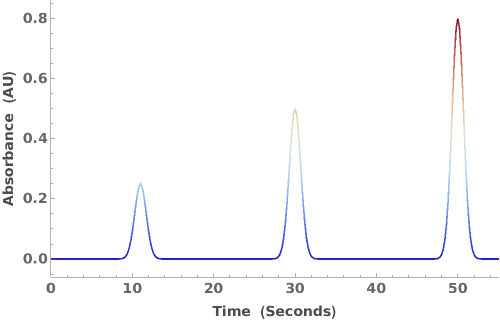
Specify a coloring function for the lines in our plot. To see all of the built in ColorFunctions, evaluate ColorData["Gradients"] in the notebook:

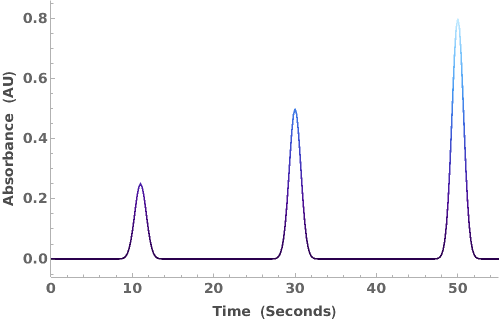
Specify a coloring function for the lines in our plot. To see all of the built in ColorFunctions, evaluate ColorData["Gradients"] in the notebook:

ColorFunctionScaling (1)


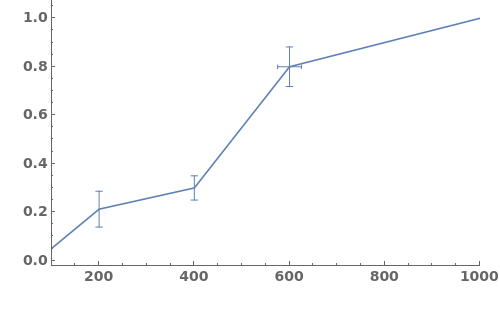
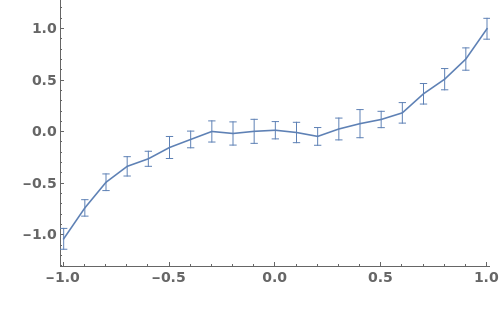
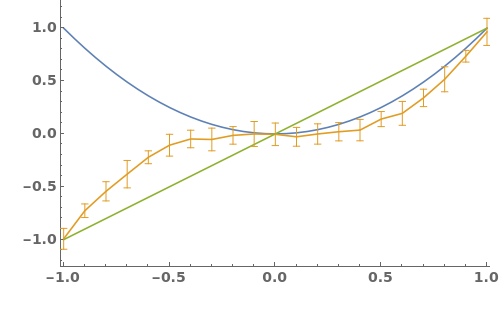
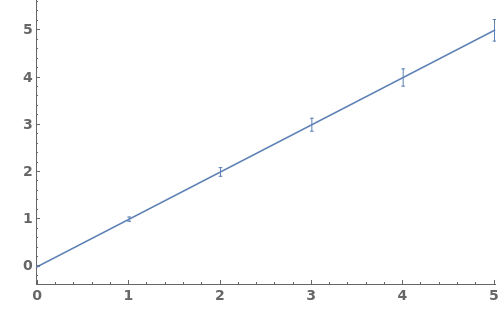
ErrorBars (2)

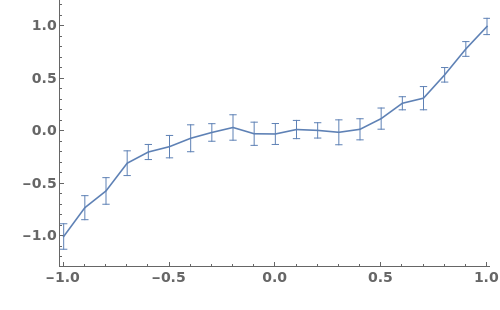

ErrorType (2)


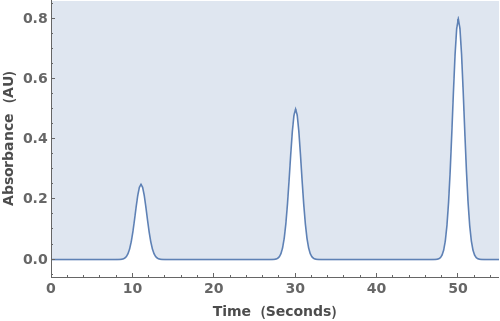
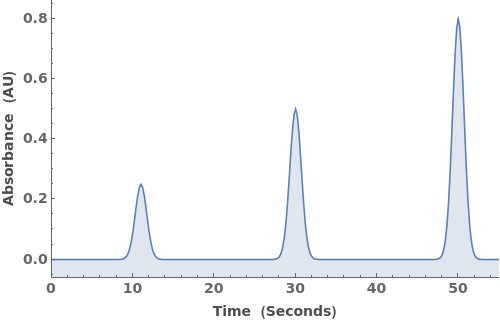
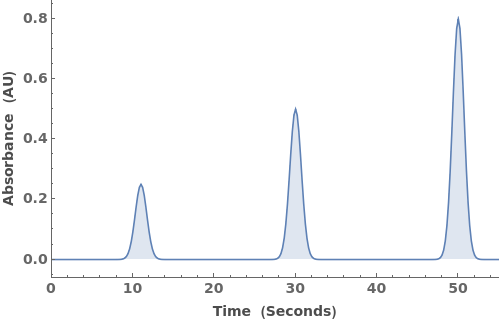
Filling (4)


FillingStyle (1)


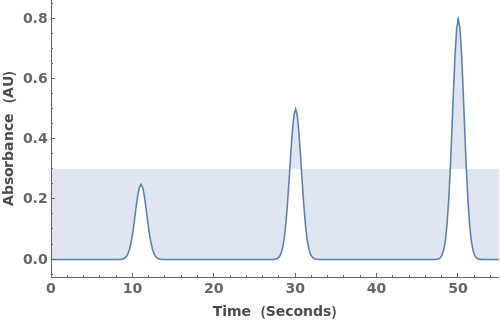
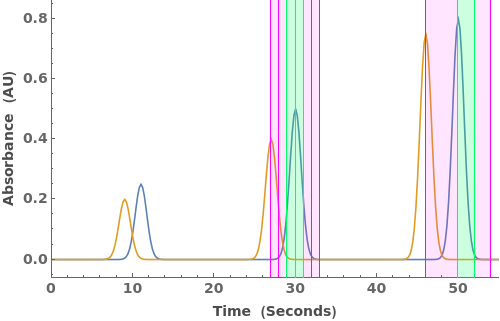
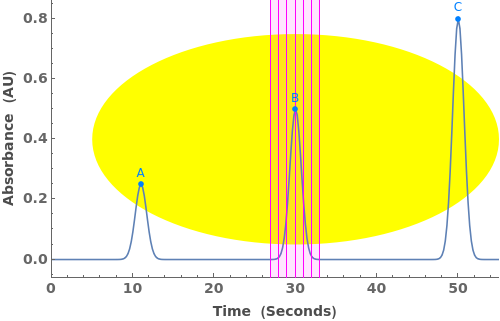
FractionHighlights (2)


Frame (2)
Specify which parts of the plot's frame should be visible. Frame is specified in the format {{Left Frame, Right Frame},{Bottom Frame, Top Frame}}. In the following example, all frame borders are visible:

Specify which parts of the plot's frame should be visible. Frame is specified in the format {{Left Frame, Right Frame},{Bottom Frame, Top Frame}}. In the following example, only the left and bottom frame borders are visible:

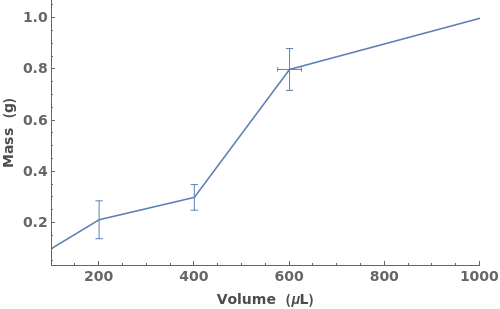
FrameLabel (6)


FrameStyle (3)
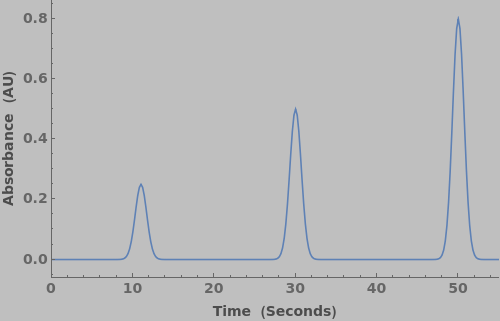
Specify the style of the plot's frame. FrameStyle can be set to any valid graphics directive. For more information, evaluate ?FrameStyle in the notebook:

Specify the style of the plot's frame. FrameStyle can be set to any valid graphics directive. For more information, evaluate ?FrameStyle in the notebook:


Specify the style of the plot's frame. FrameStyle can be set to any valid graphics directive. For more information, evaluate ?FrameStyle in the notebook:


FrameTicksStyle (1)


GridLines (1)

GridLinesStyle (1)

ImageSize (3)


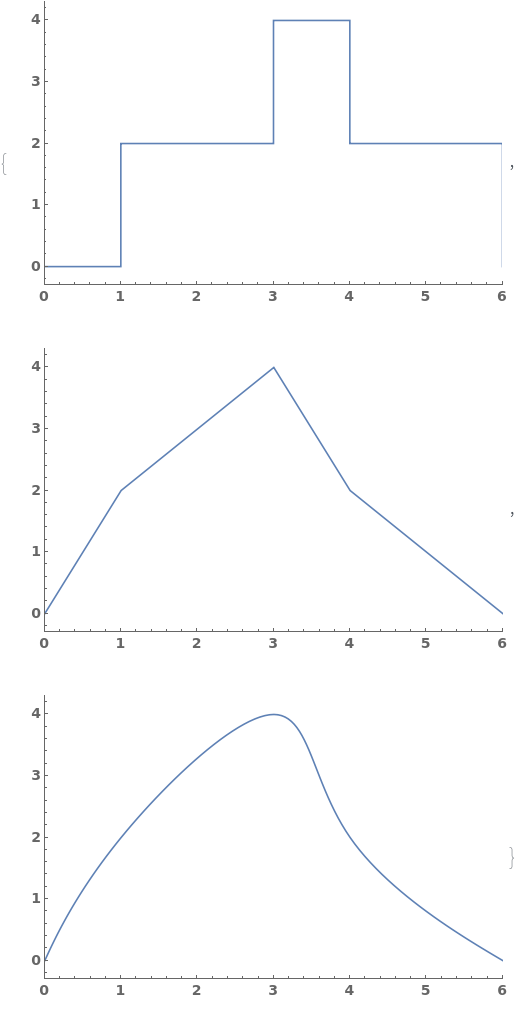
InterpolationOrder (1)

Joined (6)
If Joined->False, data points are not connected by lines:

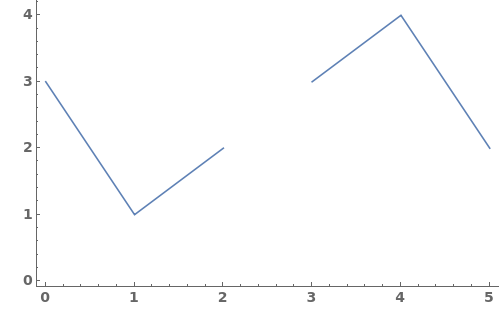
If Joined->Automatic, data points are connected only if their x-values are monotonically increasing:

If Joined->Automatic and x-values are out of order, points are left unconnected:

Specify a Joined value for each data set:

Specify a Joined value for each data set when grouped primary data is present:

Incomplete Joined speciication is padded right with the last value:

LabelingFunction (1)

LabelStyle (1)


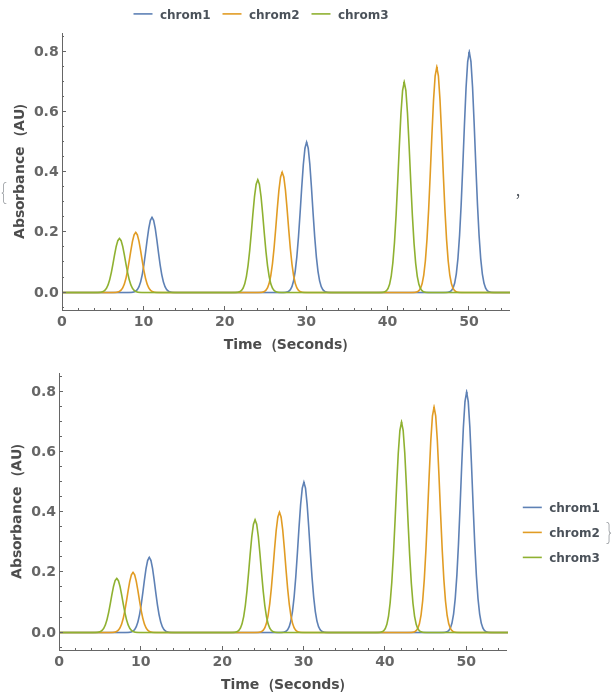
Legend (3)


Normalize (2)

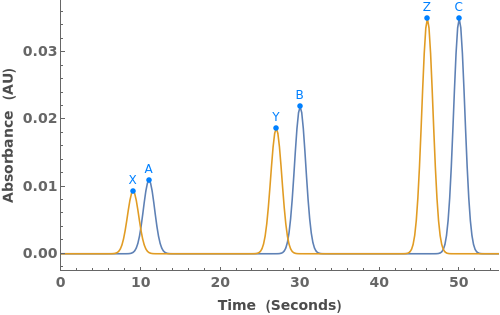


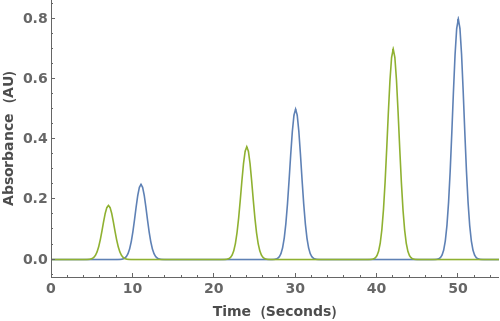
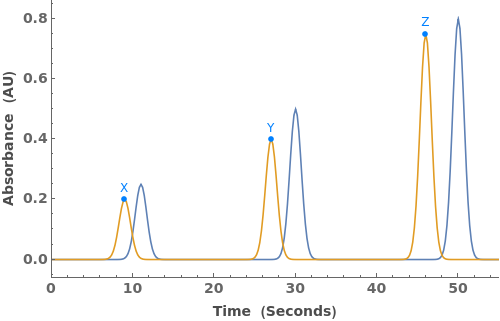
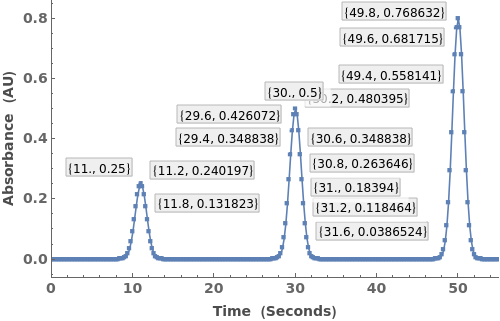
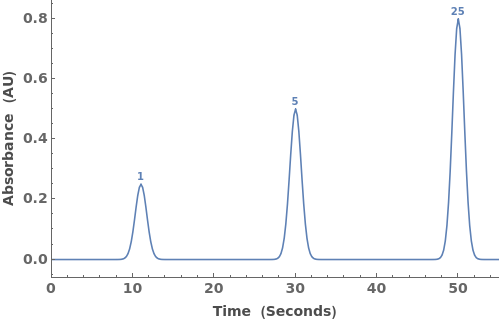
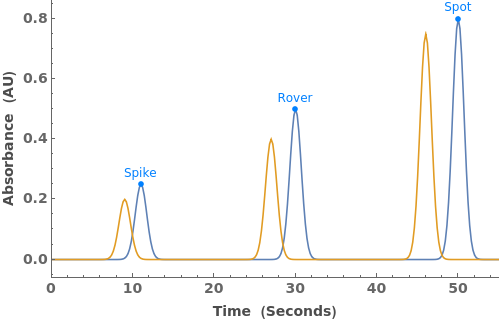
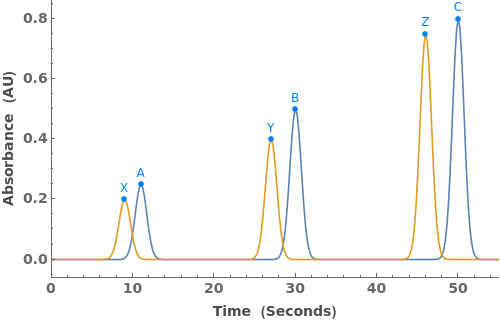
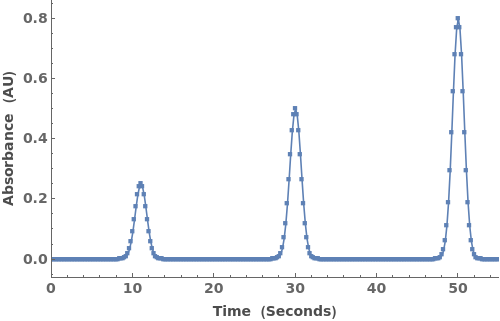
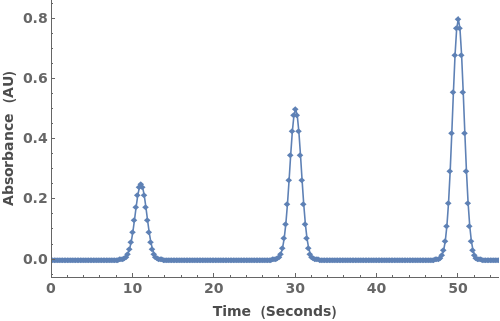
PeakLabels (3)


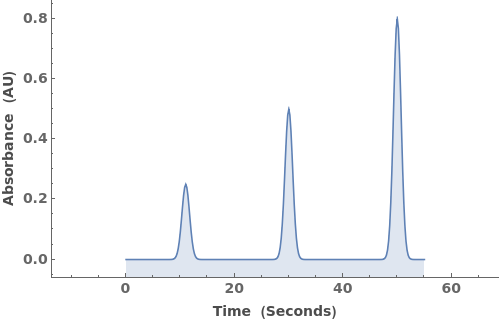
Peaks (4)


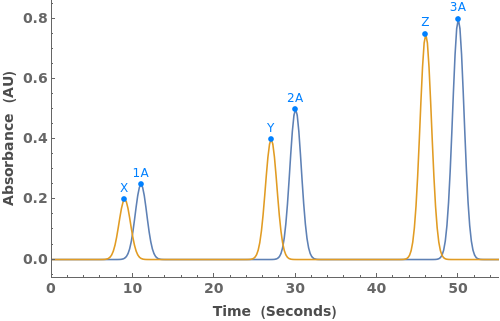
PlotLabels (2)


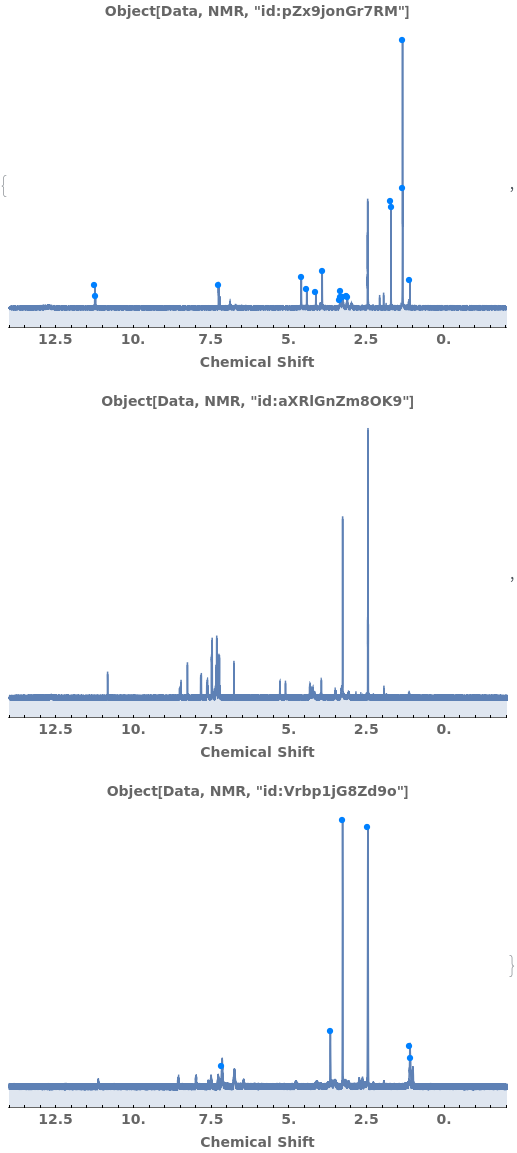
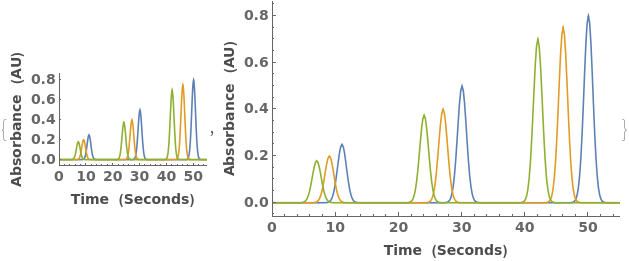
PlotLayout (1)

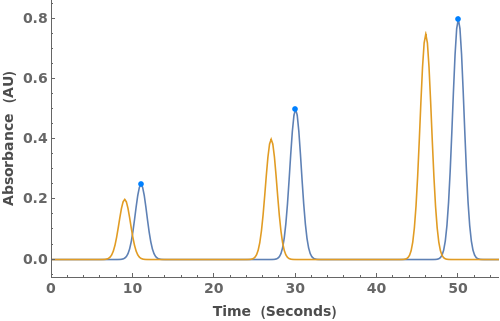
PlotMarkers (3)


PlotRange (4)
Specify plot range for primary data. Units in PlotRange must be compatible with primary data units:

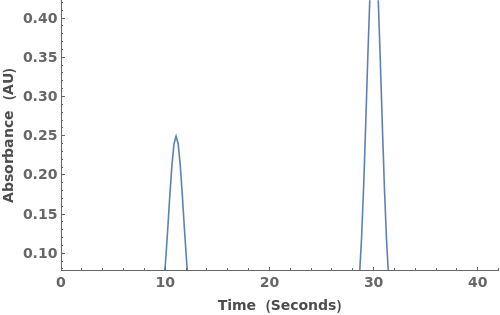
Can mix explicit specification with Automatic resolution:

Automatic resolution of Y-range depends on the values remaining after filtering based on X-range:

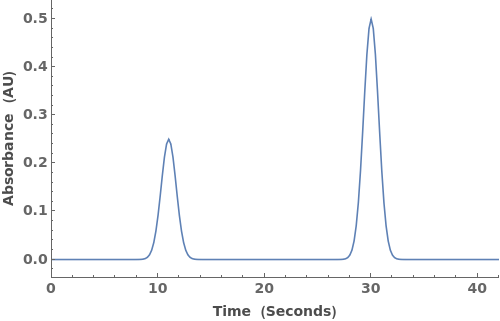
Automatic resolution of Y-range depends on the values remaining after filtering based on X-range:
PlotRangeClipping (2)
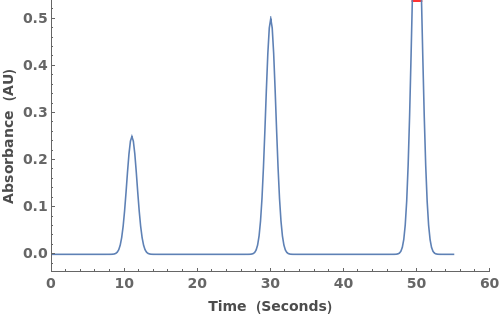
PlotRangeClipping specifies whether graphics objects should be clipped at the edge of the region defined by PlotRange or should be allowed to extend to the actual edge of the image. In the following example, the data extends past the actual PlotRange of the image:

PlotRangeClipping specifies whether graphics objects should be clipped at the edge of the region defined by PlotRange or should be allowed to extend to the actual edge of the image. In the following example, the data is cutoff at 50, since that is the maximum x-value set by the PlotRange:


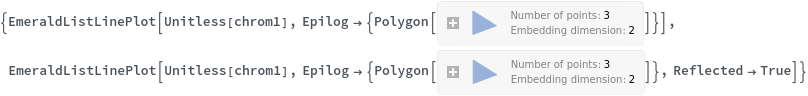
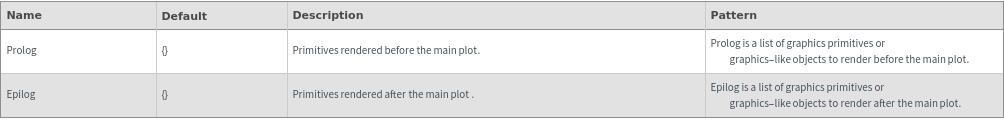
Prolog (1)

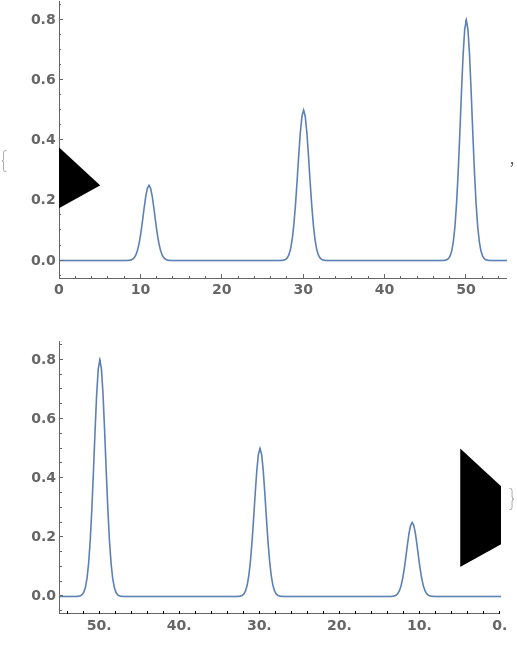
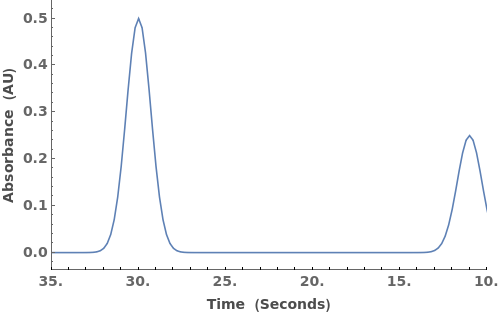
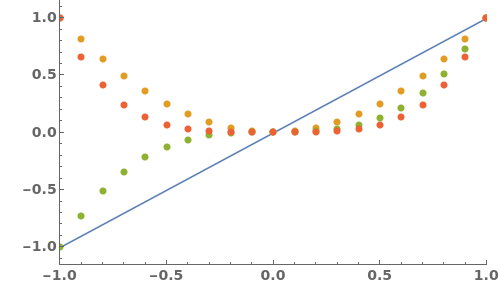
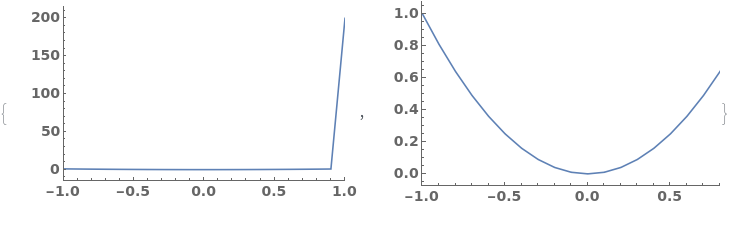
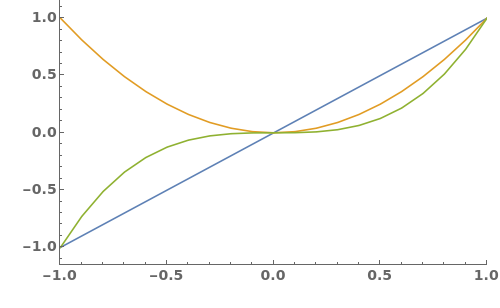
Reflected (2)


RotateLabel (2)


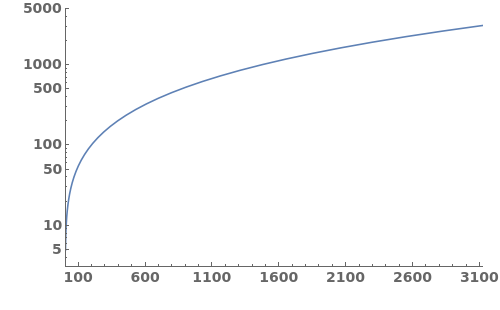
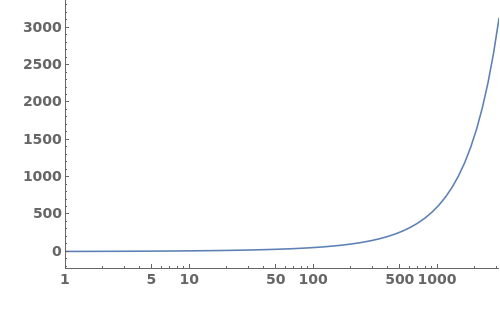
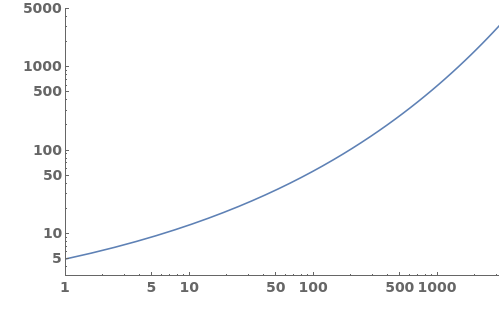
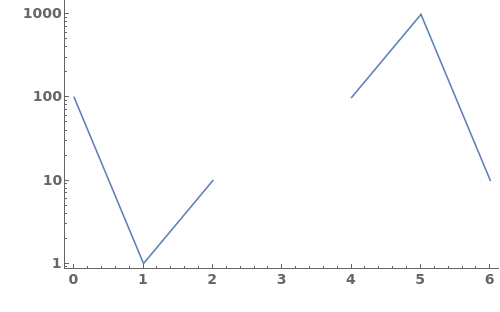
Scale (4)


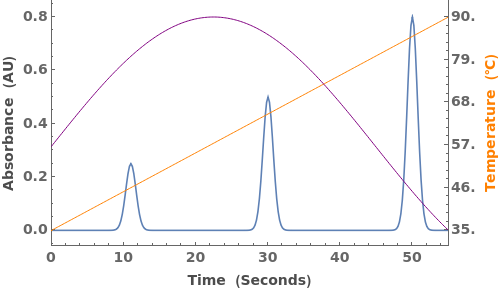
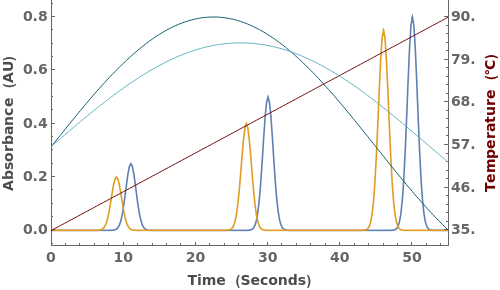
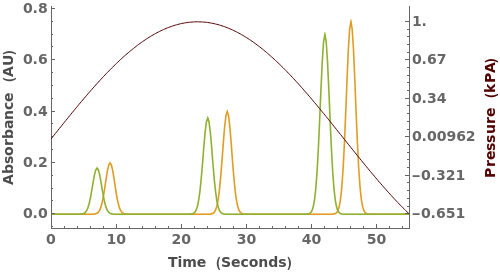
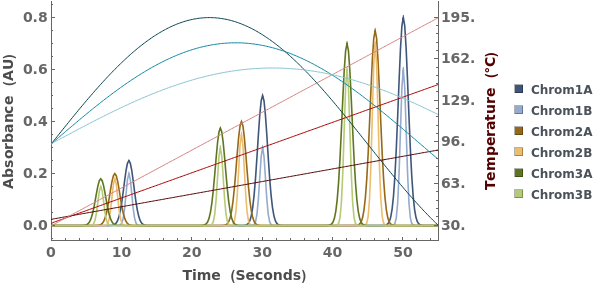
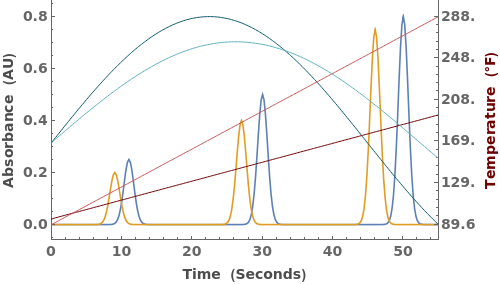
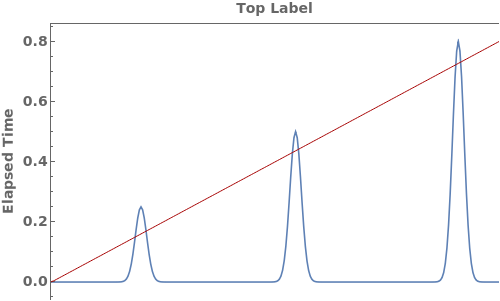
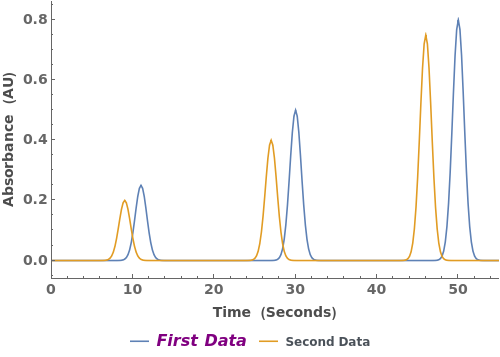
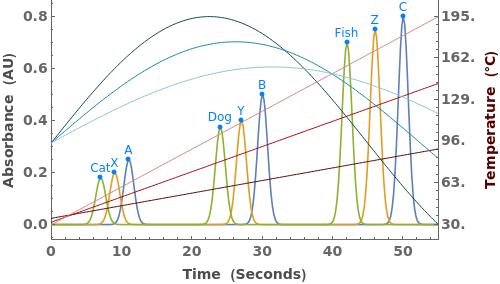
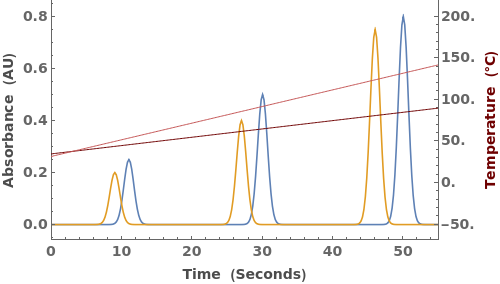
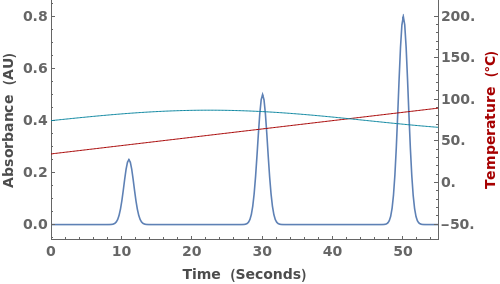
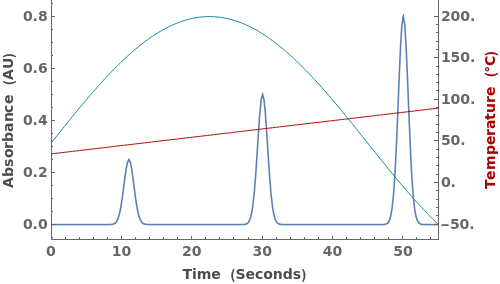
SecondYCoordinates (3)

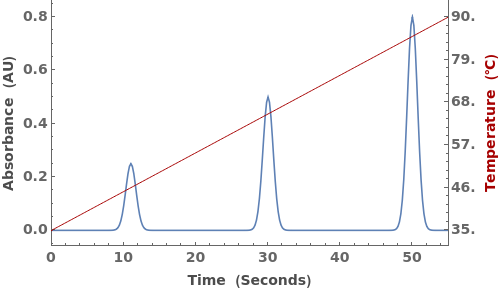

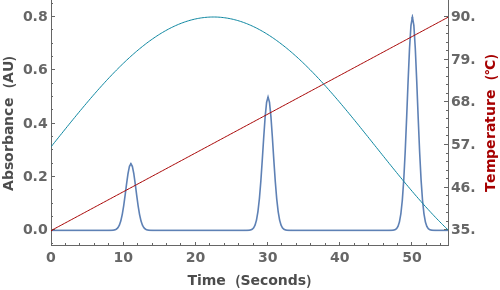

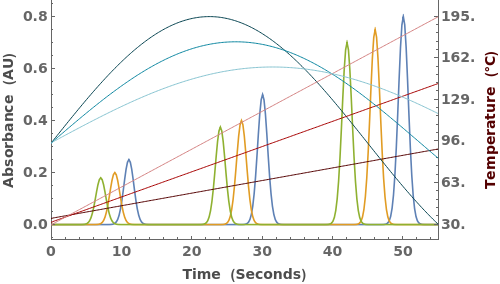
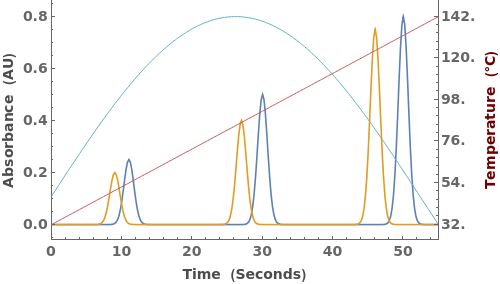
SecondYRange (4)


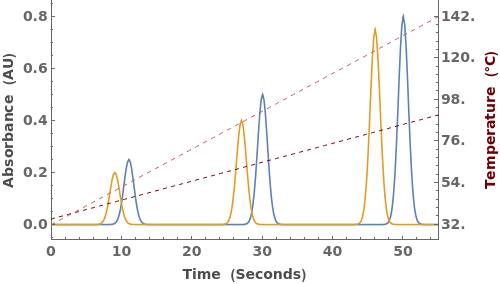

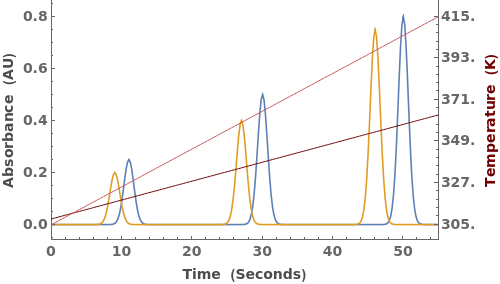
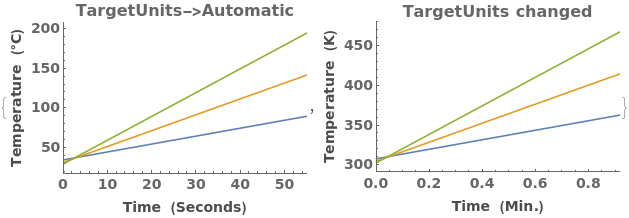
TargetUnits (2)


Tooltip (3)


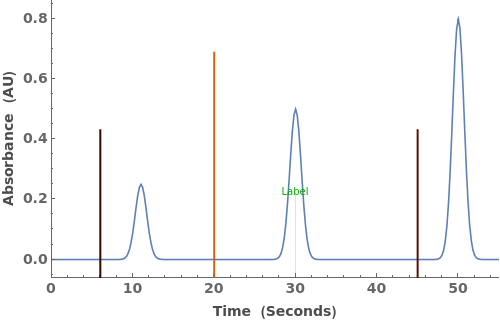
VerticalLine (5)
Specify vertical line at a position:

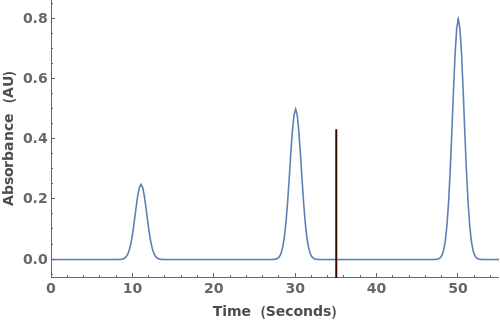
Specify x-position and relative y-height:


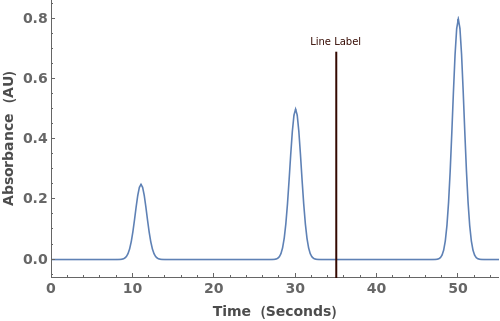
Specify x-position, relative y-height, and label:

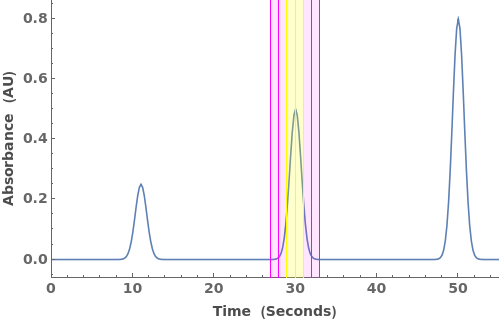
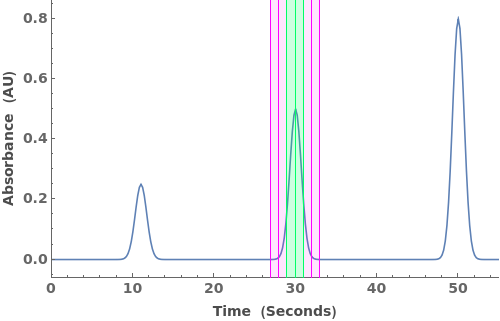
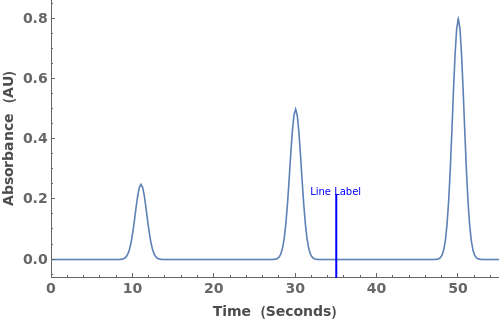
Full specification for a vertical line epilog: x-position, relative y-height, label, style__:

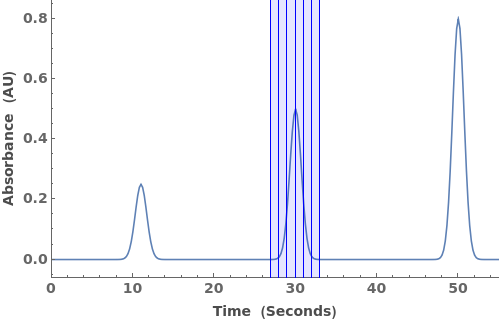
Specify multiple vertical lines in a list. Can mix different levels of specification detail: