EmeraldListPlot3D
EmeraldListPlot3D[dataset]⟹3Dplot
creates a 3D list plot of dataset.
EmeraldListPlot3D[datasets]⟹3Dplot
creates a 3D list plot of datasets.
Details
Input
Output

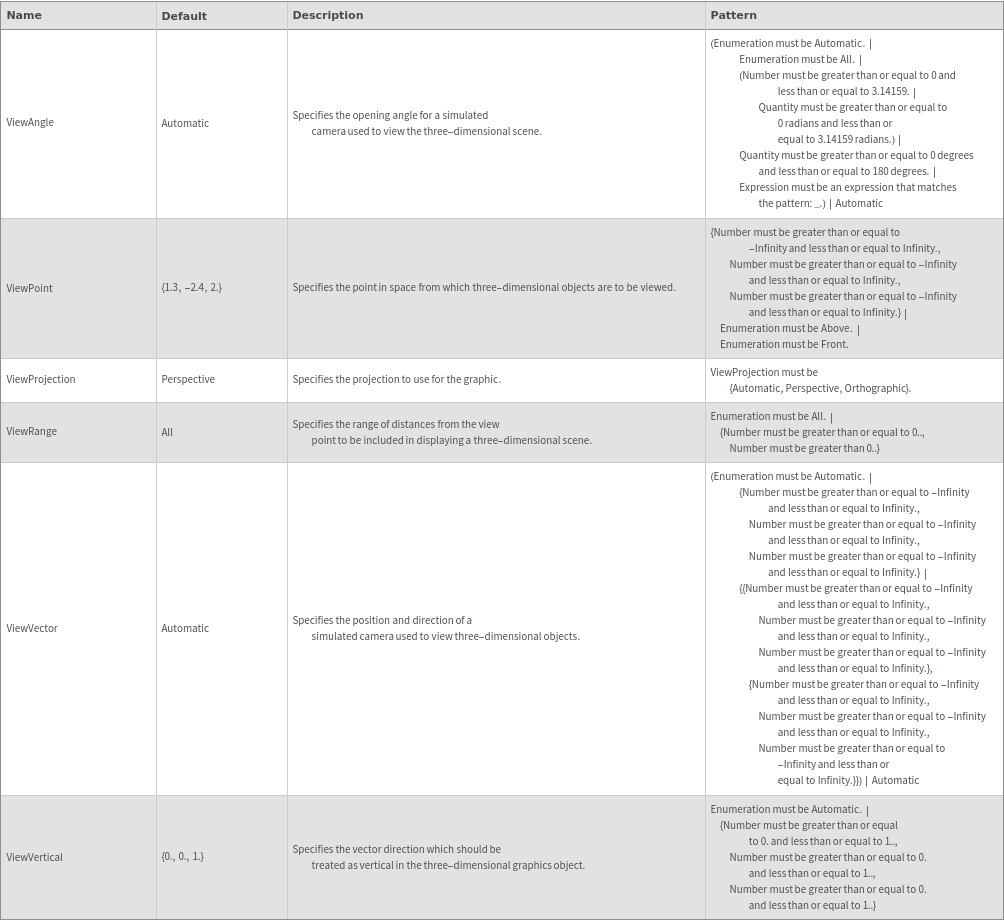
3D View Options
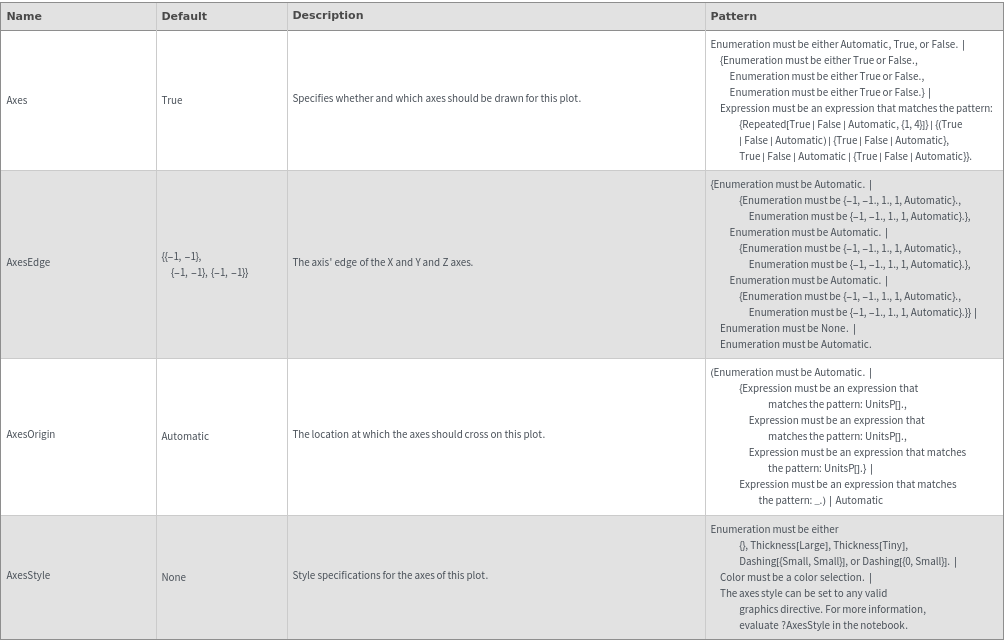
Axes Options
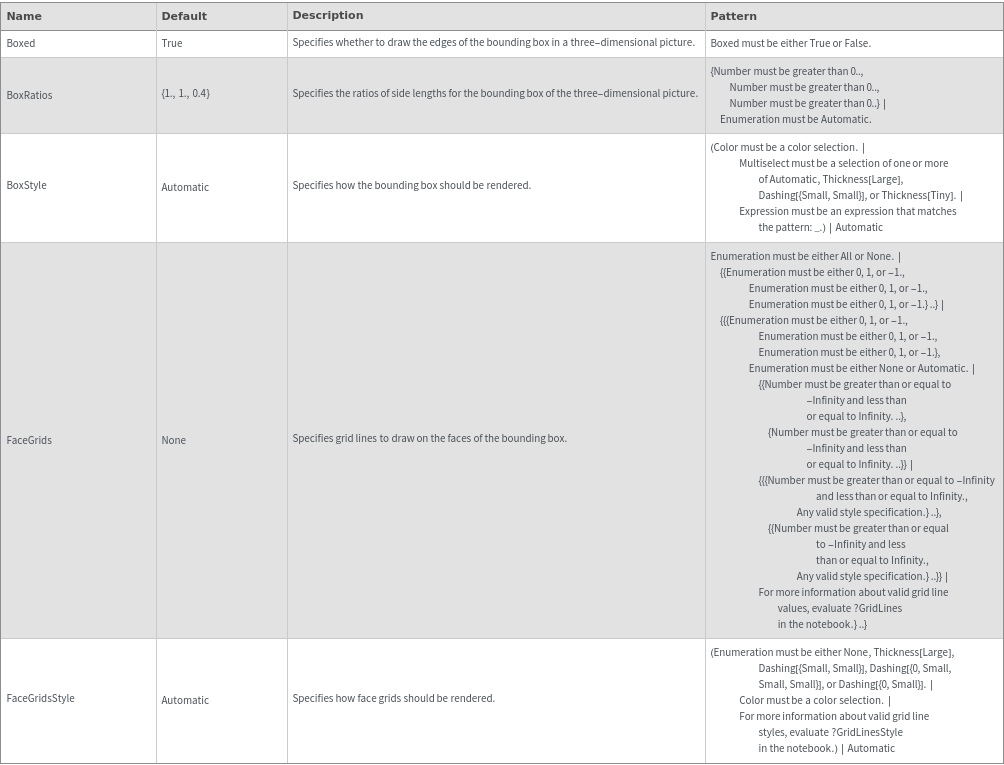
Box Options
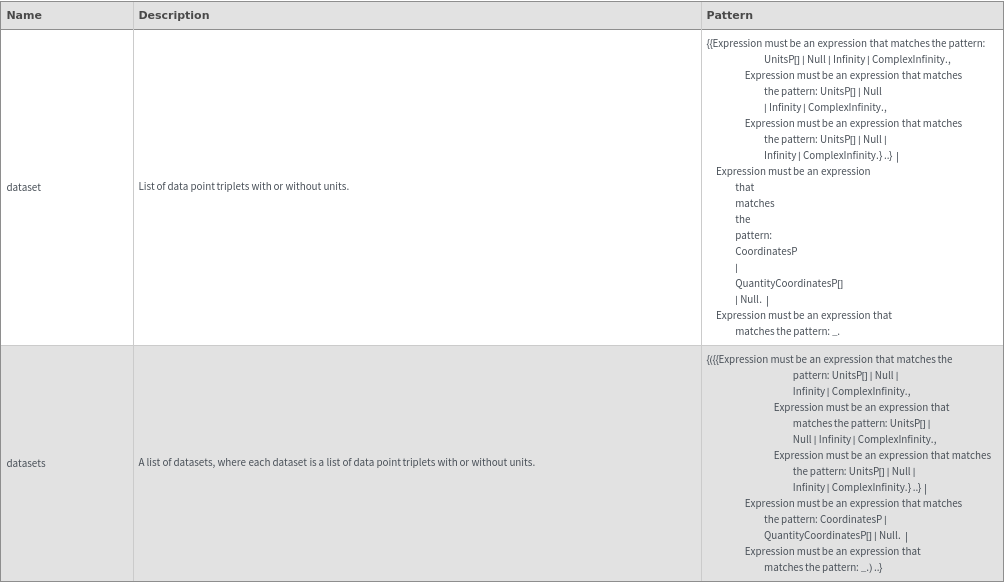
Data Specifications Options
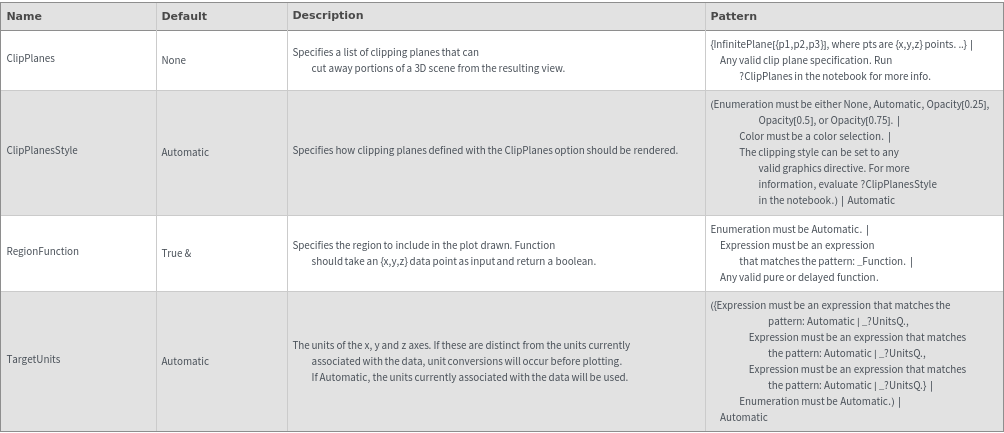
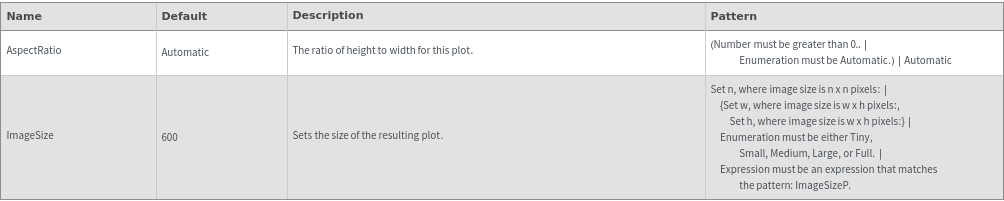
Image Format Options
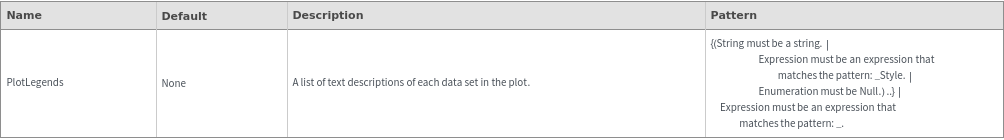
Legend Options
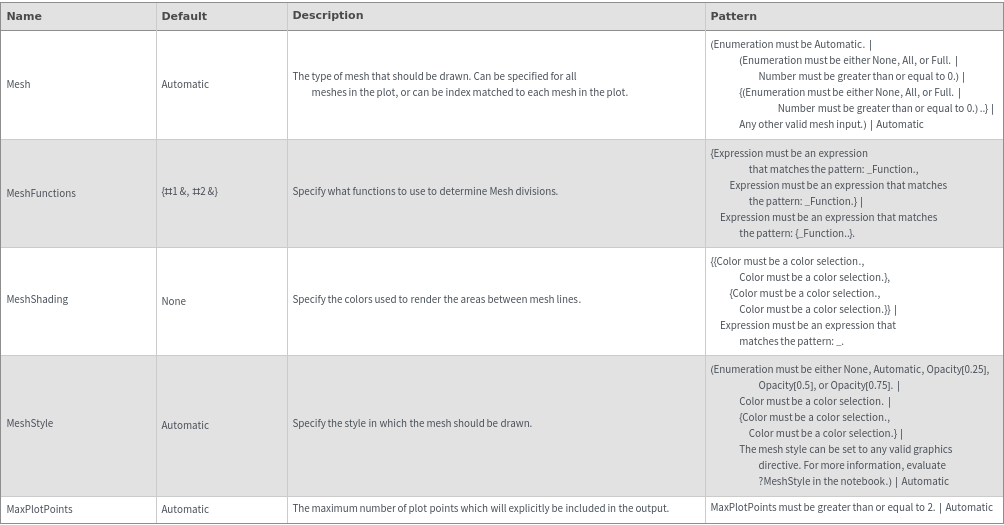
Mesh Options
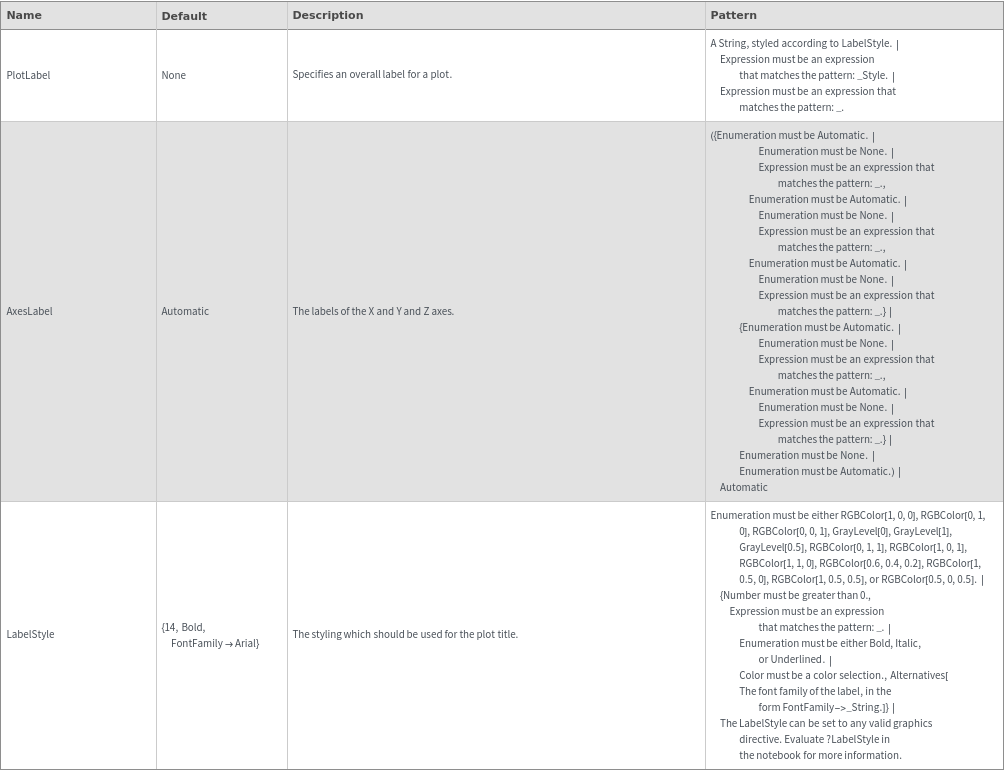
Plot Labeling Options
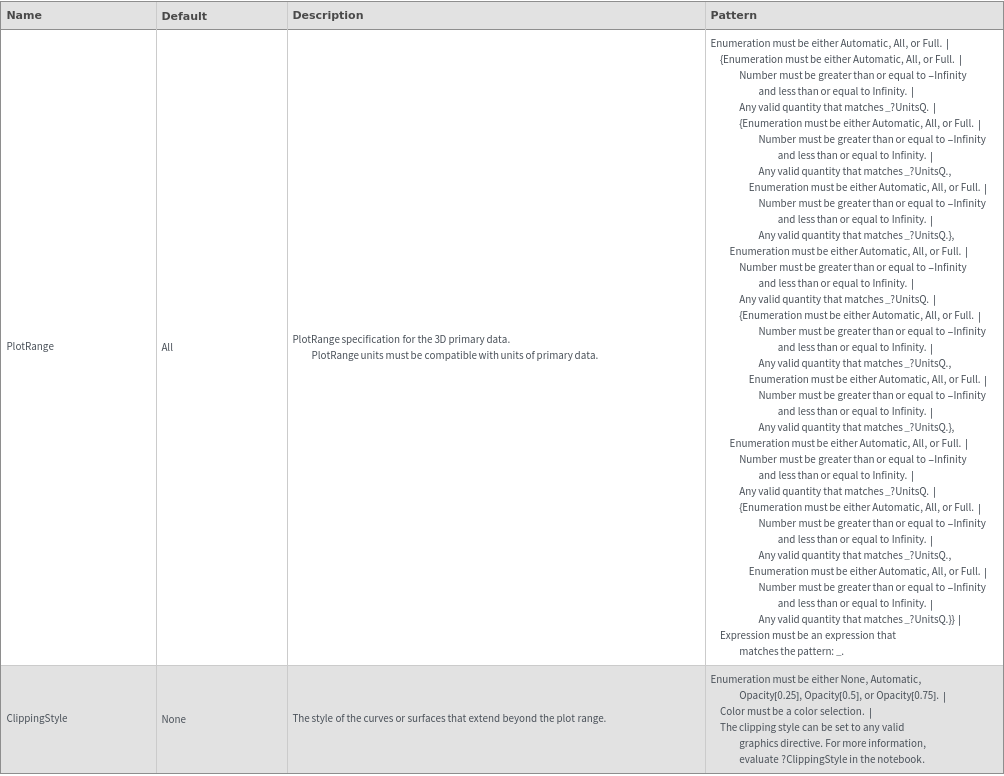
Plot Range Options
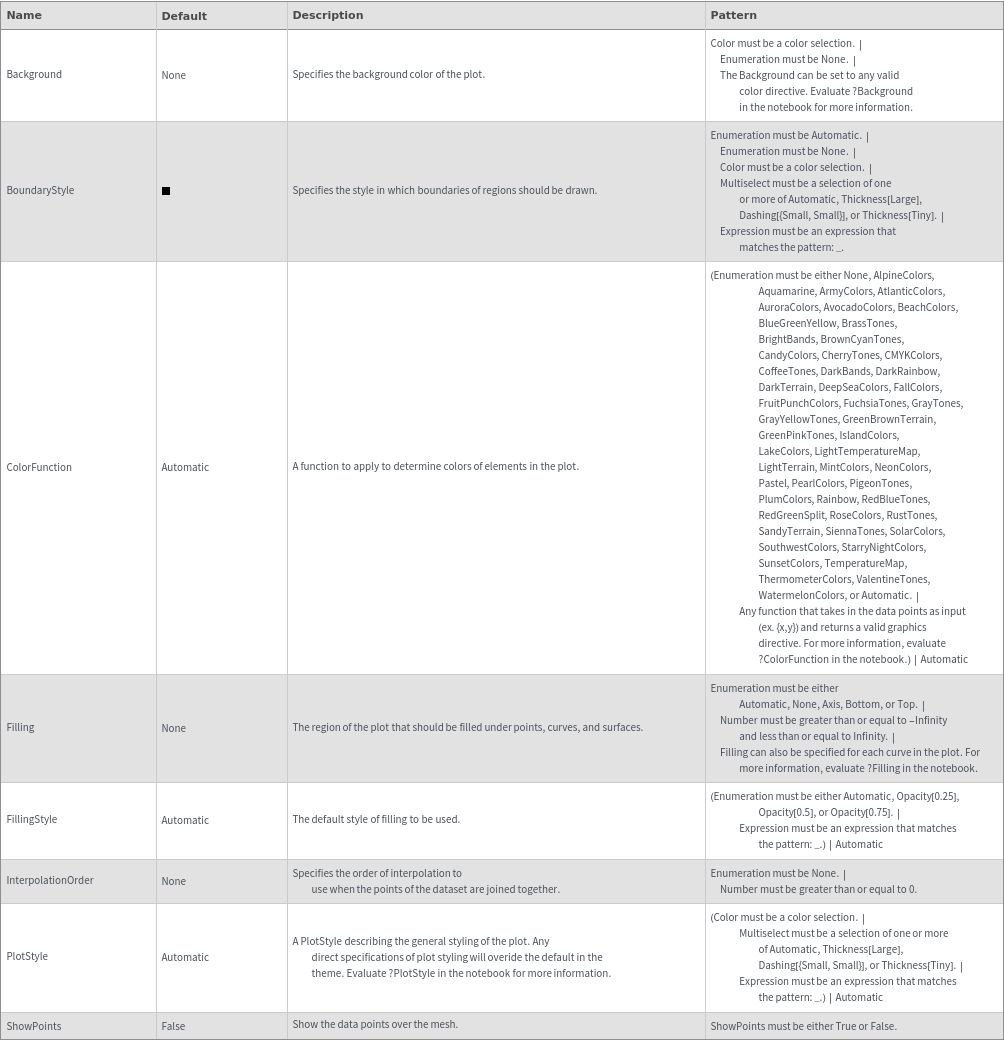
Plot Style Options
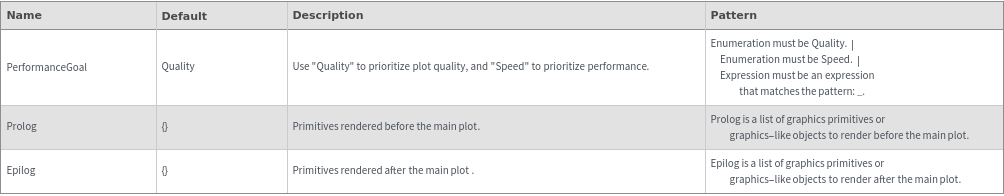
General Options
Examples
Basic Examples (4)


Additional Examples (5)
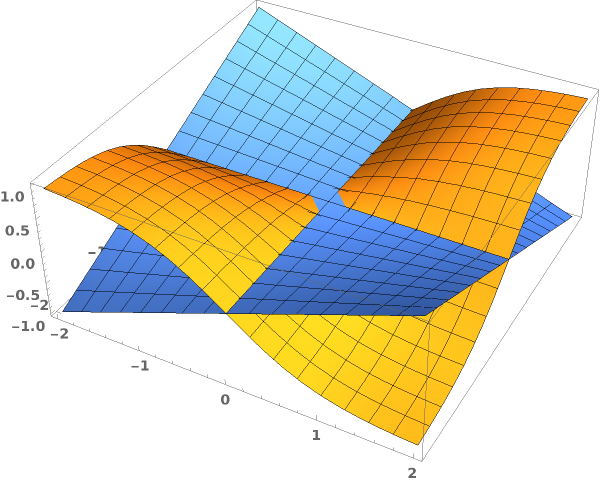
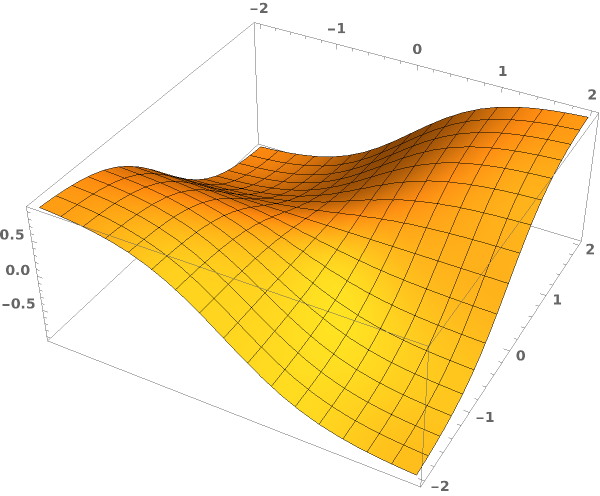
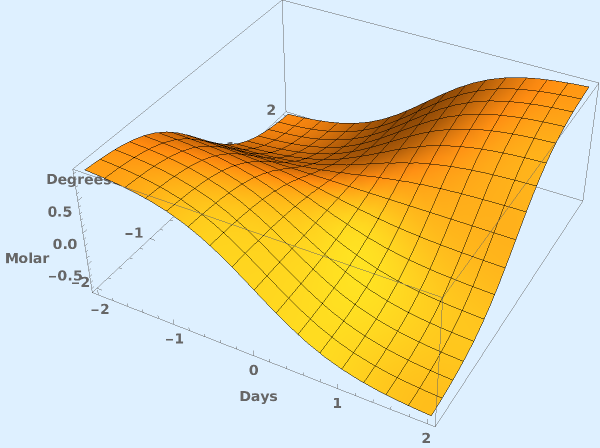
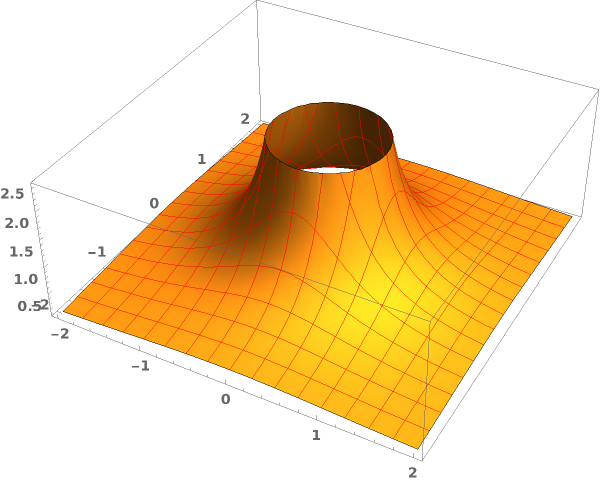
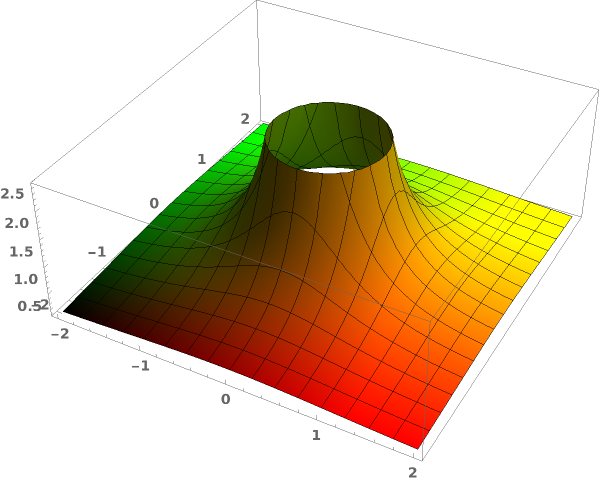
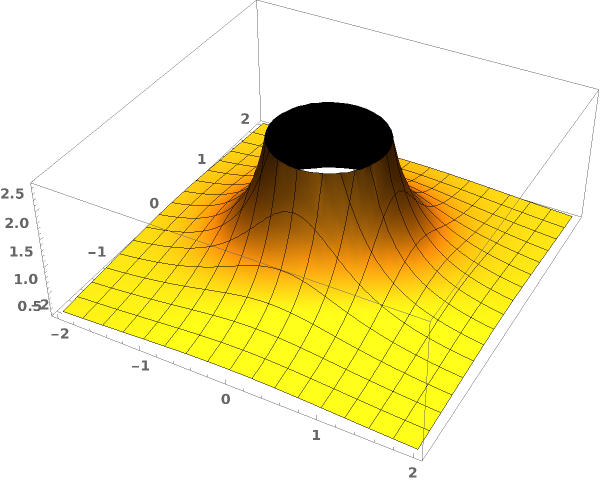
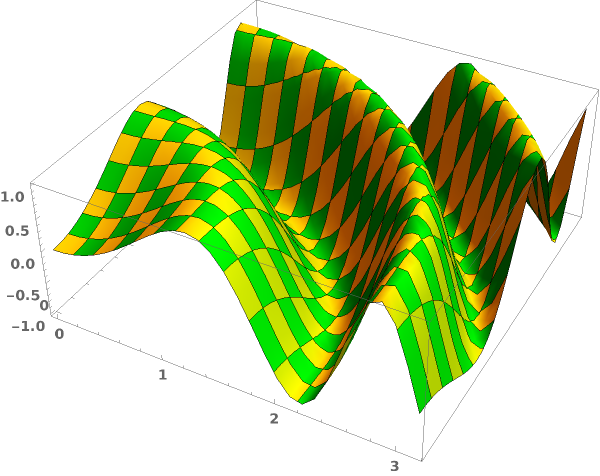
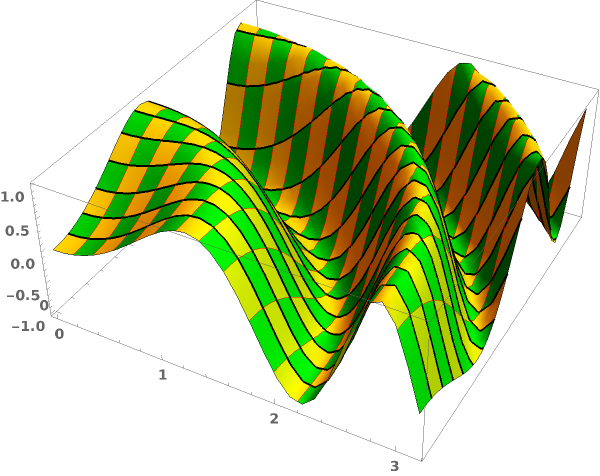
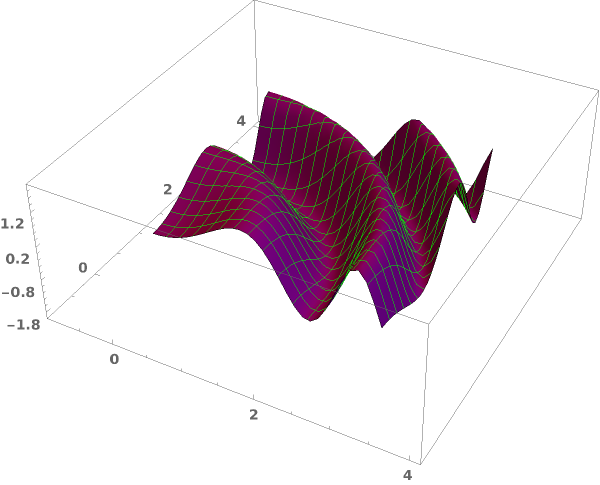
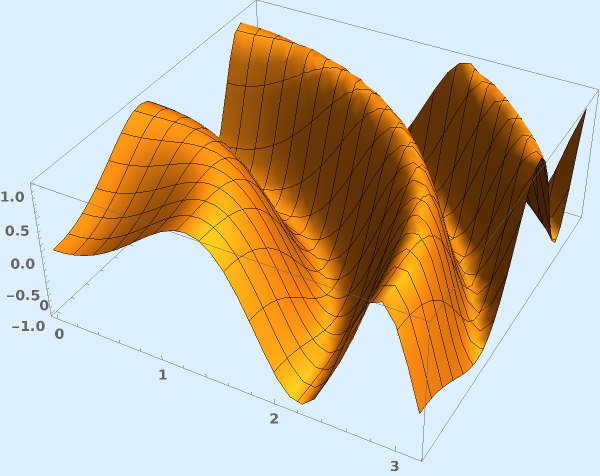
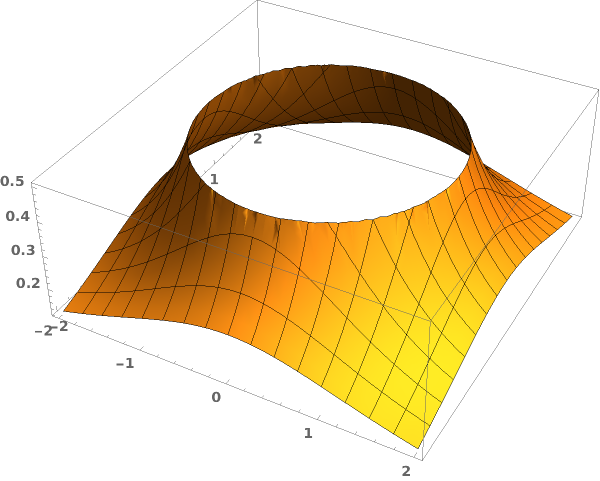
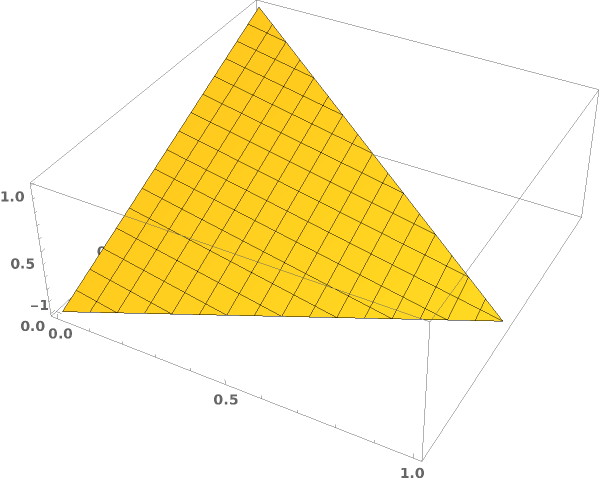
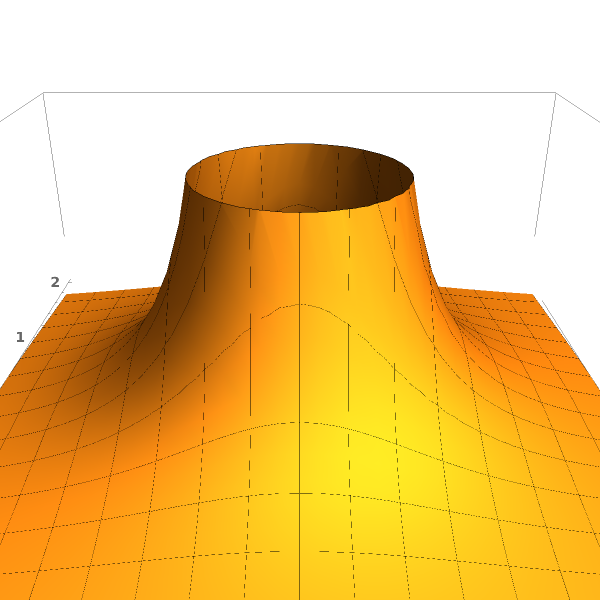
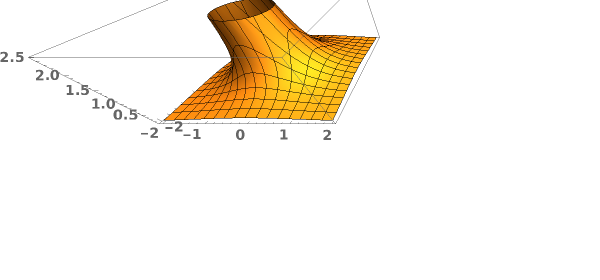
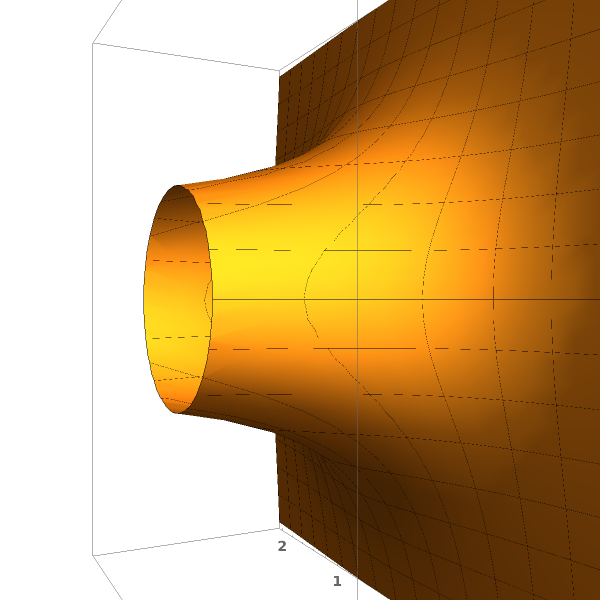
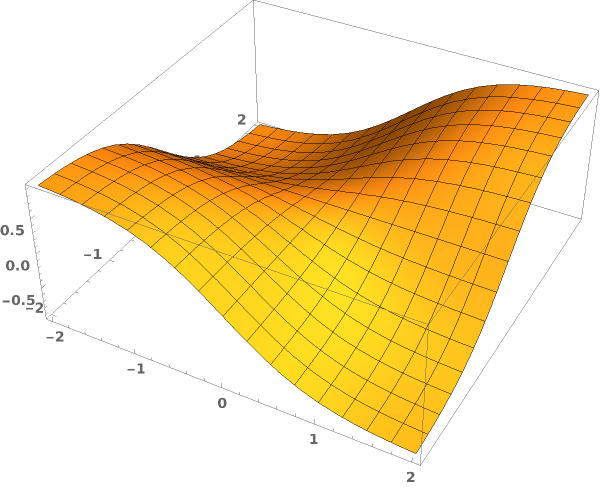
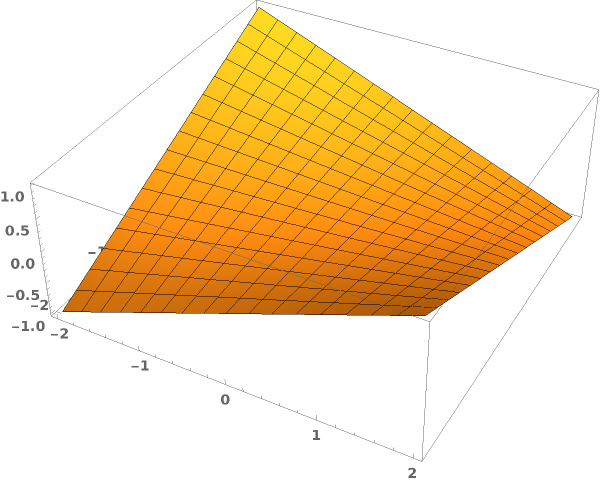
Specify PlotObject to use EmeraldListPlot3D for raw 3D lists:

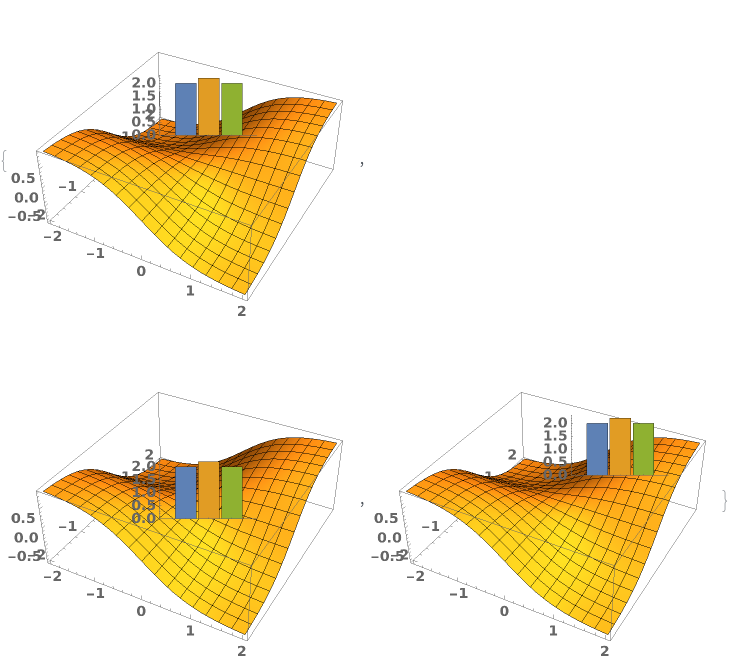
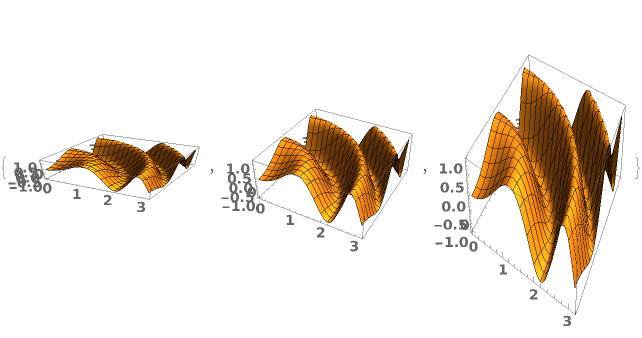
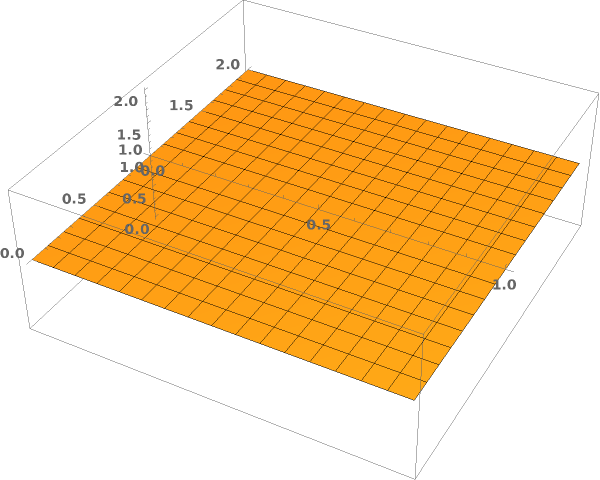
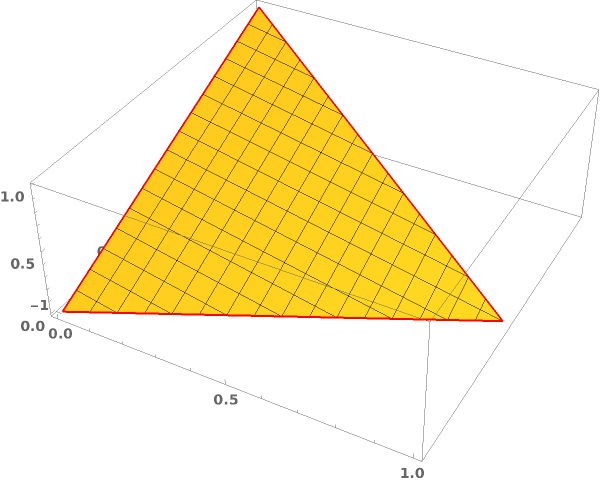
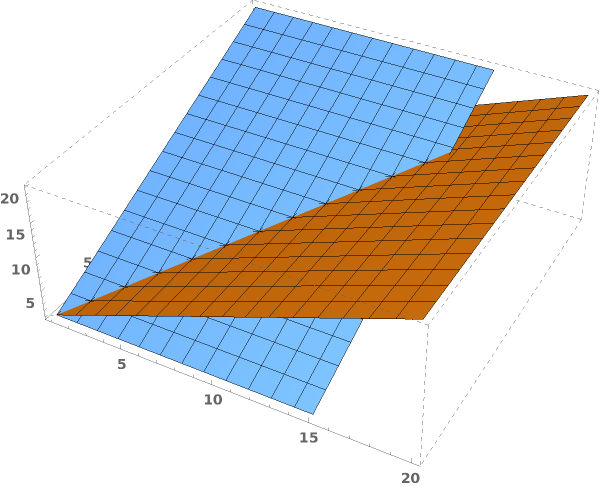
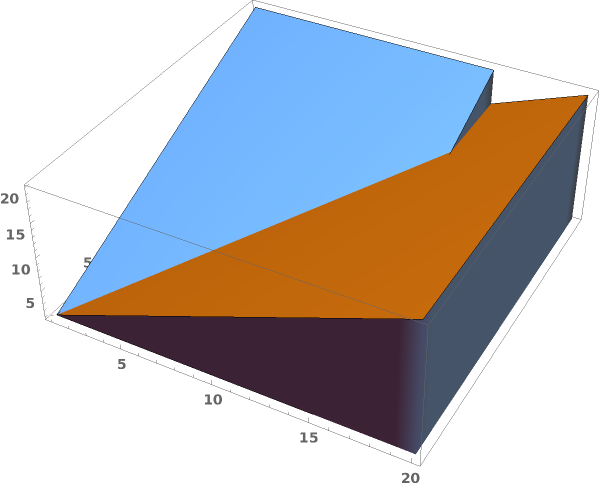
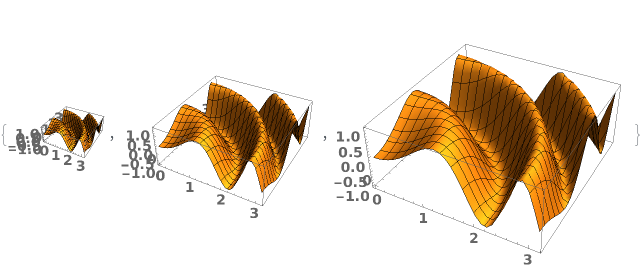
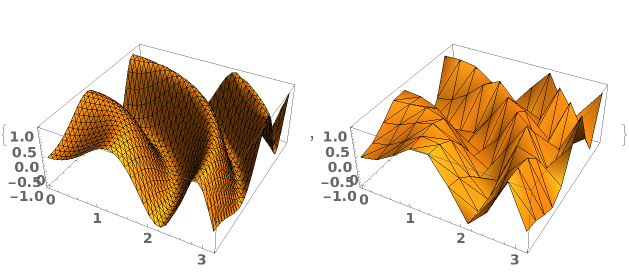
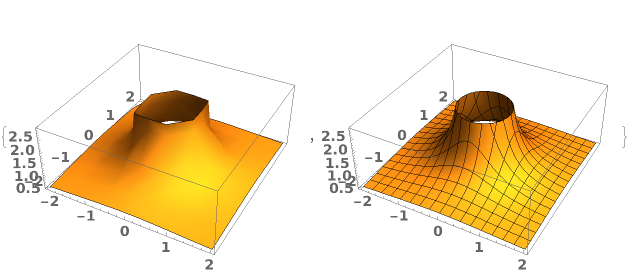
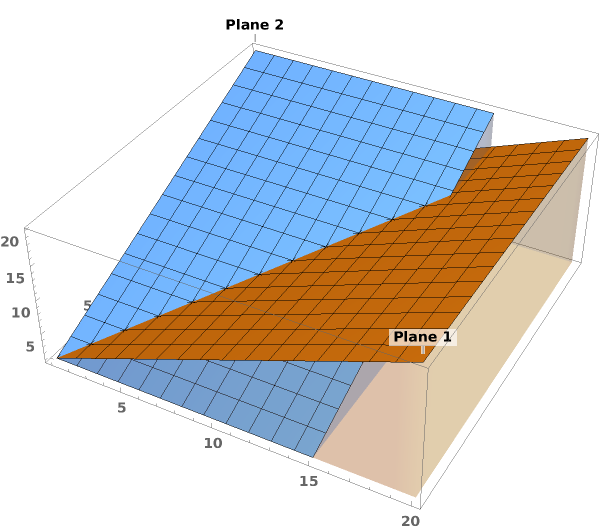
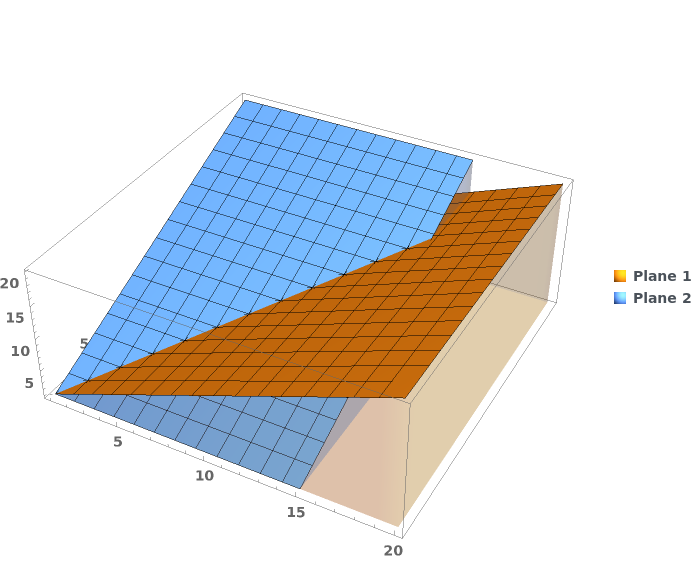
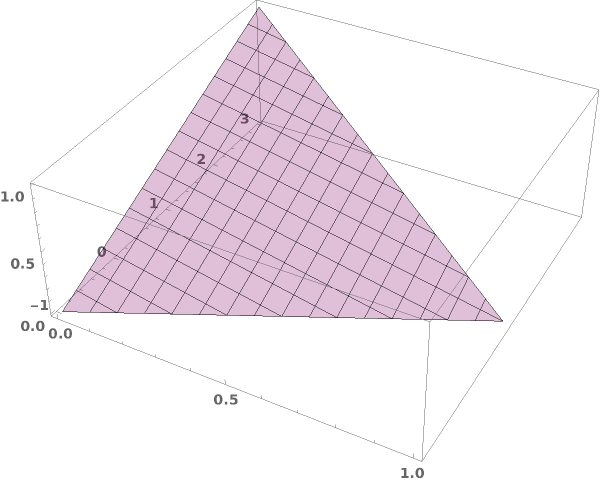
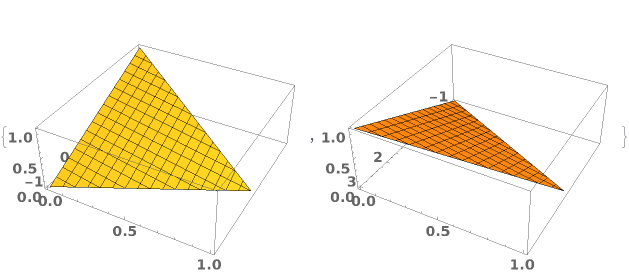
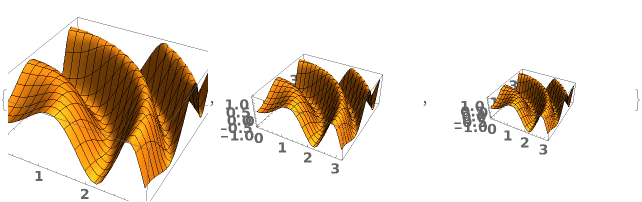
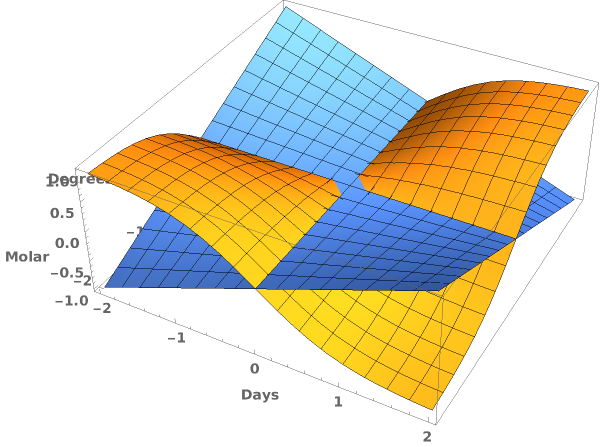
Multiple 3D arrays with compatible units will be converted to the units in the first data set:

Multiple 3D arrays with compatible units will be converted to the units in the first data set:

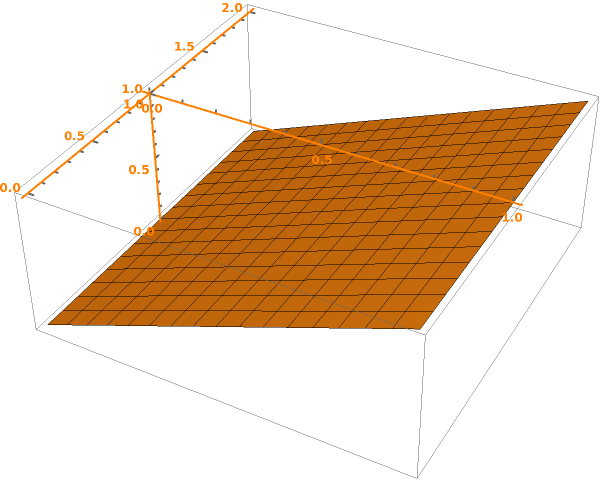
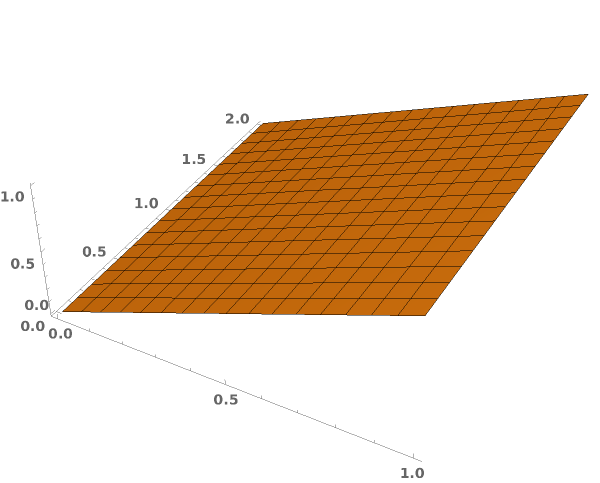
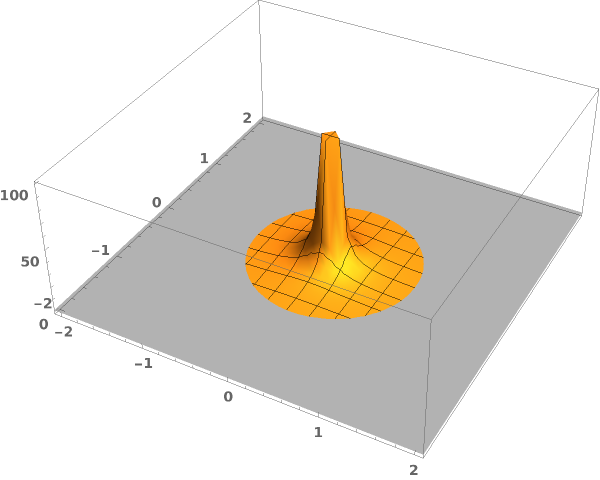
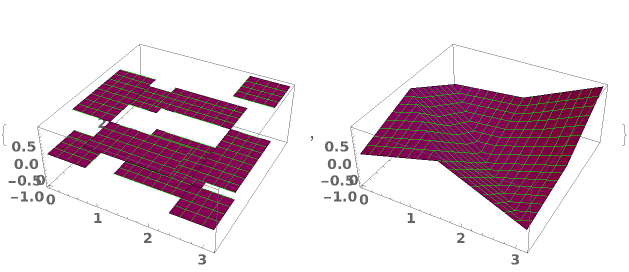
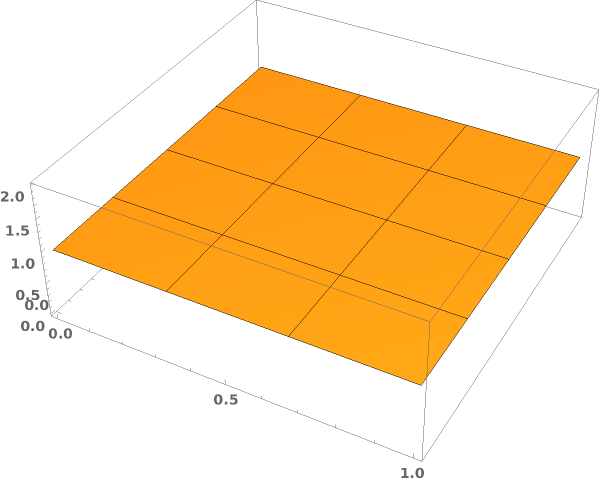
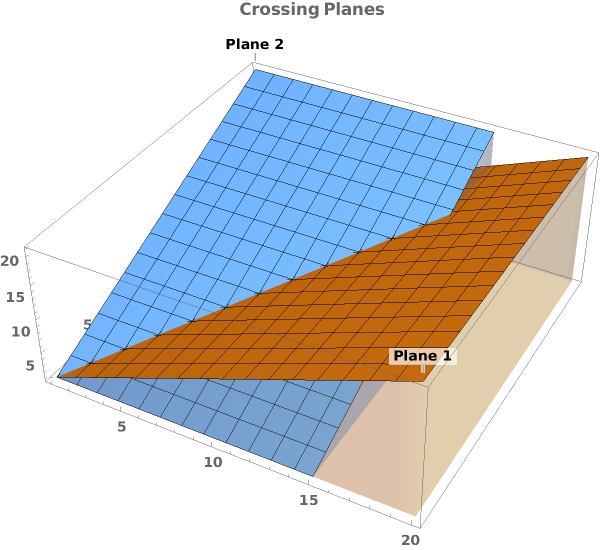
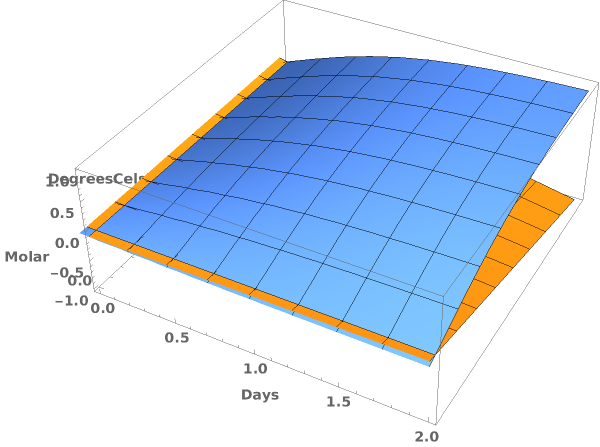
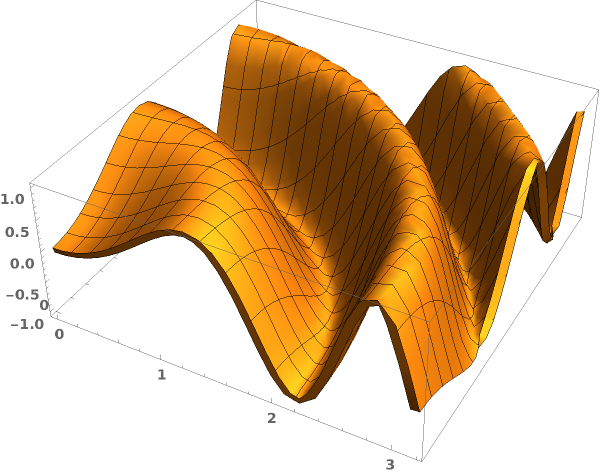
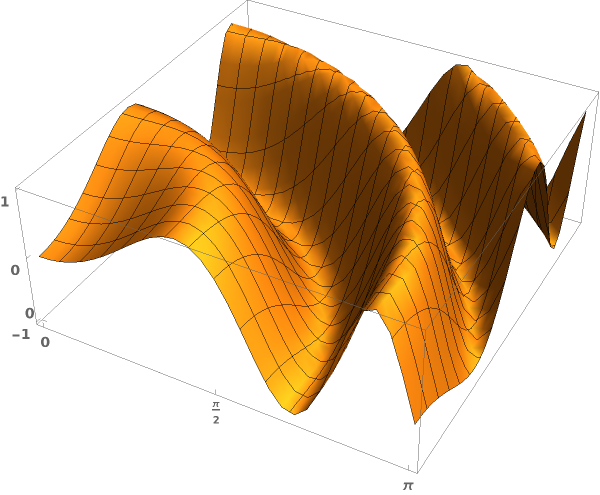
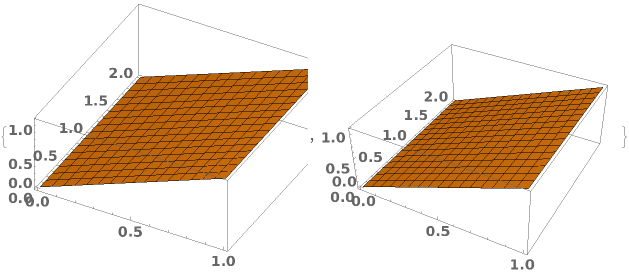
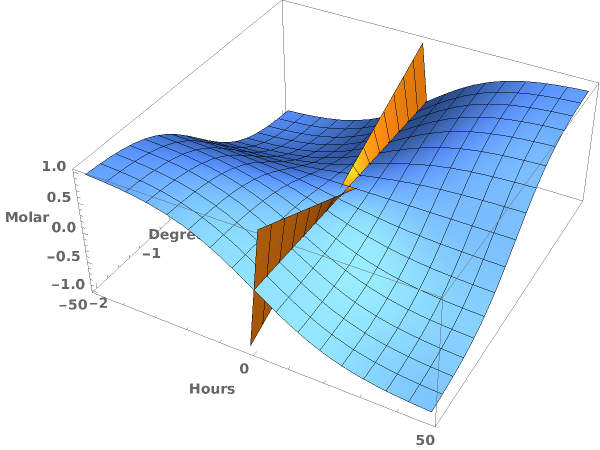
Plot multiple 3D arrays and the first array does not have units will result in a plot without units:

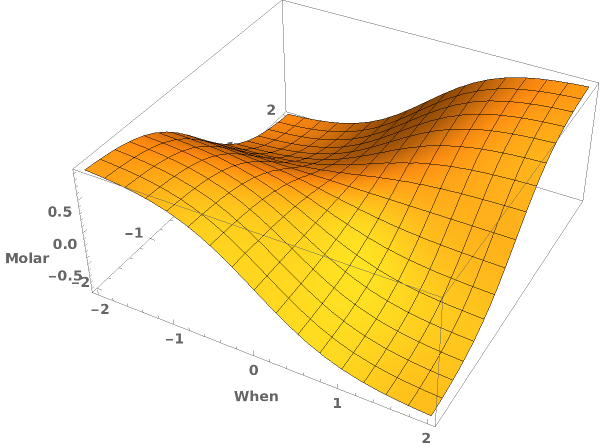
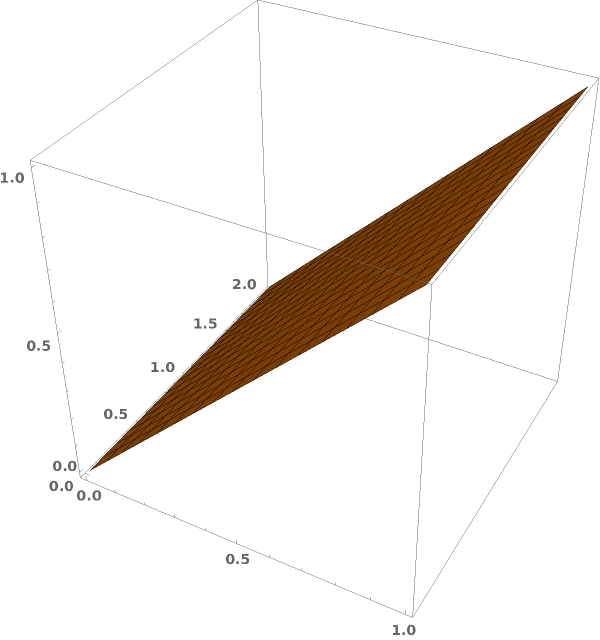
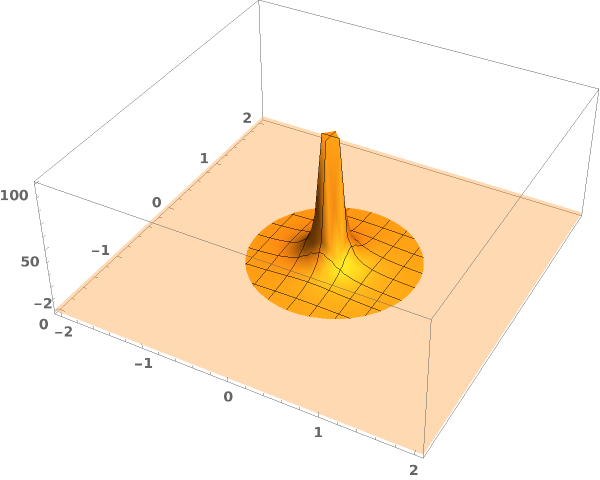
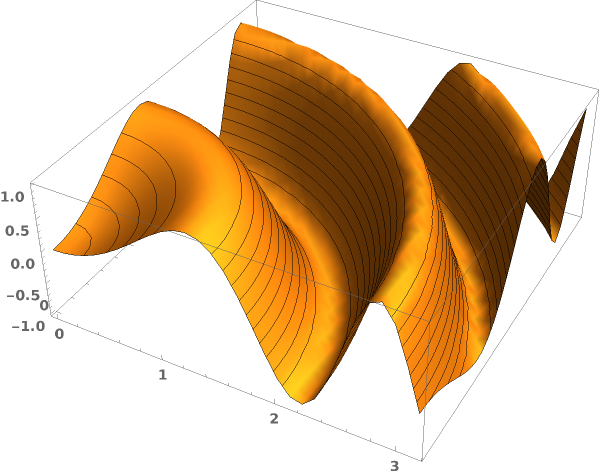
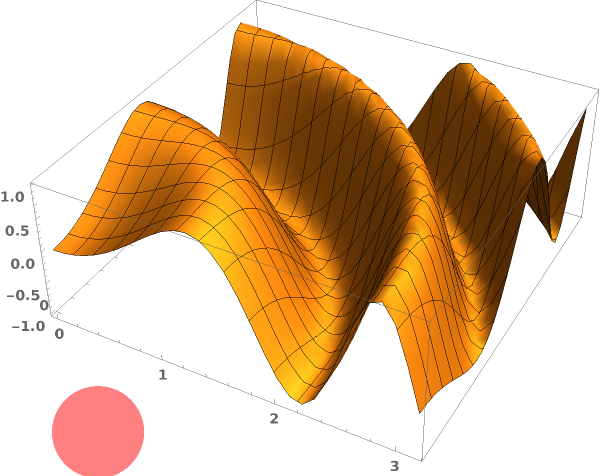
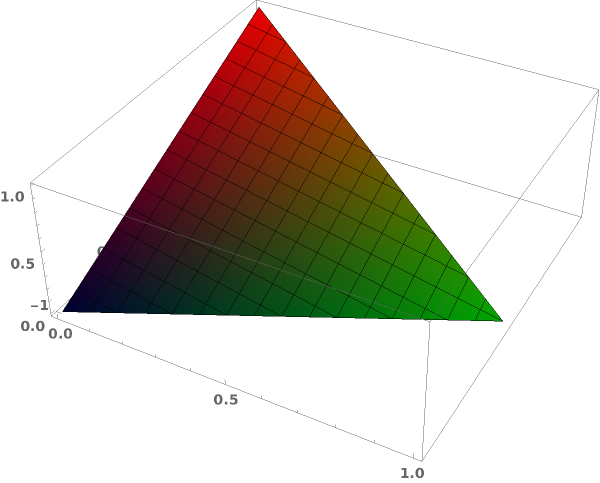
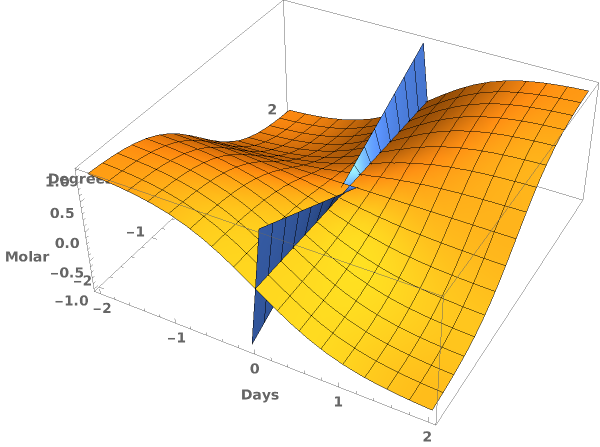
Plot multiple 3D data with and without units results in a plot no units: