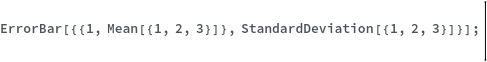
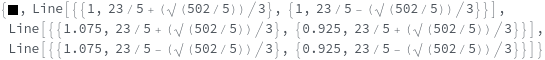
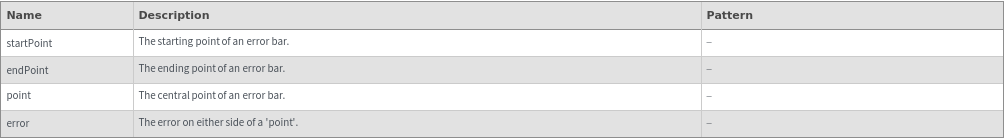
ecl-logo Documentation

ErrorBar

ErrorBar[{point:{(_?NumericQ|DateListP),_?NumericQ},error:(_?NumericQ|DateListP)}]bar_Graphics

provies the graphic representation of an error bar by extending error in either direction from a central point.
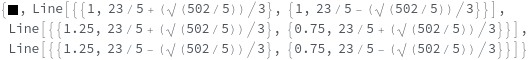
ErrorBar[{startPoint:{(_?NumericQ|DateListP),_?NumericQ},endPoint:{(_?NumericQ|DateListP),_?NumericQ}}]bar_Graphics

provides the graphic representation of an error bar from a given start point to a given end point.

Details

    Input
    Output
    General Options

Examples

Basic Examples  (3)

Draw a vertical Error bar for a list of real numbers according to its mean and standard deviation:

Draw a vertical Error bar for a list of data according to its mean and standard deviation:

The output from ErrorBar can be used to produce a graphic:

Options  (7)

Color  (1)

Change the color of the error bar:

Log  (1)

Draw a vertical Error bar with base of the logrithm changed to 10:

Orientation  (1)

Draw a horizontal Error bar for a list data:

PlotRange  (1)

Draw a vertical Error bar for a list of integers given a specific PlotRange:

PlotType  (1)

Draw a vertical Error bar based on linear log:

Ticks  (1)

Draw a vertical Error bar for a list of integers with a specified size of end mark ticks:

TickUnit  (1)

Change the TickUnit to Minute: