FindPlotRange
FindPlotRange[rawPlotRange, plotData]⟹range
calculates a plot range from plotData.


Examples
Basic Examples (3)


Additional Examples (7)
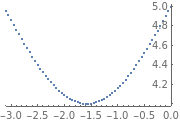
Automatic plot range shows all the data:

Automatic is the same as All if there are no other constraints:

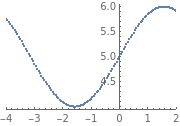
To see all the data and the x-Axis use PlotRange{All, Full}:

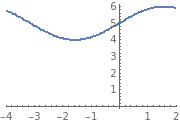
Automatic will be constrained by other values:

Calculate Automatic plot range for X coordinates:


If only one one coordinate is set to Automatic it will be constrained by the other values:


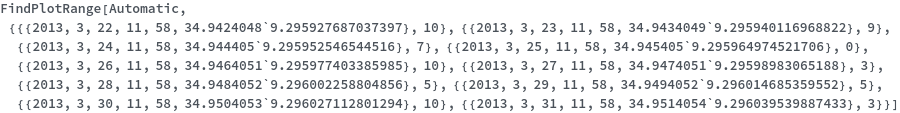
Can be used on DateCoordinateP: