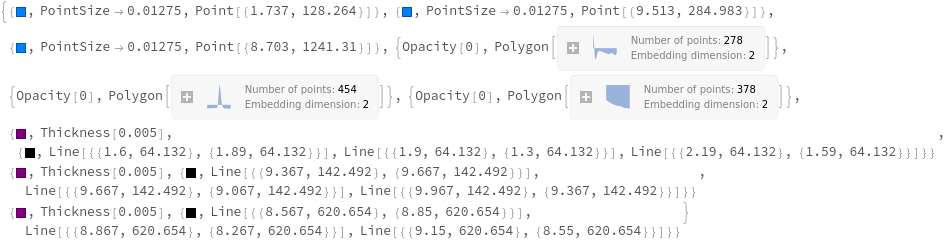
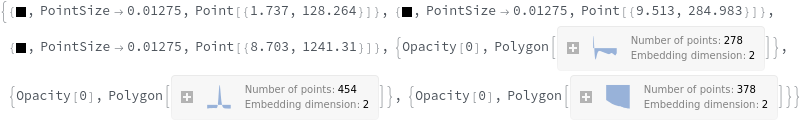
ecl-logo Documentation

PeakEpilog

PeakEpilog[plotData,peakData]epilog_Graphics

generates an epilog graphic for denoting the information derived from peaks.

Details

    Input
    Output
    Data Specifications Options
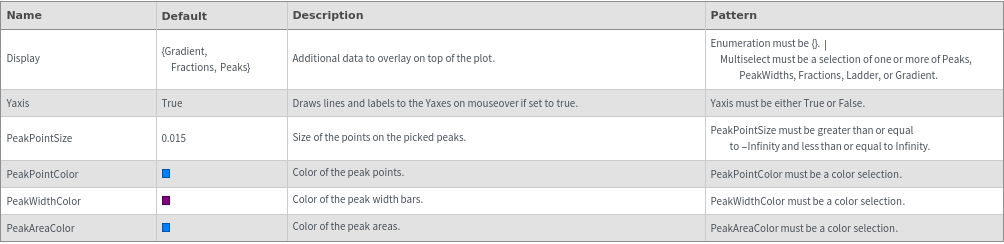
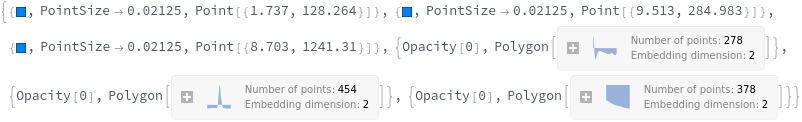
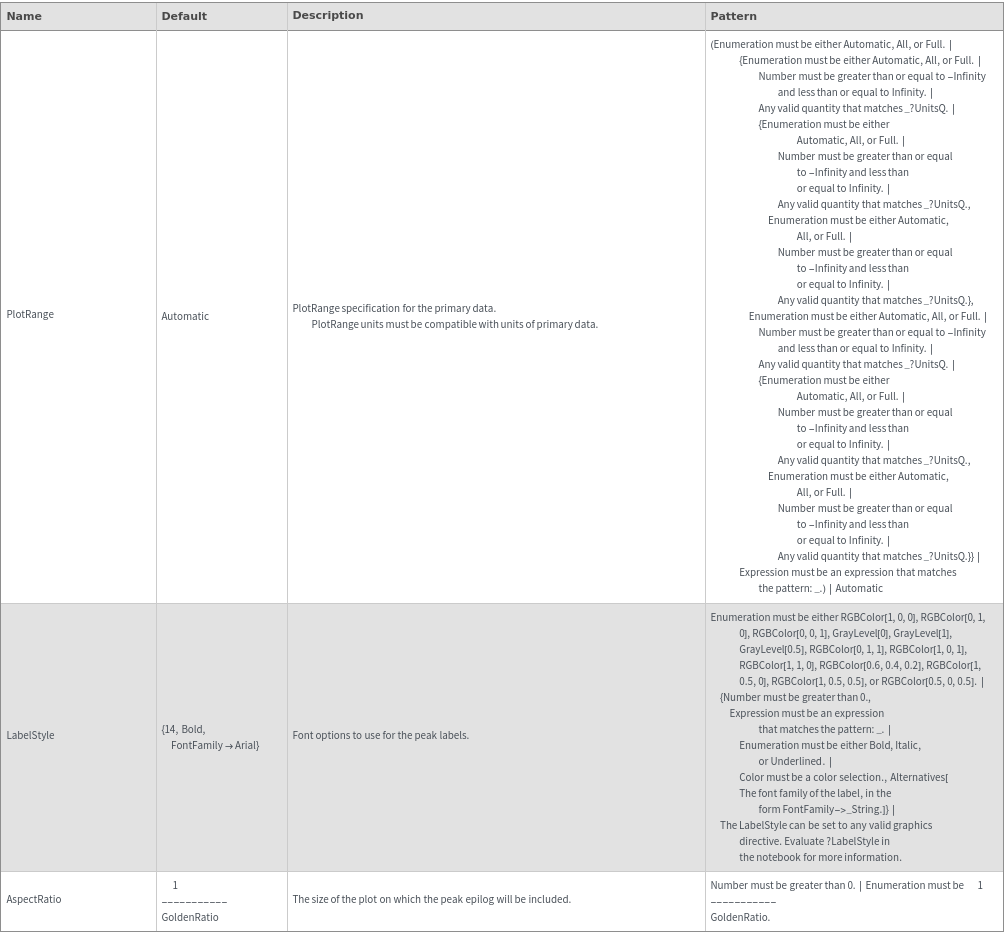
    Plot Style Options

Examples

Basic Examples  (1)

Provides mouseover details about the peaks:

Options  (12)

AspectRatio  (1)

Change the aspect ratio of the epilog:

Display  (1)

Specifies Peaks and Peak Widths will be displayed:

LabelStyle  (1)

Change the style of the peak labels:

PeakAreaColor  (1)

Change the color of the peak areas:

PeakPointColor  (1)

Change the color of the peak points:

PeakPointSize  (1)

Change the size of the points on the peaks:

PeakWidthColor  (1)

Change the color of the peak width bars:

PlotRange  (1)

Specifies the range of the plot on which the peaks will be displayed:

Reflected  (1)

Reflects the peaks about the X-axis:

SecondYScaled  (1)

Specifies if the data on the second Y axis is scaled:

SecondYUnscaled  (1)

Specifies if the data on the second Y axis is unscaled:

Yaxis  (1)

Don't draw lines and labels on mouseover: