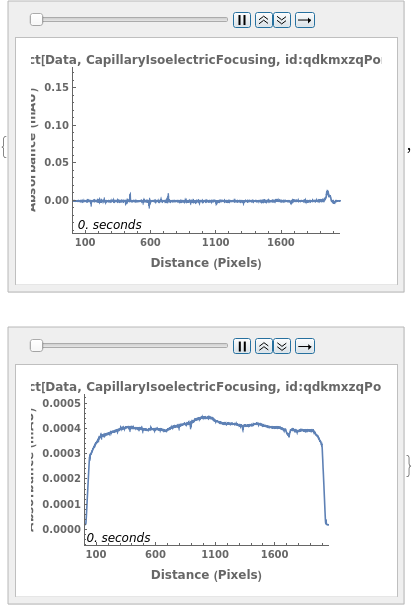
PlotCapillaryIsoelectricFocusingEvolution
PlotCapillaryIsoelectricFocusingEvolution[dataObject]⟹plot
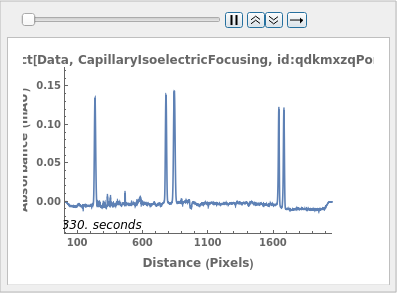
generates a graphical plot of the separation evolution data stored in a CapillaryIsoelectricFocusing data object.
PlotCapillaryIsoelectricFocusingEvolution[chromatograph]⟹plot
generates a graphical plot of the provided CapillaryIsoelectricFocusing separation data over time.
Details
Input
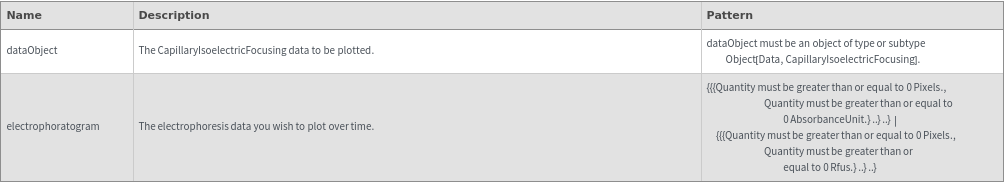
Output

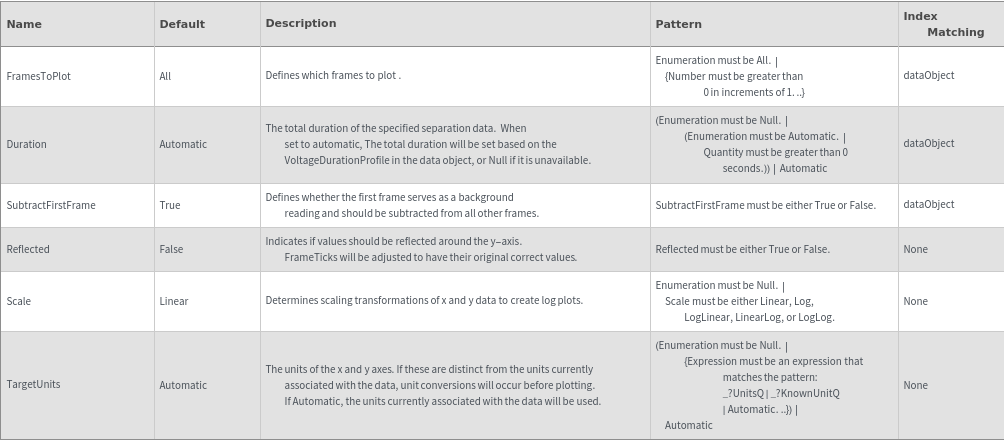
Data Specifications Options
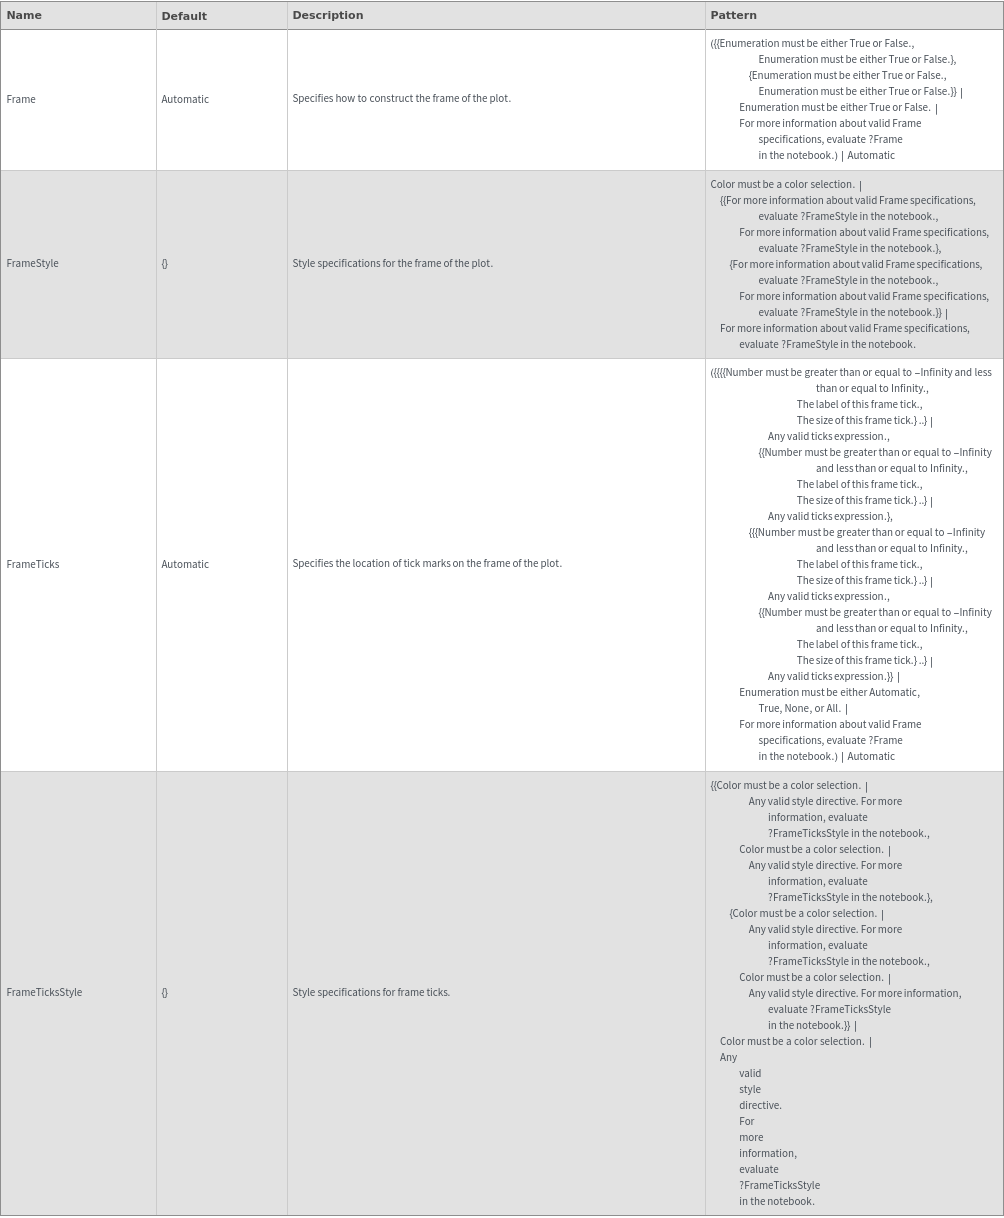
Frame Options
Grid Options
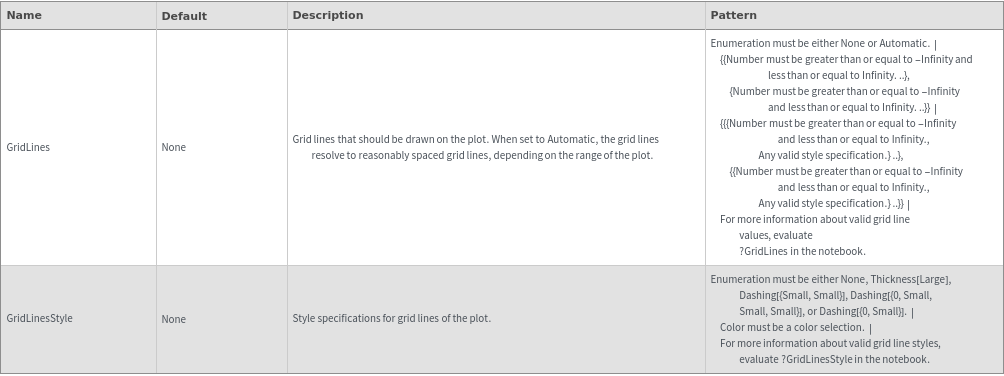
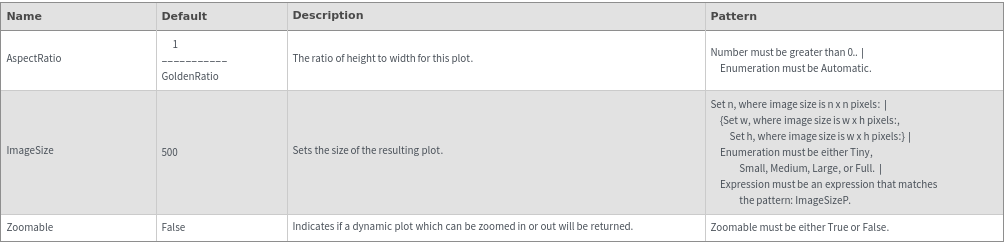
Image Format Options
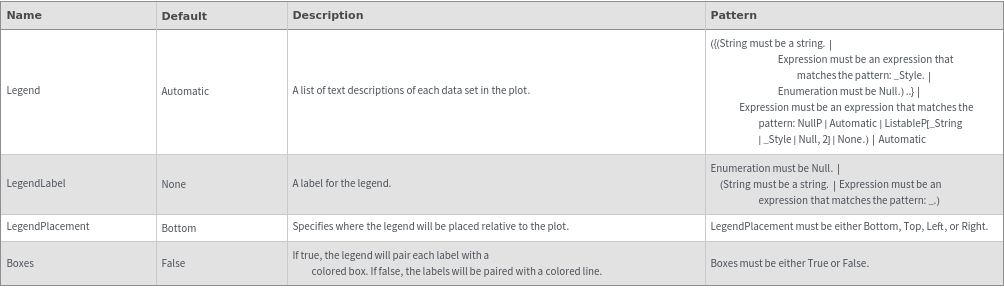
Legend Options
Output Options

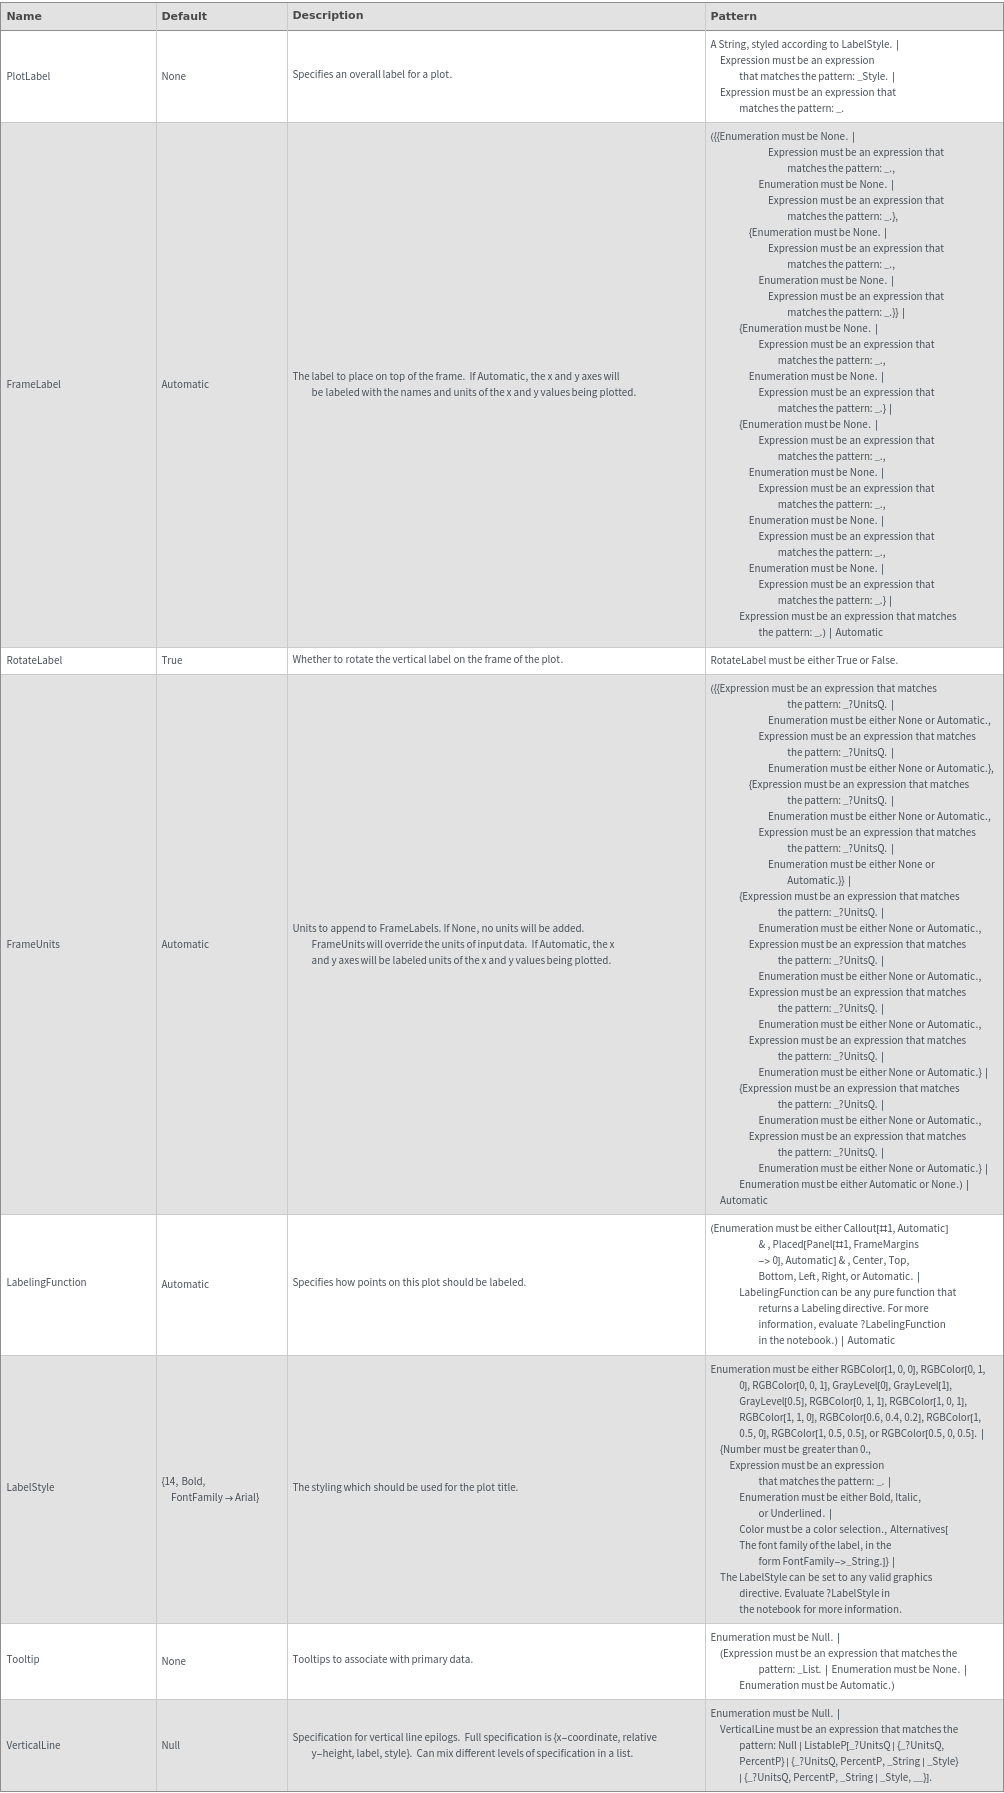
Plot Labeling Options
Plot Range Options
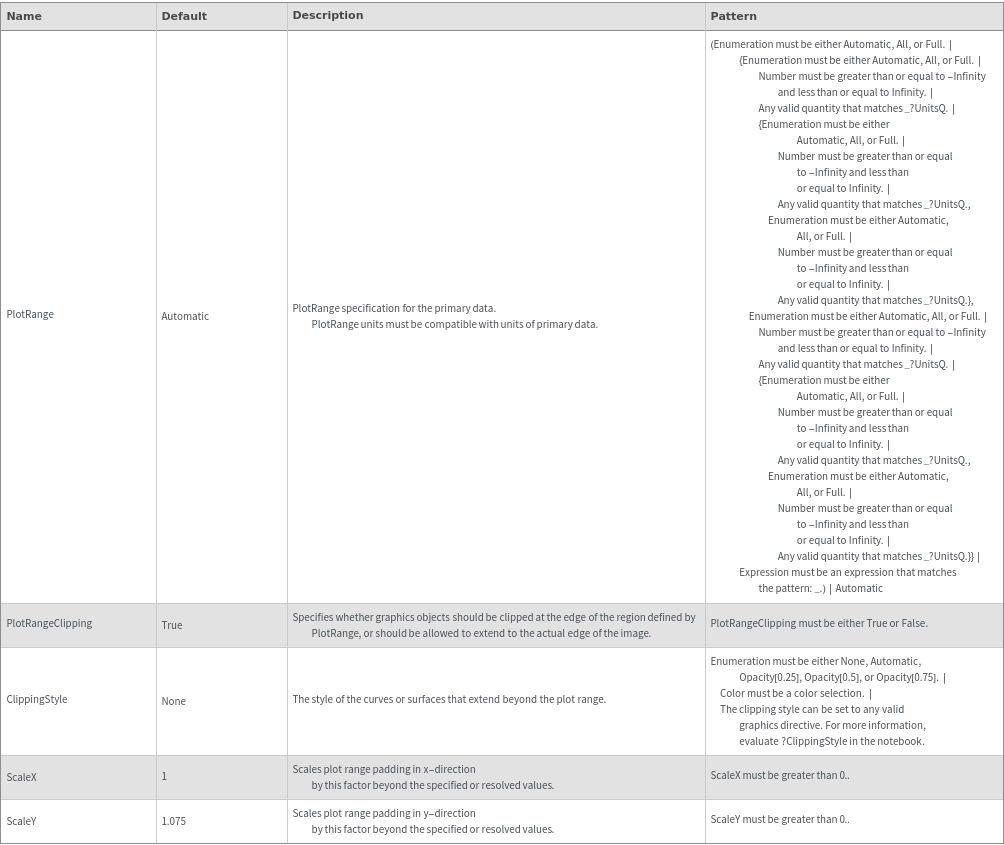
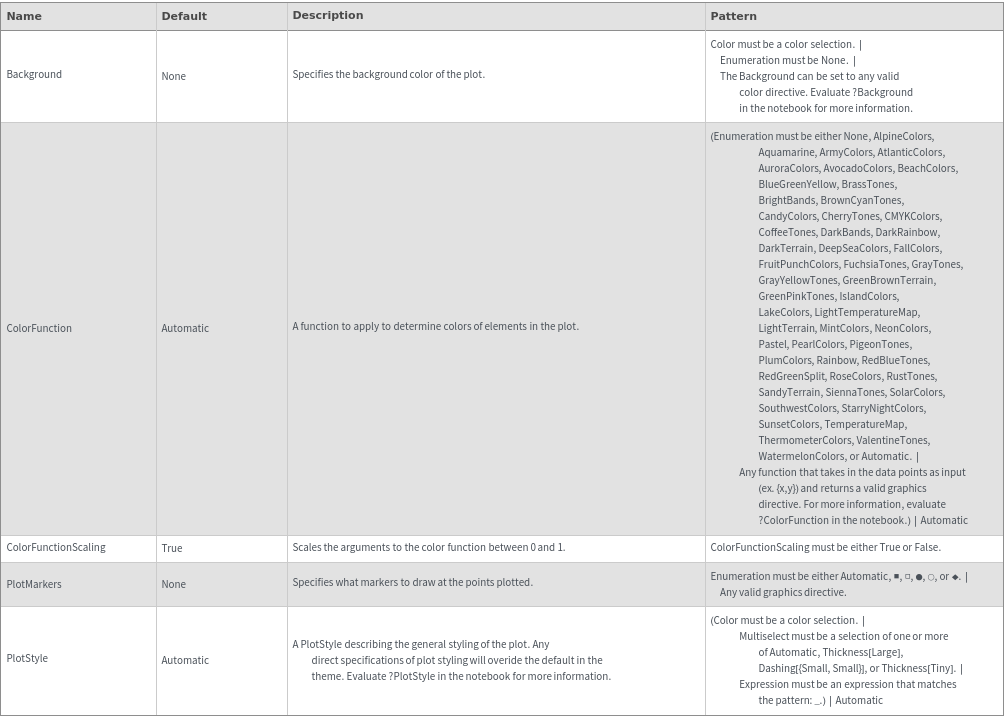
Plot Style Options
General Options
Examples
Basic Examples (4)
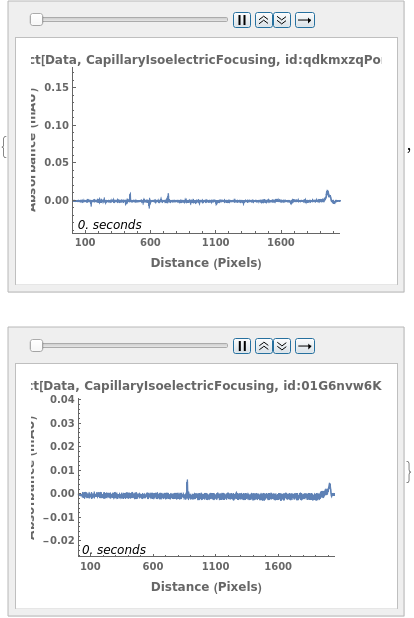
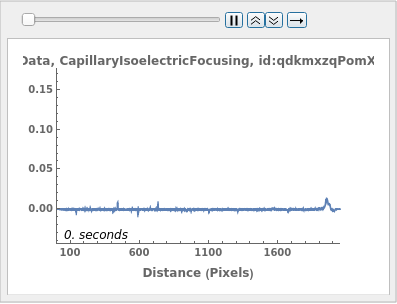
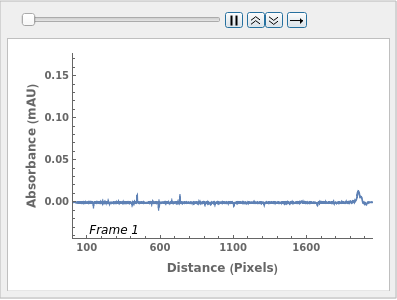
Plots capillary isoelectric focusing separation data when given an CapillaryIsoelectricFocusing data object:

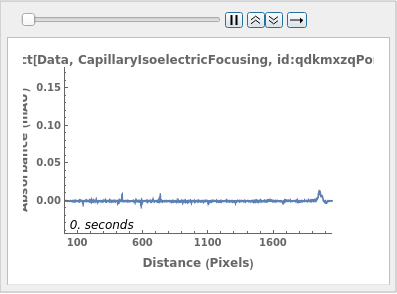
Plots capillary isoelectric focusing separation data when given an CapillaryIsoelectricFocusing data link:

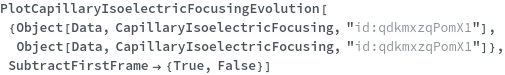
Plots capillary isoelectric focusing separation data when given a list of XY coordinates representing the trace:

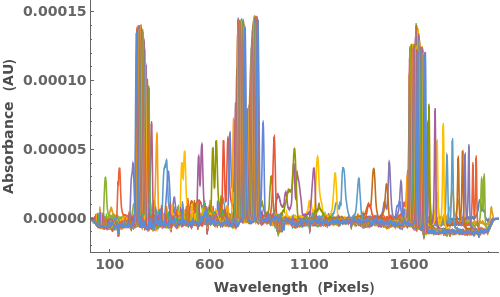
Plots multiple sets of separation data: