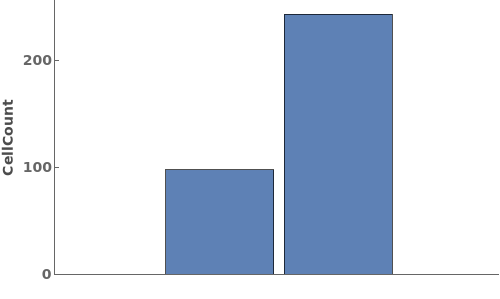
PlotCellCount
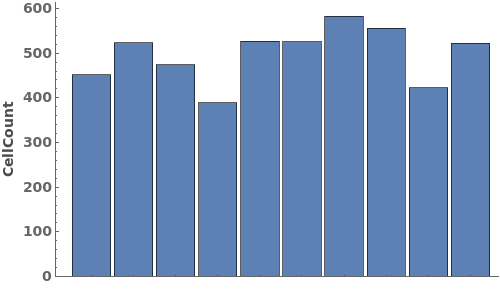
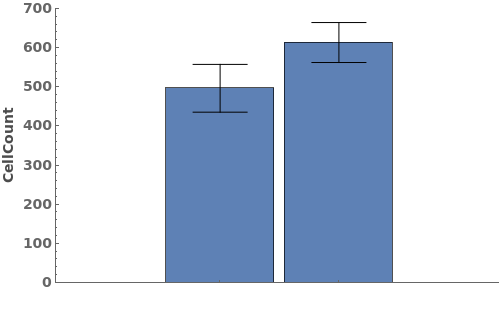
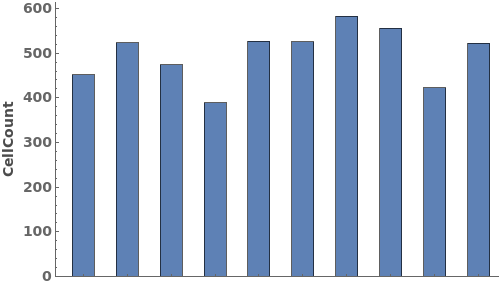
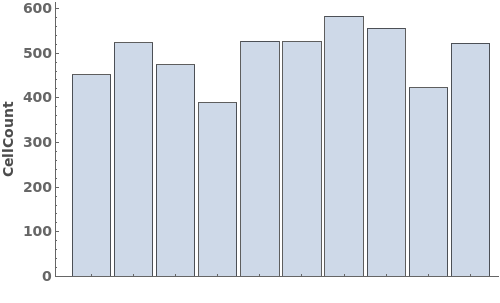
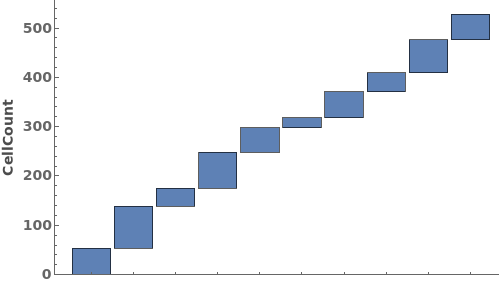
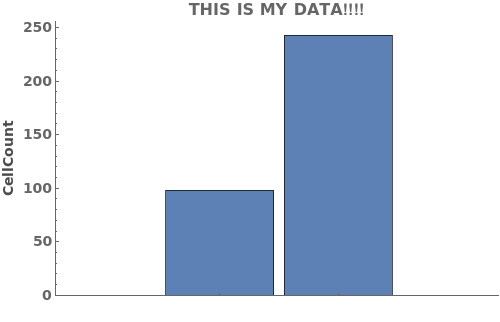
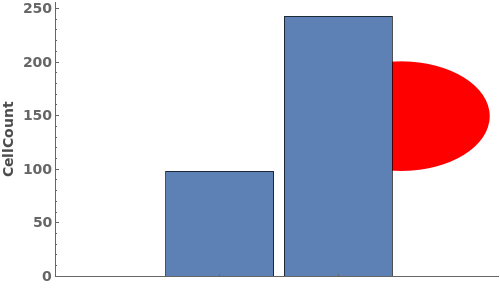
PlotCellCount[cellCounts]⟹plot
generates a graphical representation of the number of cells in cellCounts.
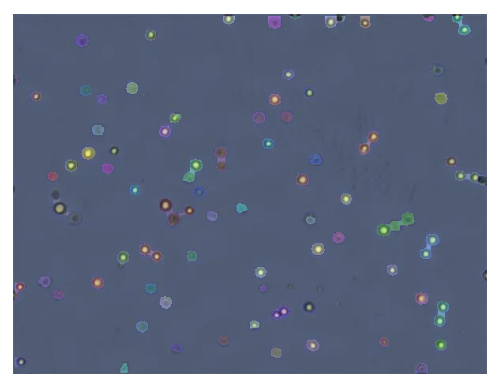
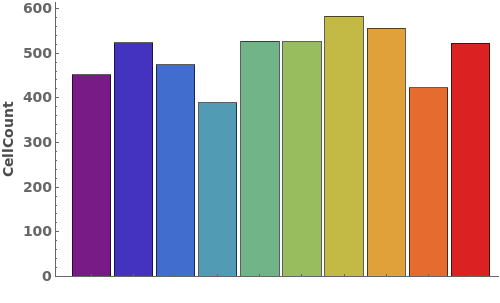
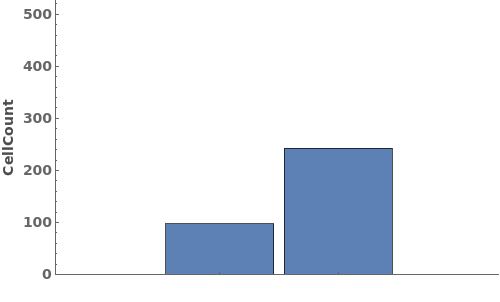
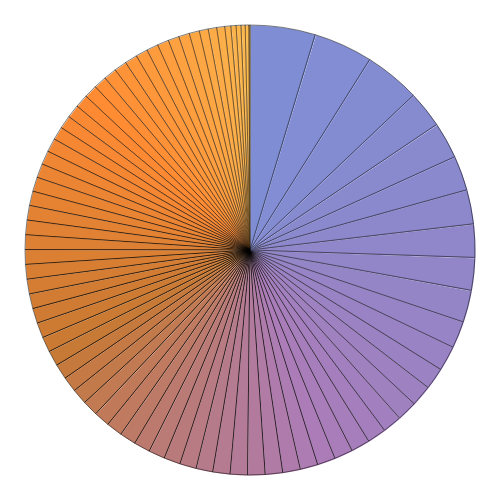
PlotCellCount[microscopeData]⟹plot
generates a graphical representation of the number of cells in microscopeData.
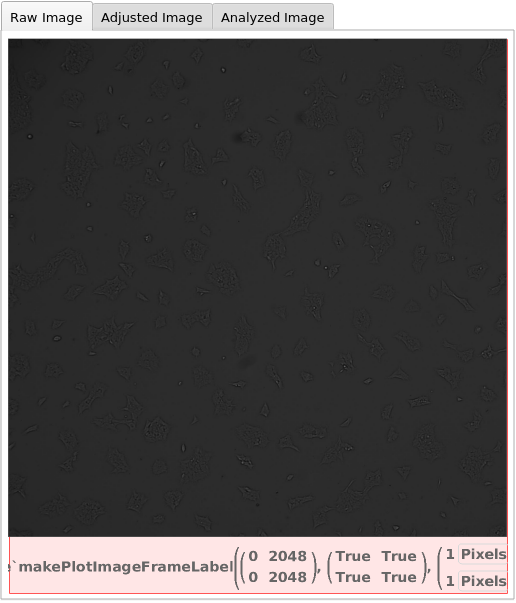
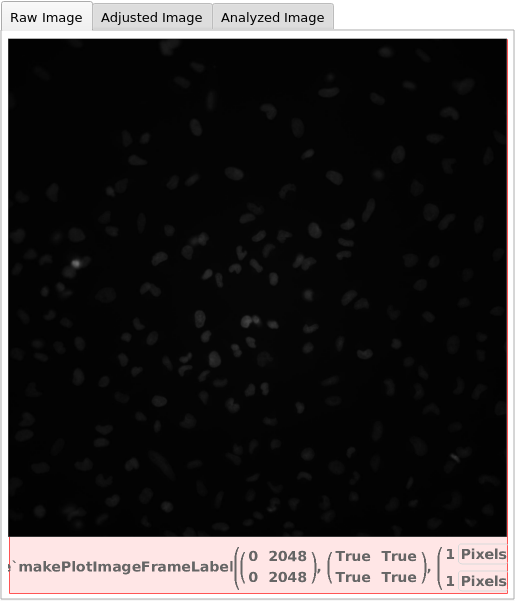
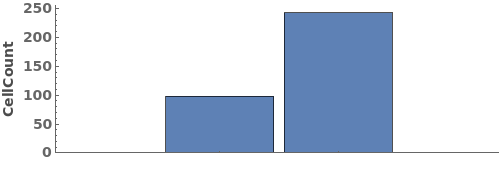
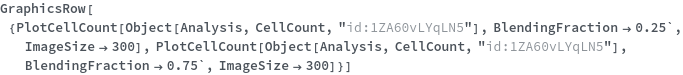
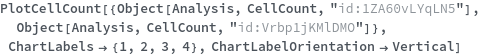
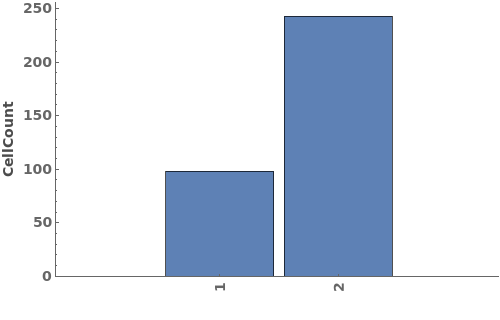
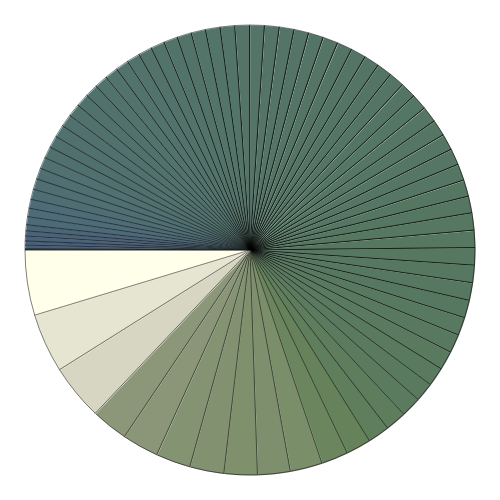
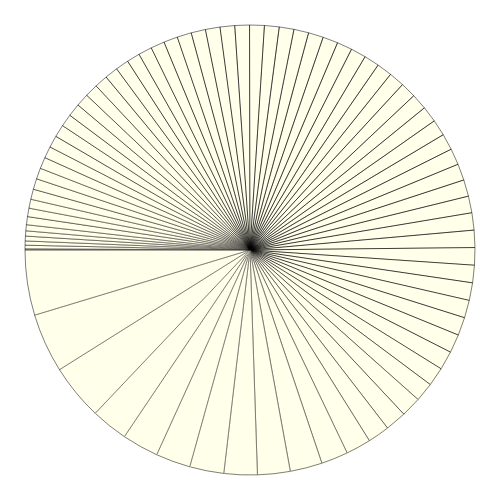
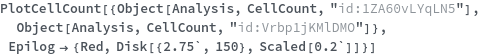
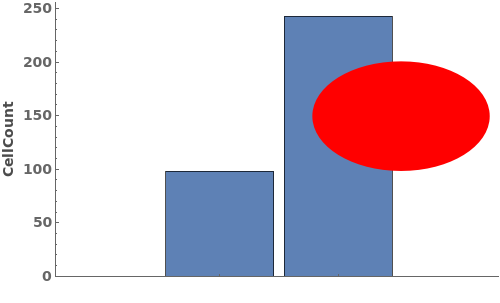
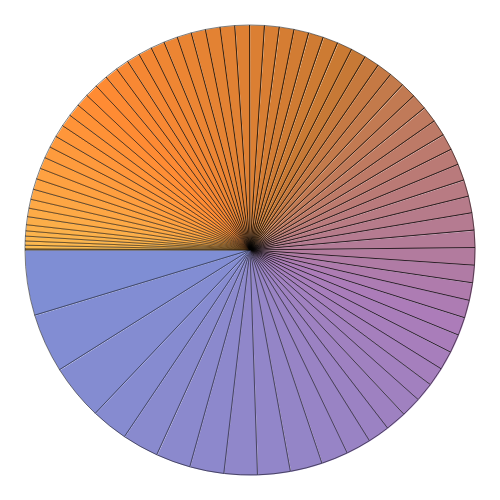
PlotCellCount[image, components]⟹plot
generates a graphical representation of the number of cells in image.
Details
-
imageNotFound No image was found in this packet. NoCounts One or more of your inputs does not have calculated cell counts. Please use AnalyzeCellCount to count the cells for your image or exclude your image from plotting if no cells can be counted.
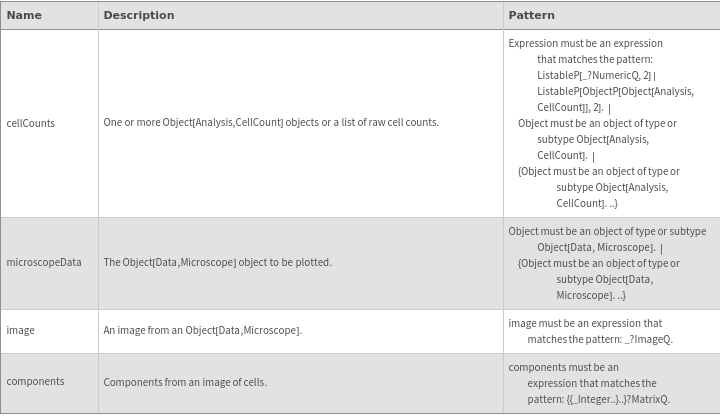
Input
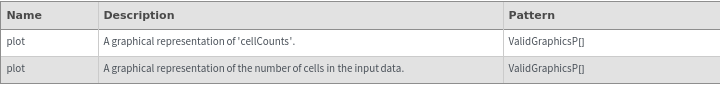
Output
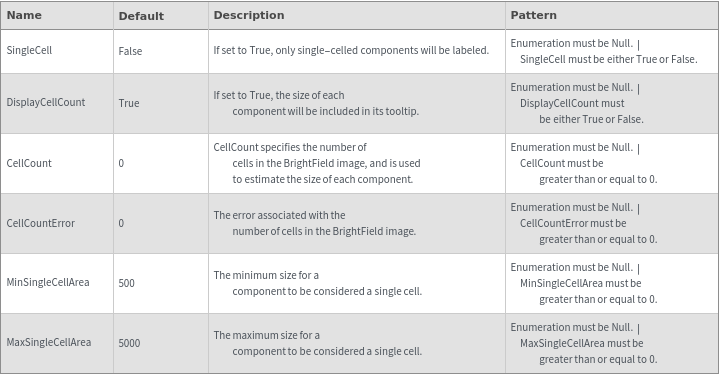
Data Specifications Options
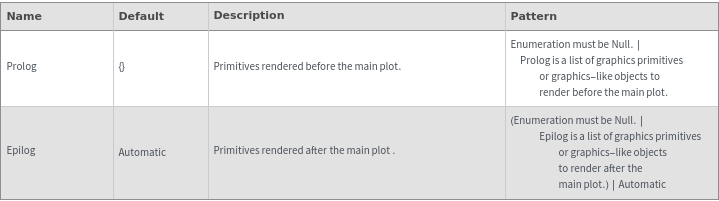
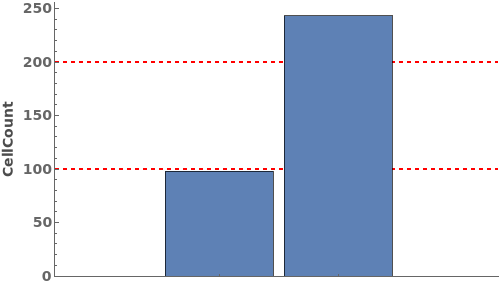
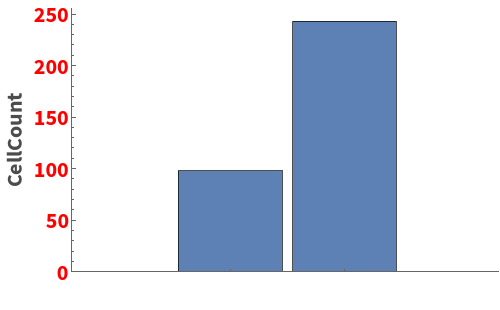
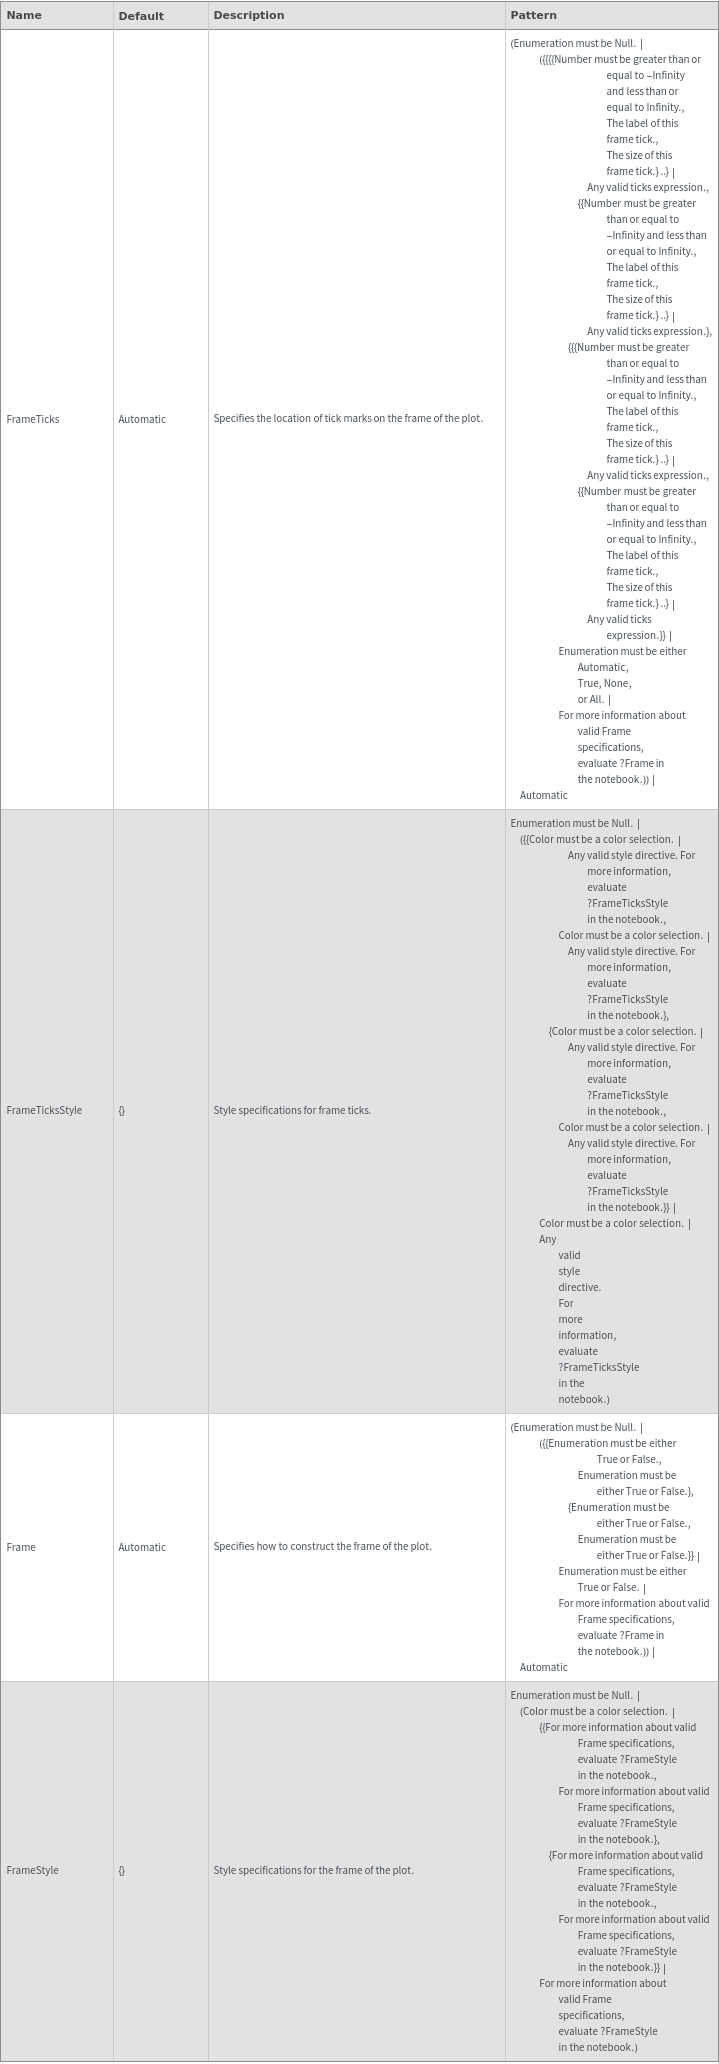
Frame Options
Grid Options
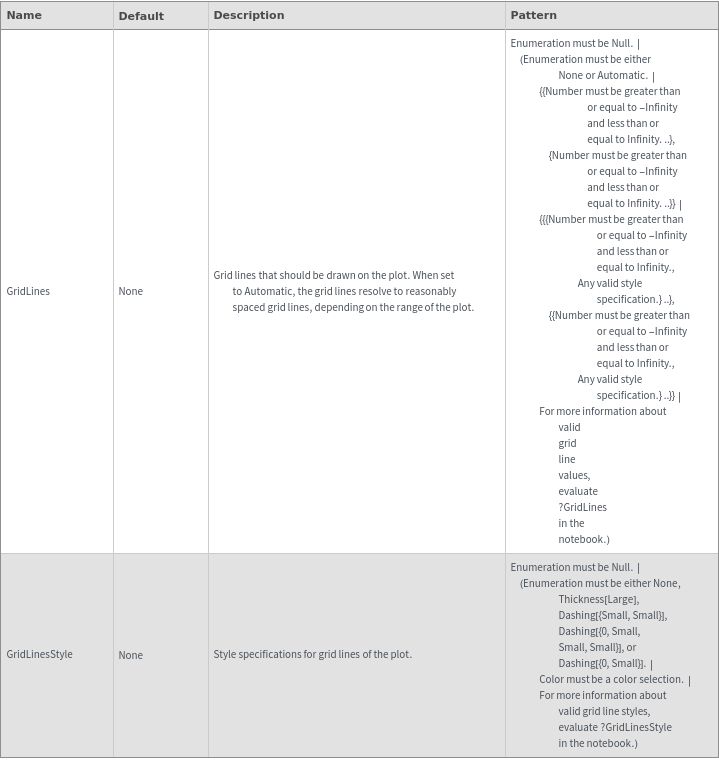
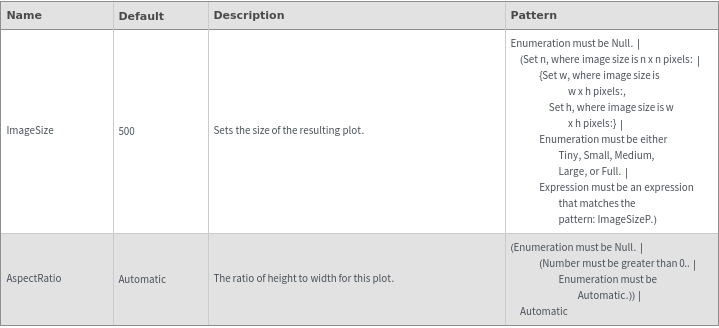
Image Format Options
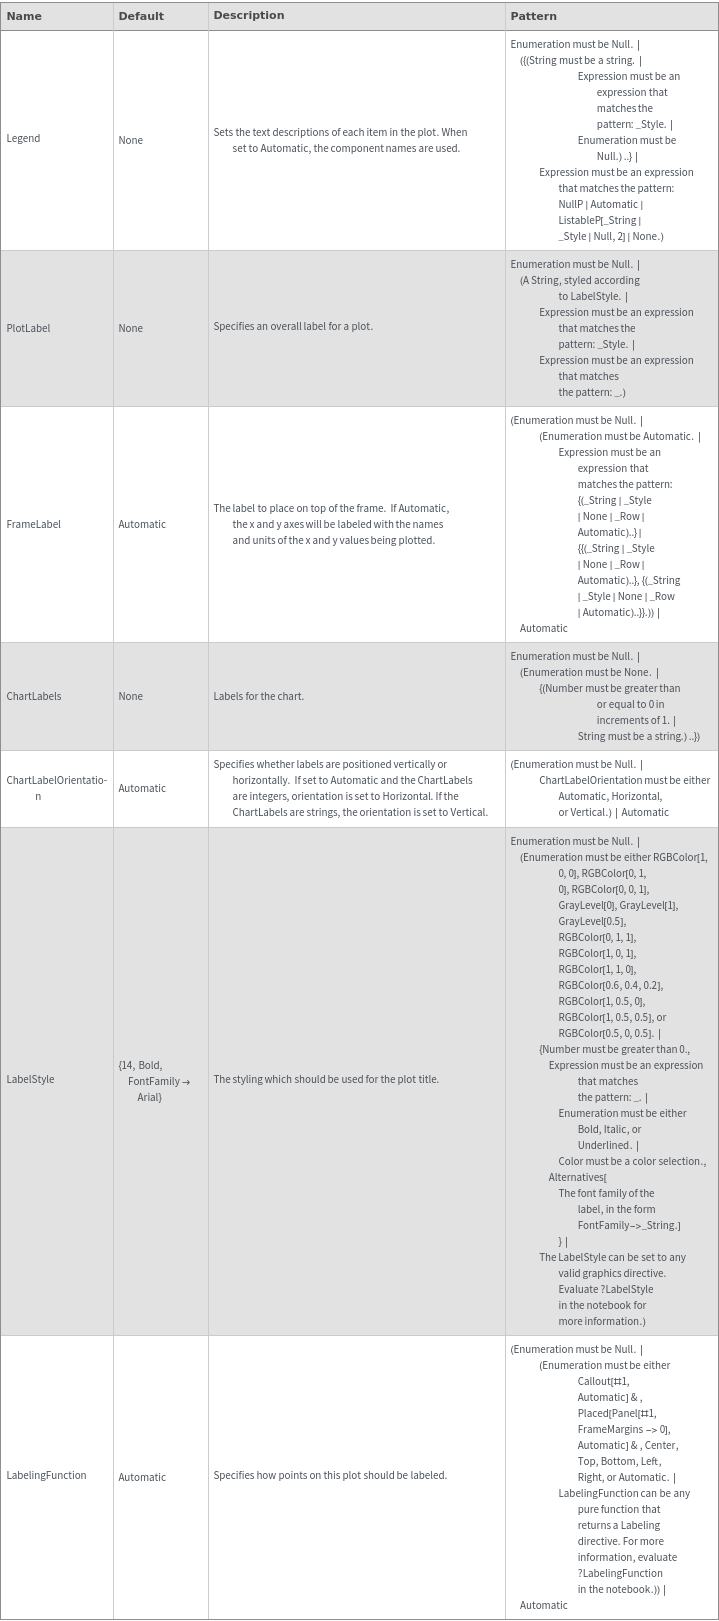
Plot Labeling Options
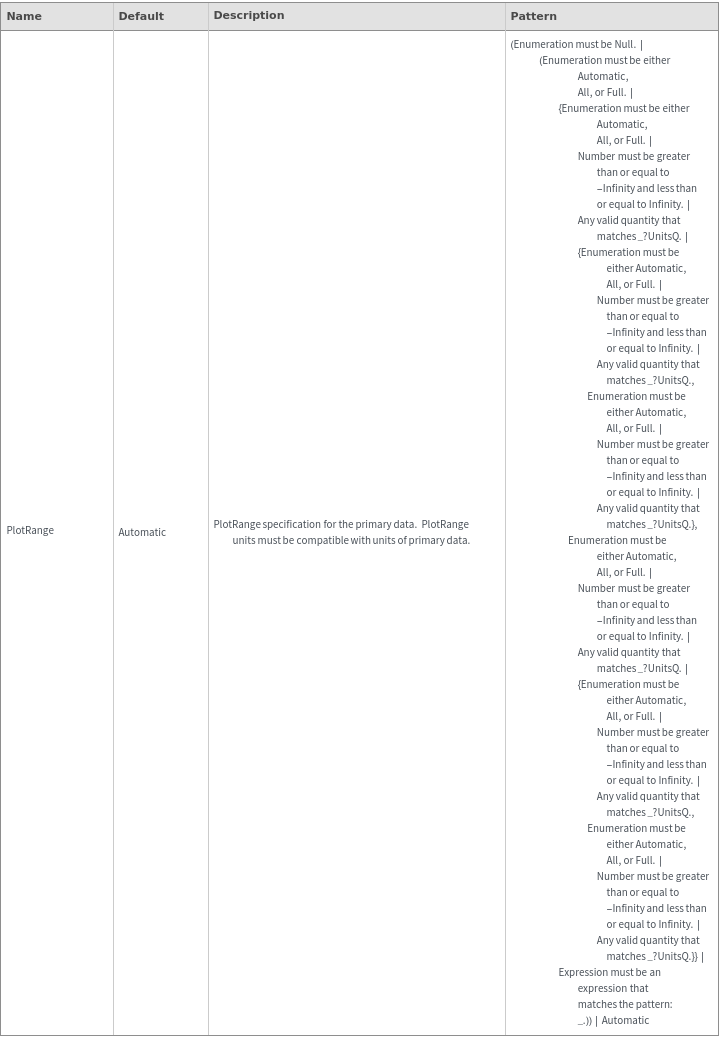
Plot Range Options
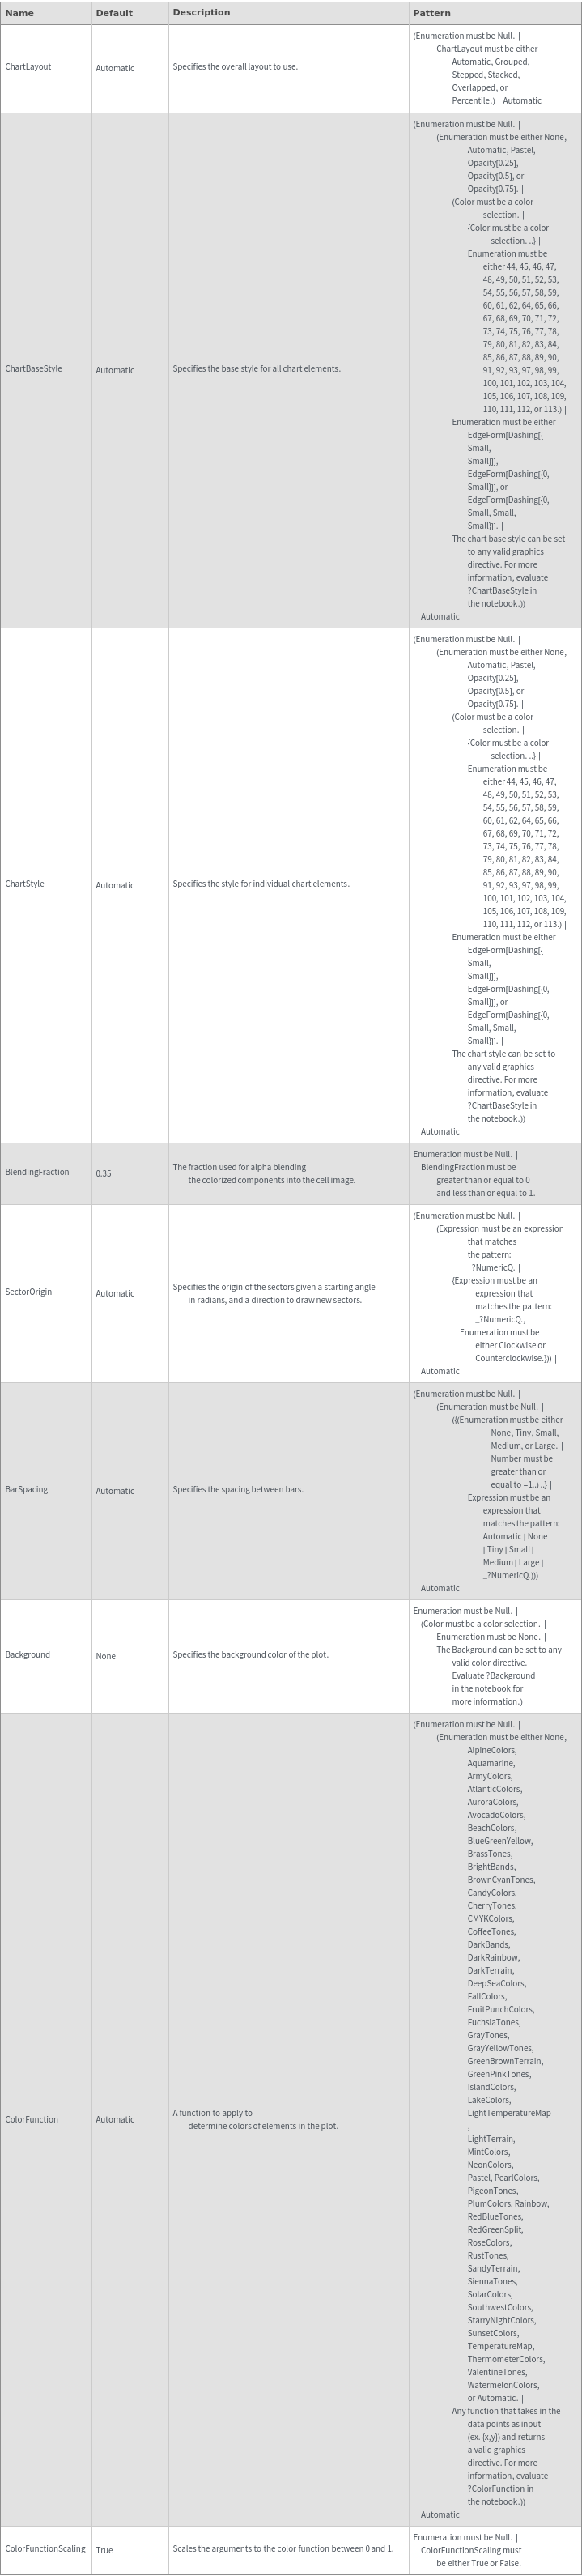
Plot Style Options
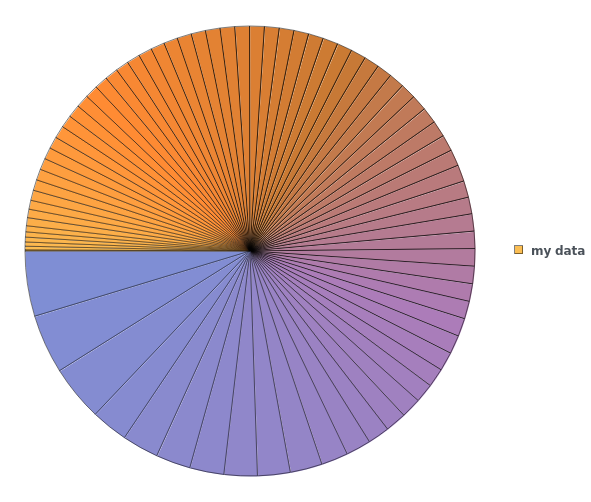
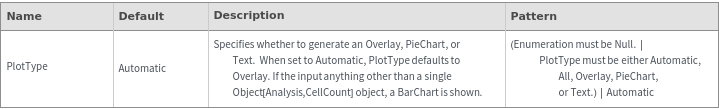
Plot Type Options
General Options