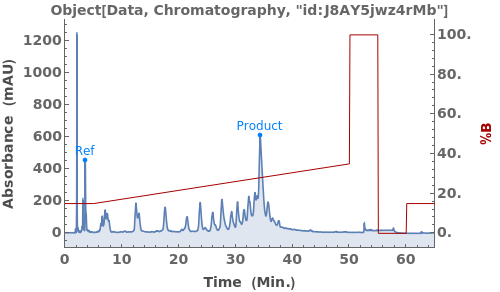
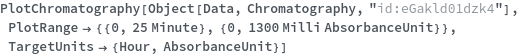
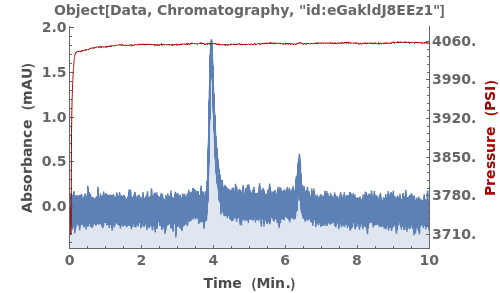
PlotChromatography
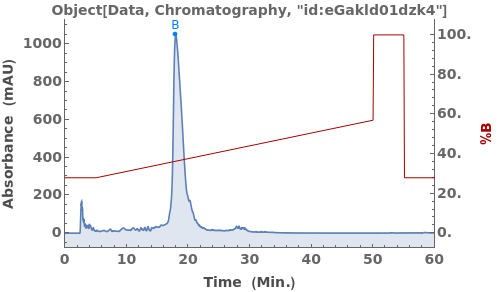
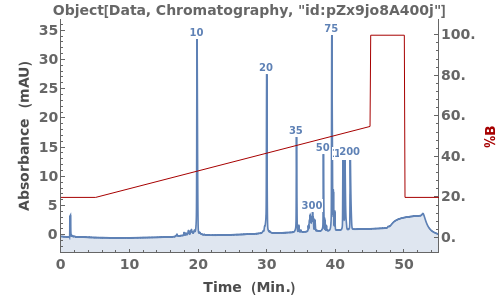
PlotChromatography[dataObject]⟹plot
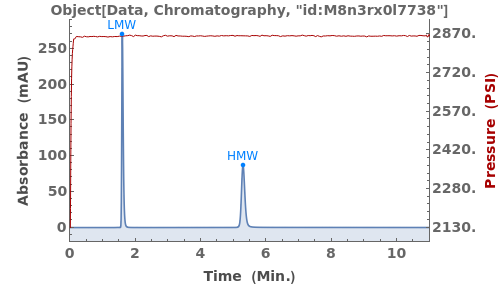
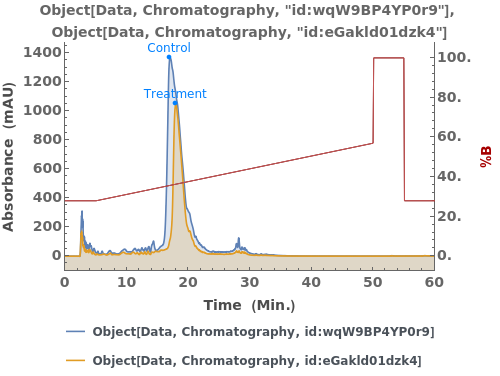
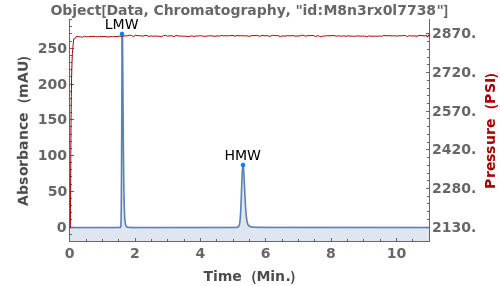
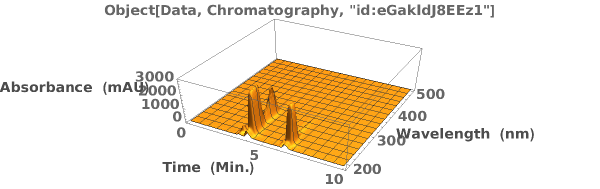
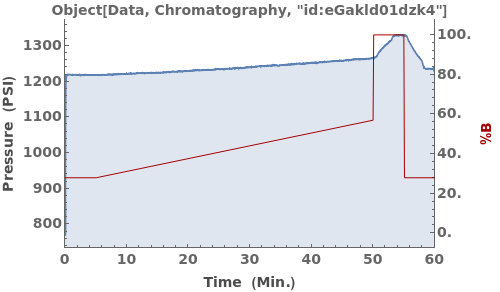
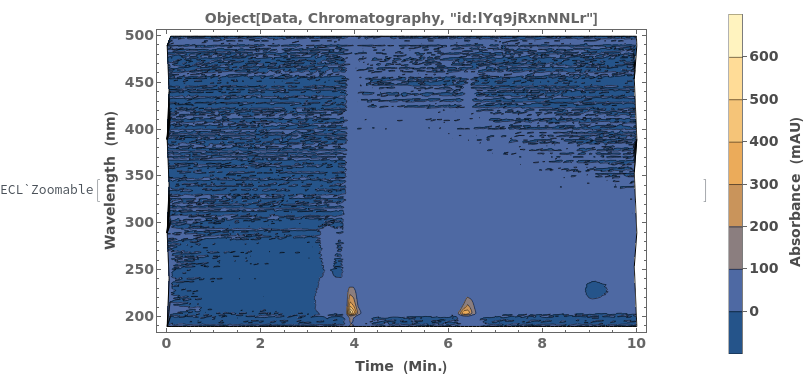
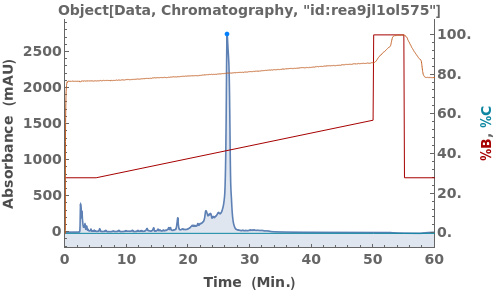
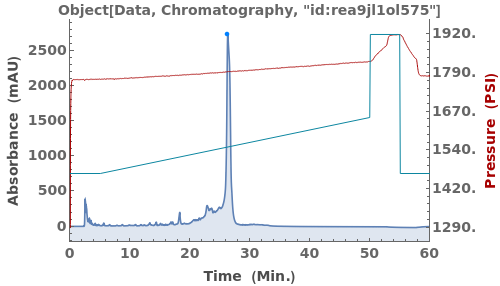
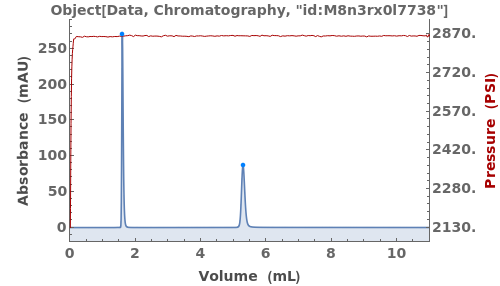
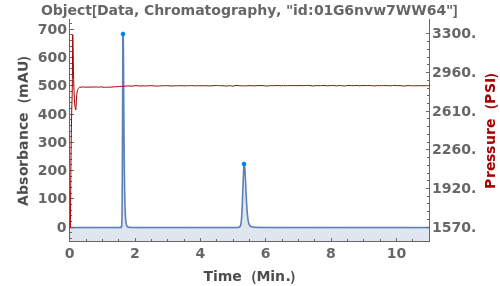
provides an interactive plot of the data in the chromatography object.
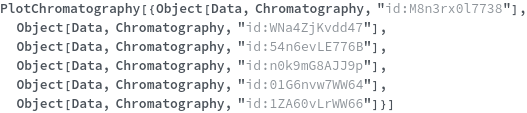
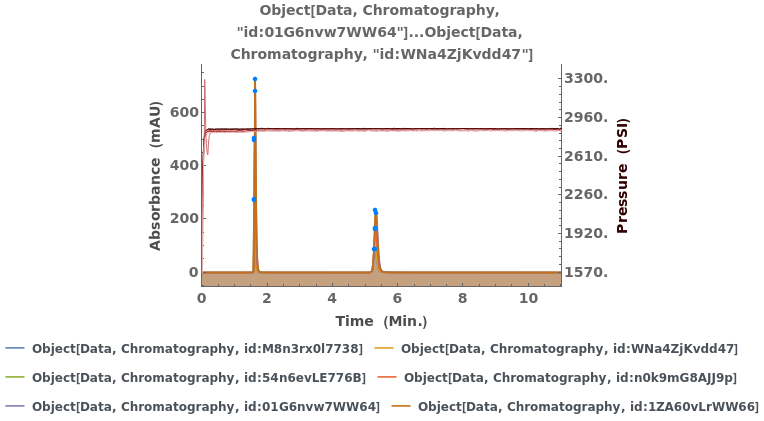
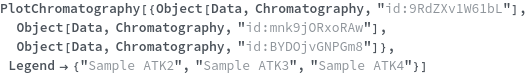
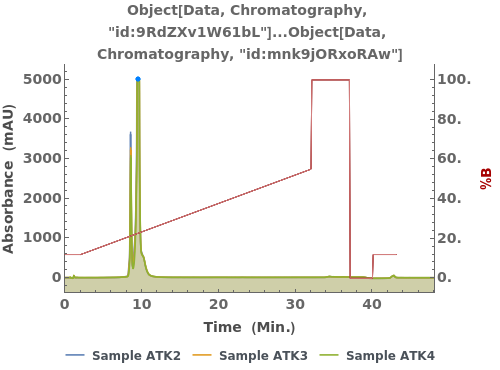
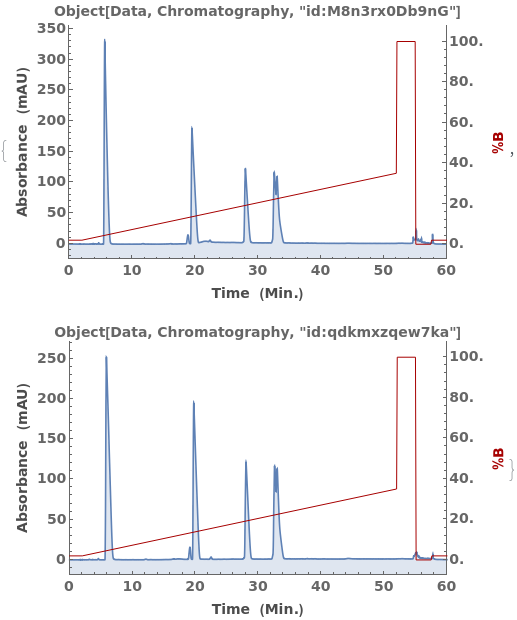
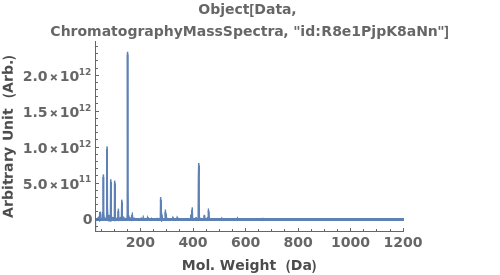
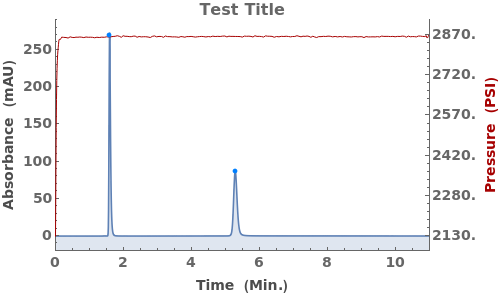
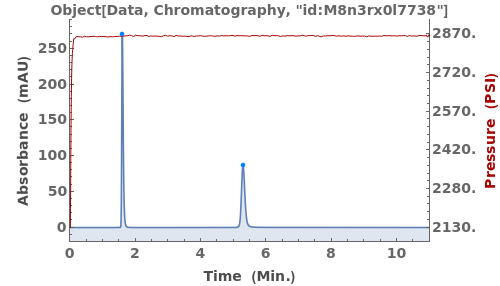
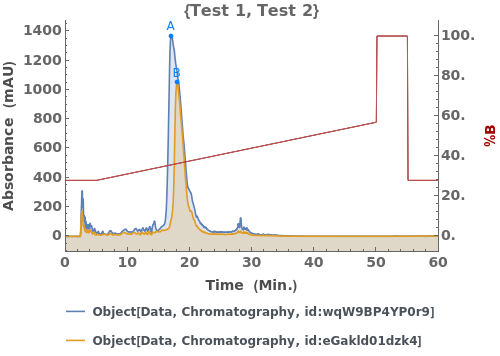
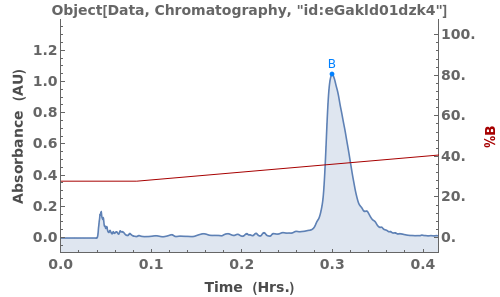
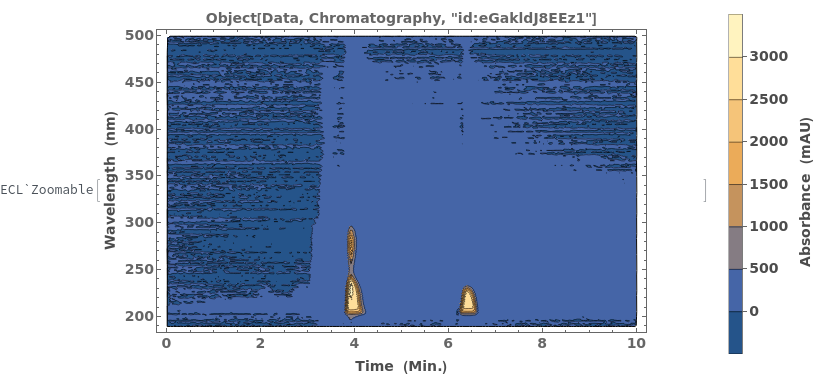
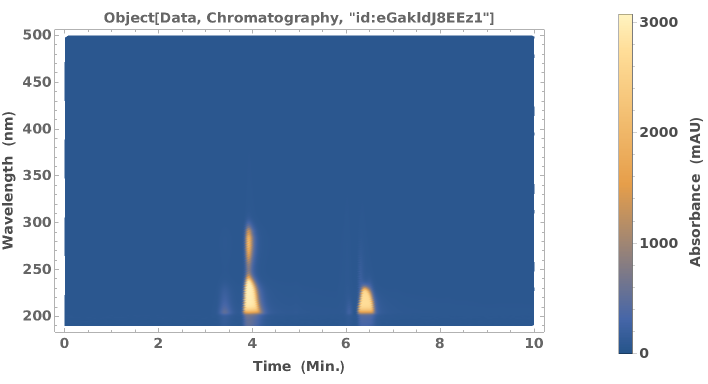
PlotChromatography[chromatograph]⟹plot
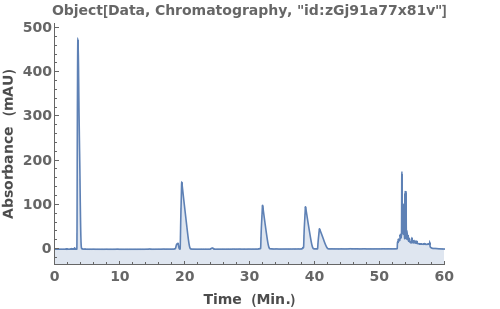
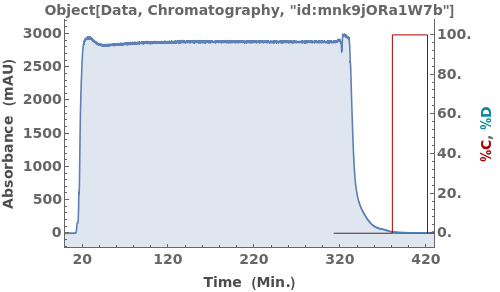
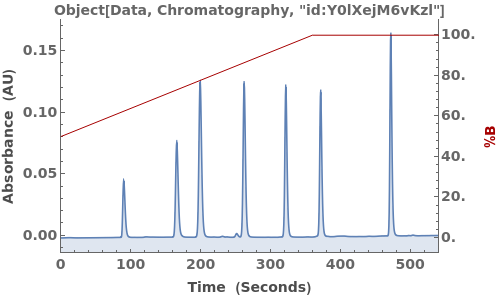
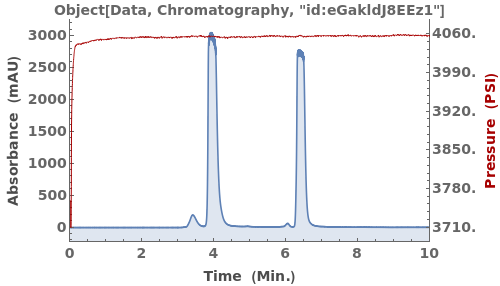
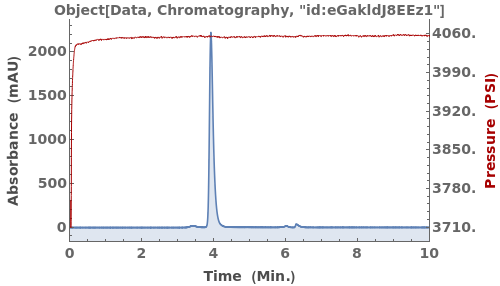
provides plots for chromatographic data.
Details
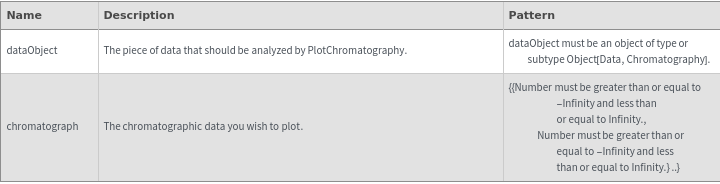
Input
Output

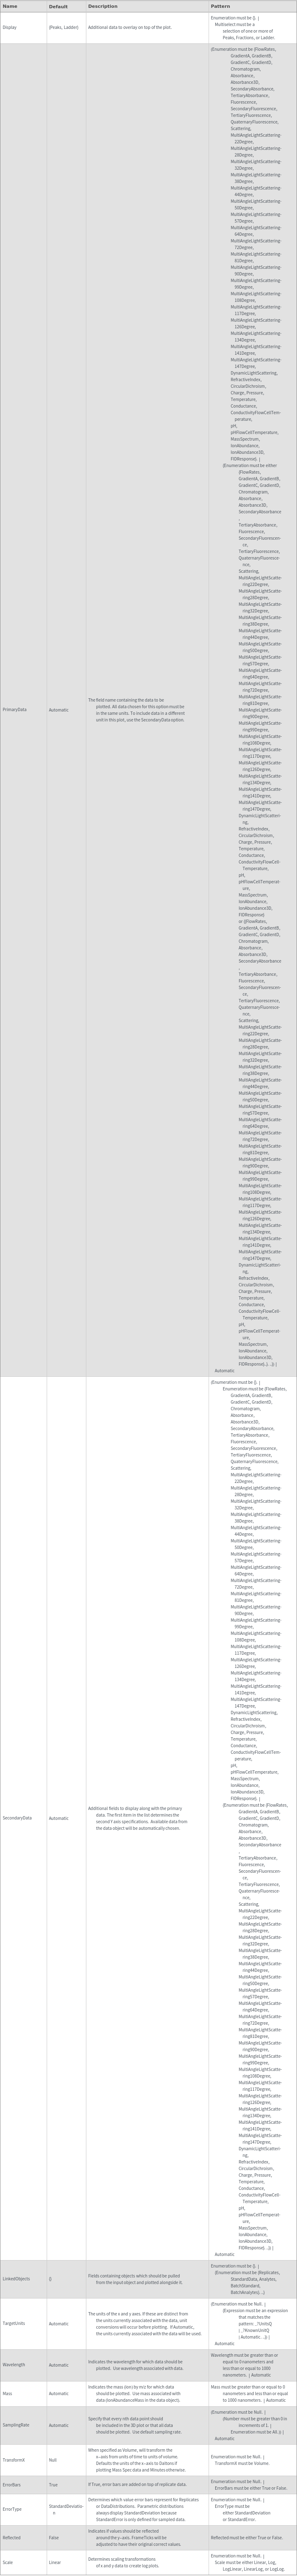
Data Specifications Options
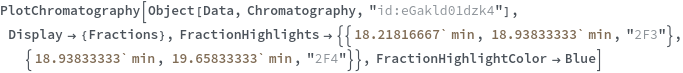
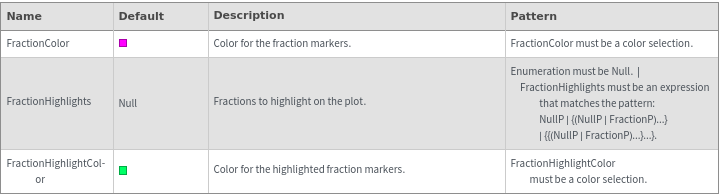
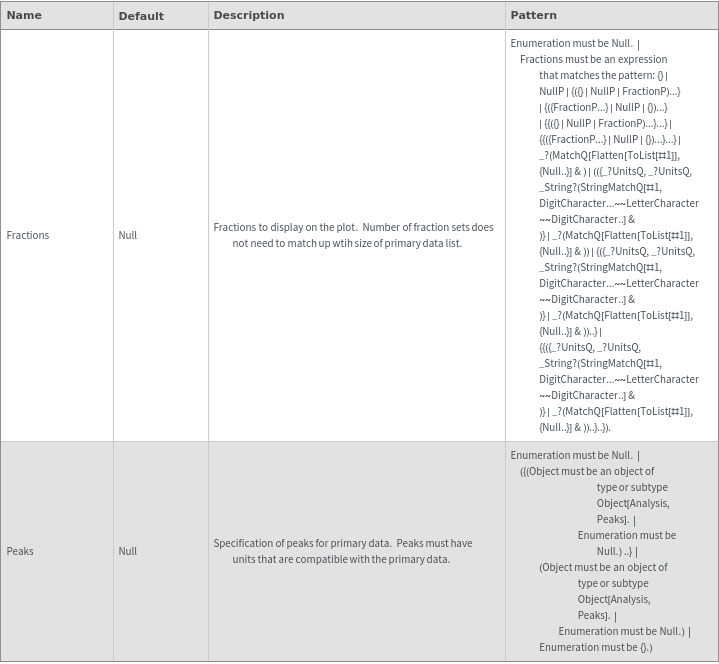
Fractions Options
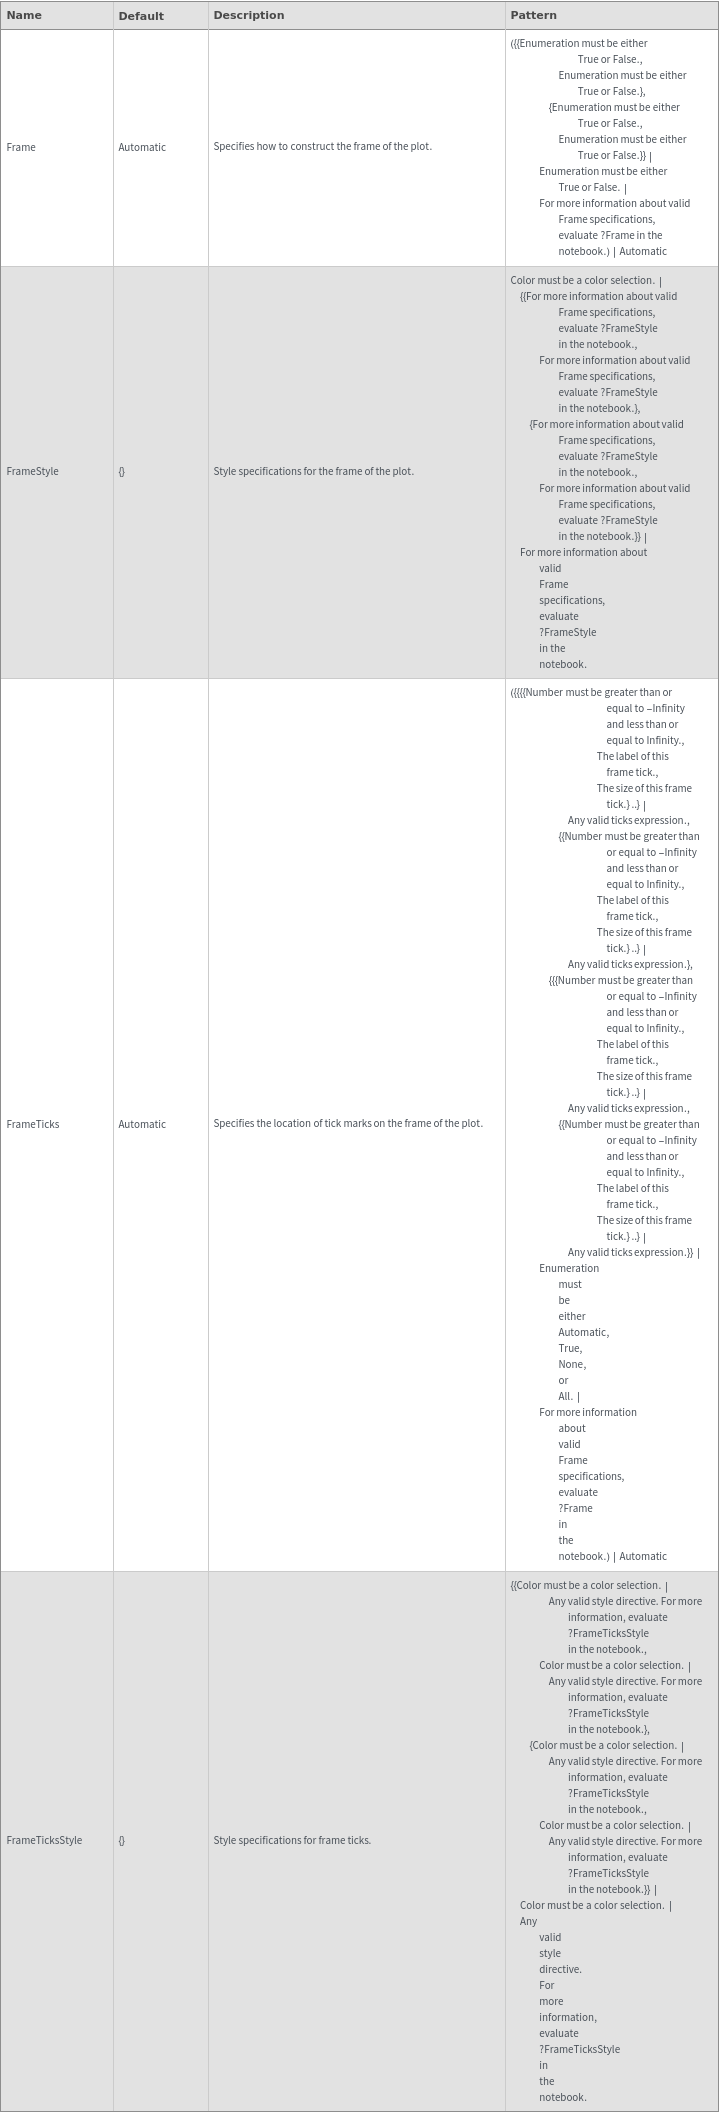
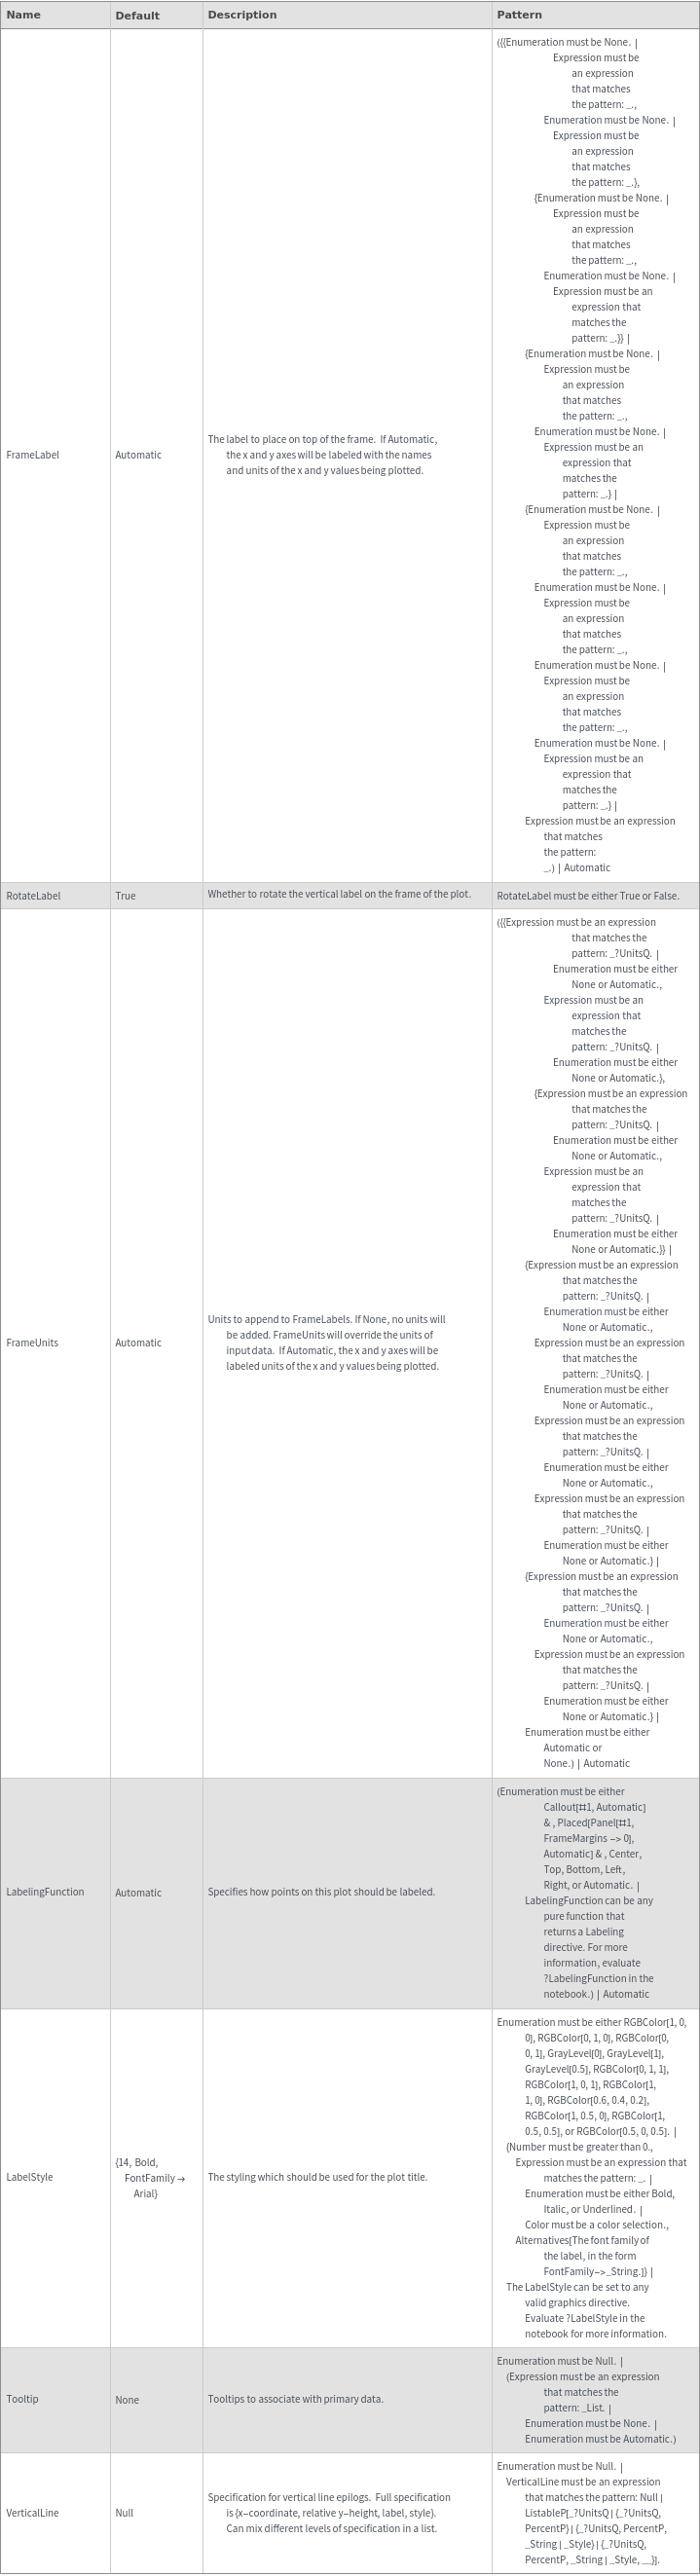
Frame Options
Grid Options
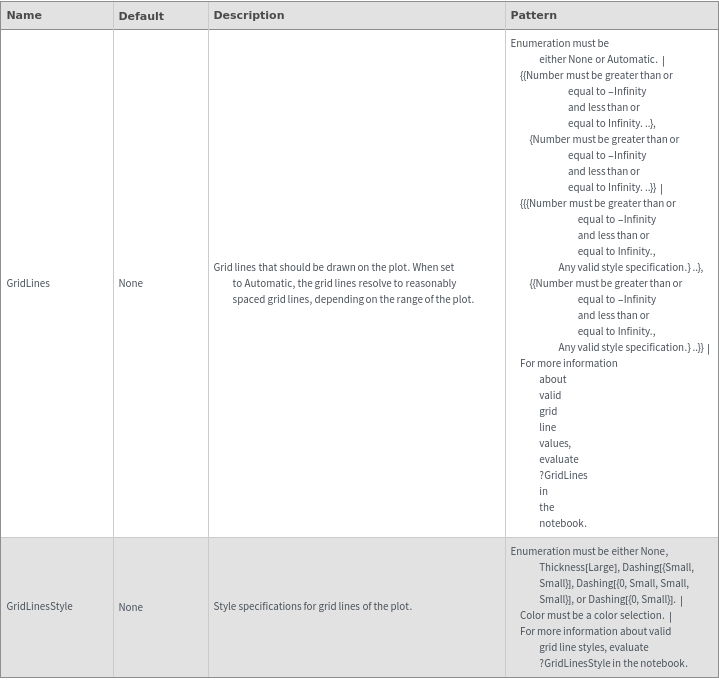
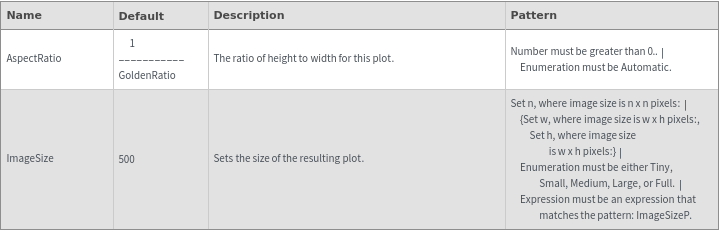
Image Format Options
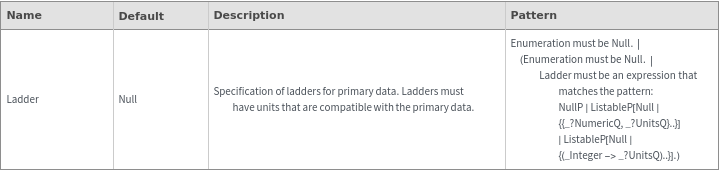
Ladder Options
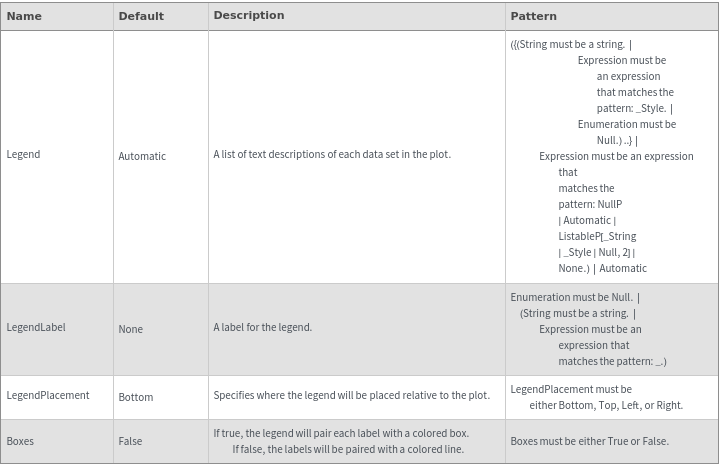
Legend Options
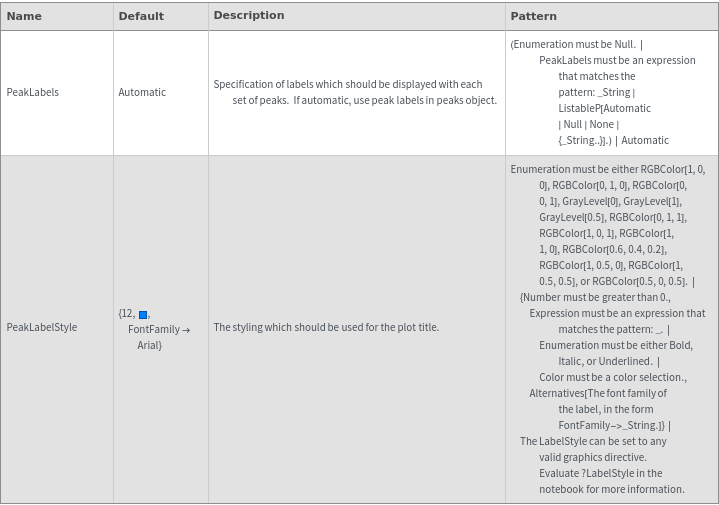
Peaks Options
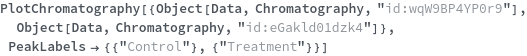
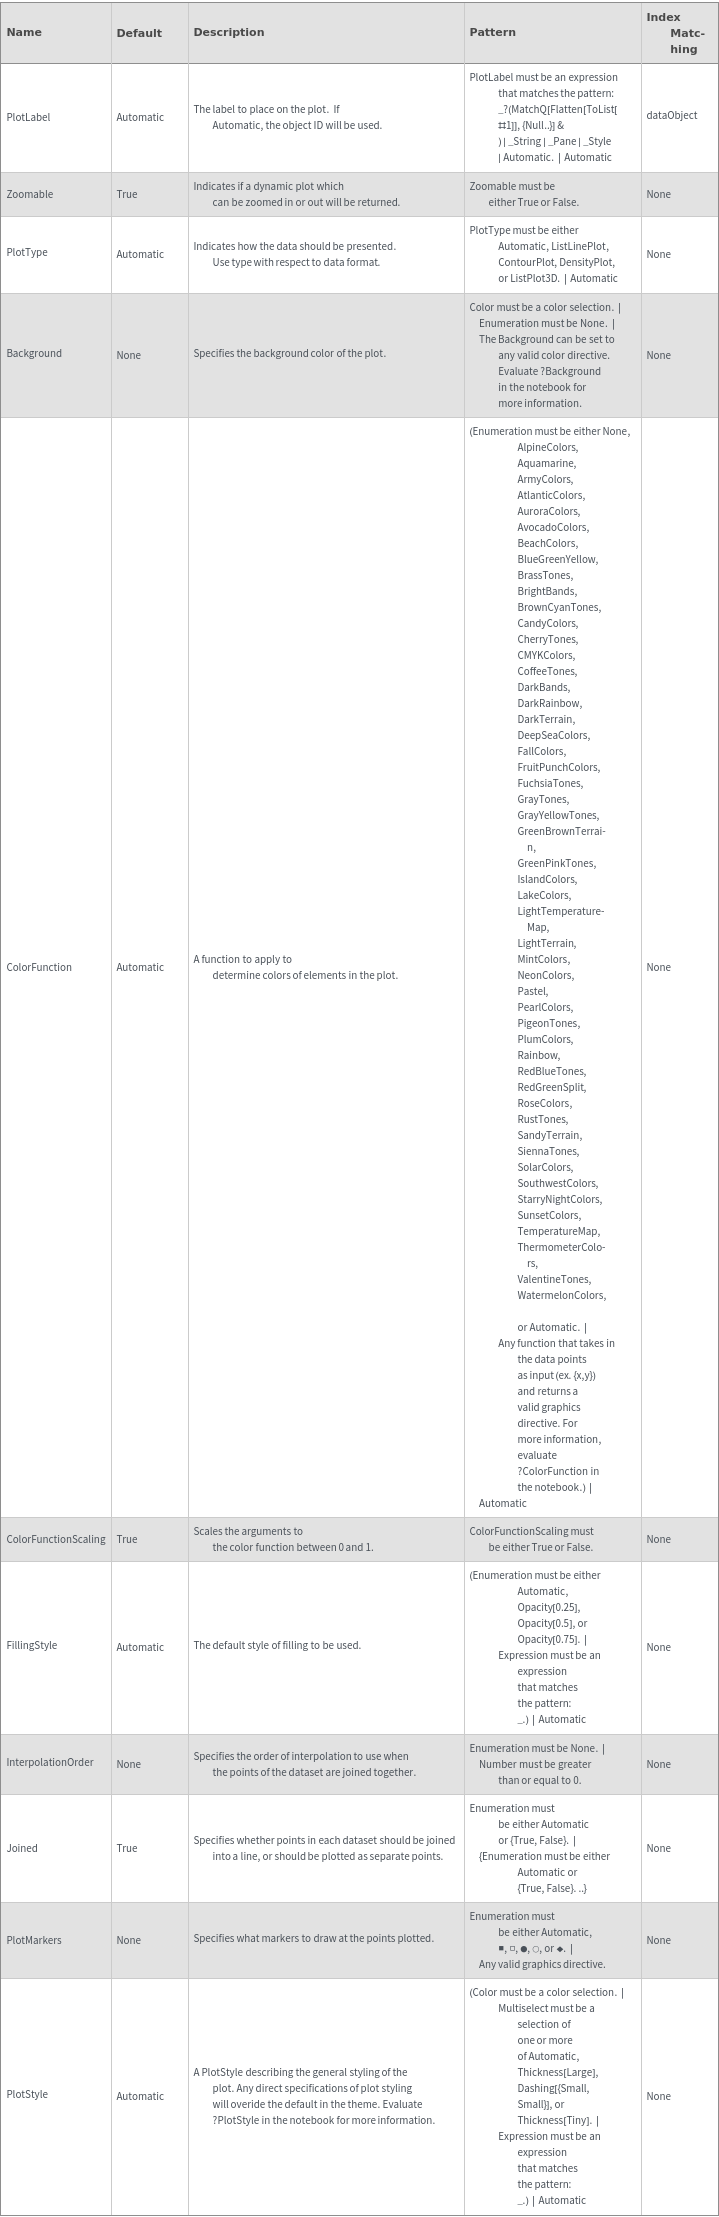
Plot Labeling Options
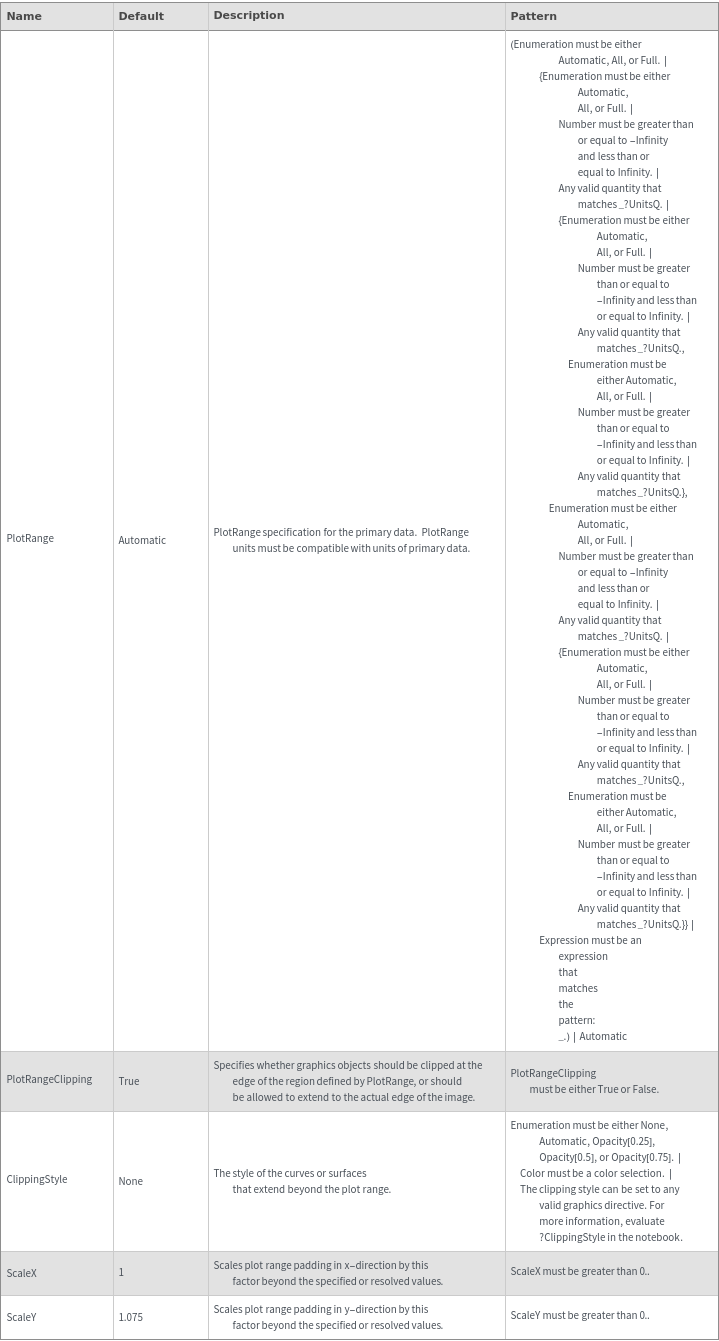
Plot Range Options
Plot Style Options
Raw Data Options
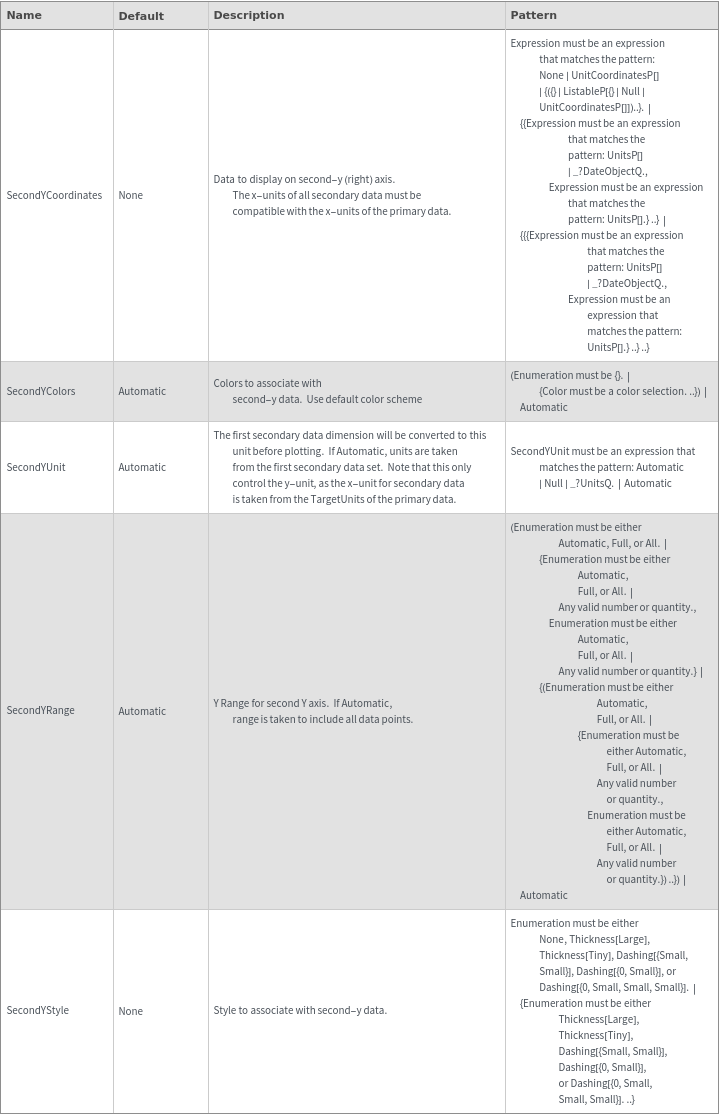
Secondary Data Options
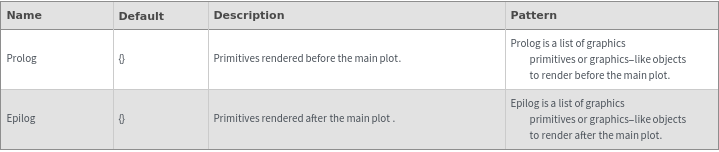
General Options