PlotChromatographyMassSpectra
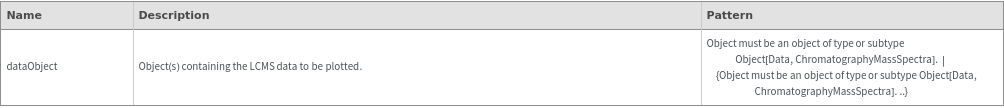
PlotChromatographyMassSpectra[dataObject]⟹plot
displays either a 2D (sliced) or 3D (waterfall) plot of the LCMS data in the supplied dataObject.
Details
- PlotChromatographyMassSpectra uses pre-computed, downsampled LCMS data linked to the input object(s) to generate plots.
- Downsampled data is linked through the DownsamplingAnalyses field of the input data object.
- By default, the most recent downsampling analysis is used in the plot. Use the DownsampledData option to plot data from a specific downsampling analysis.
- All LCMS data is downsampled to a time resolution of 1 second when uploaded. Data can be re-analyzed with different downsampling rates using AnalyzeDownsampling.
Input
Output

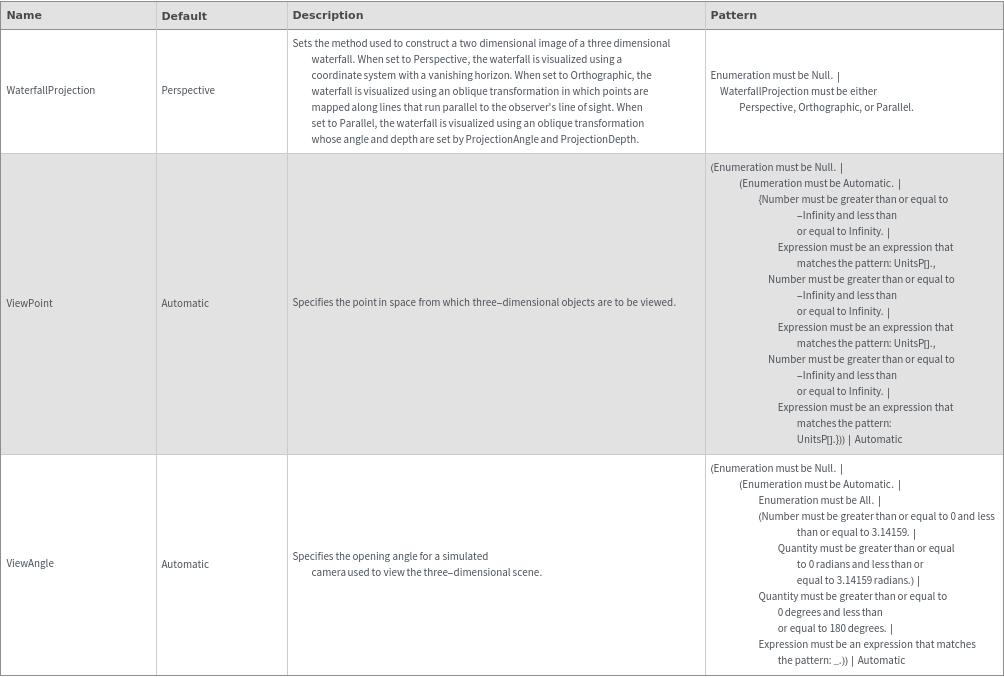
3D View Options
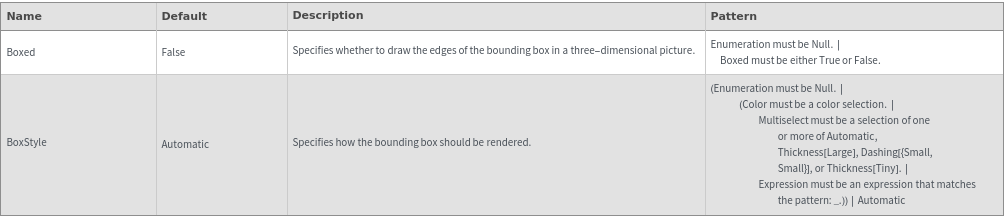
Box Options
Frame Options
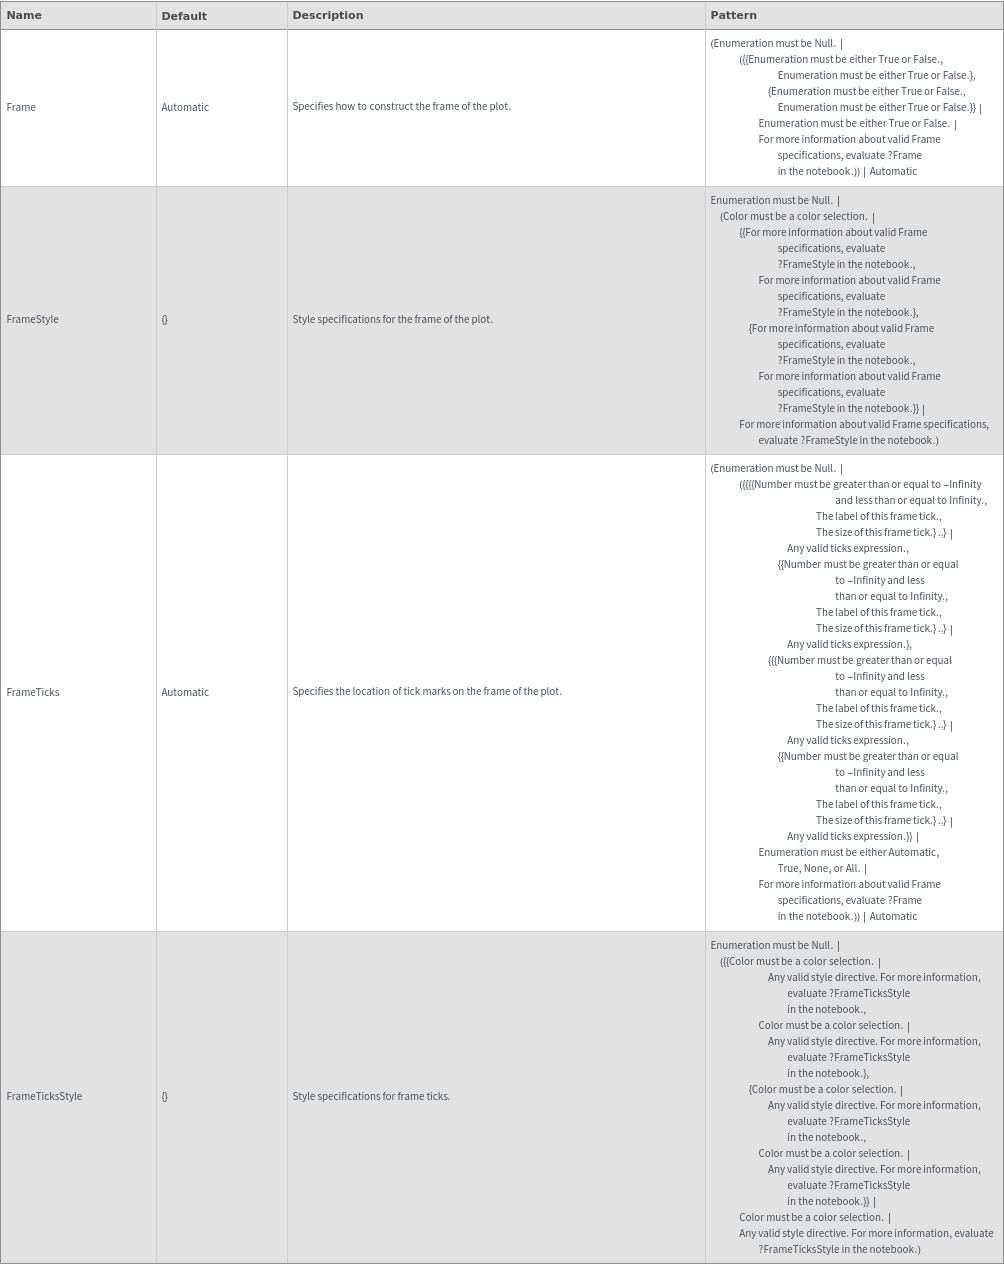
Grid Options
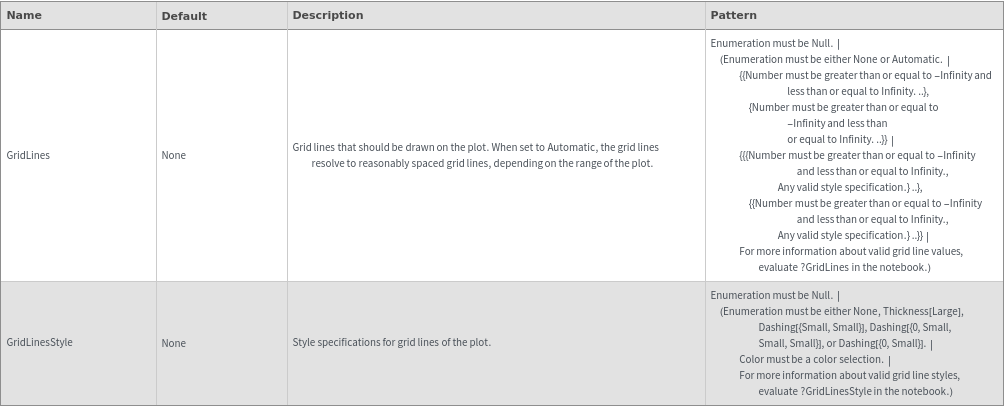
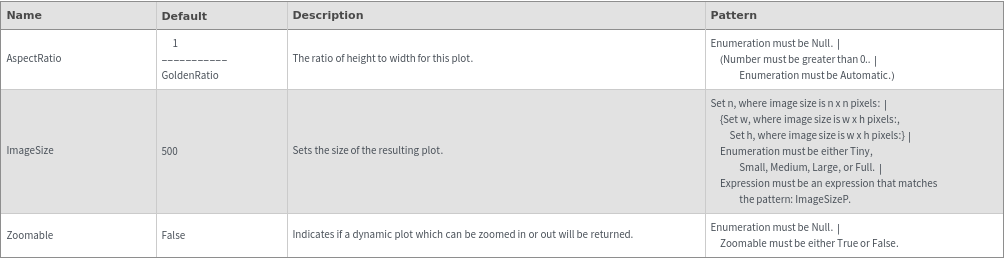
Image Format Options
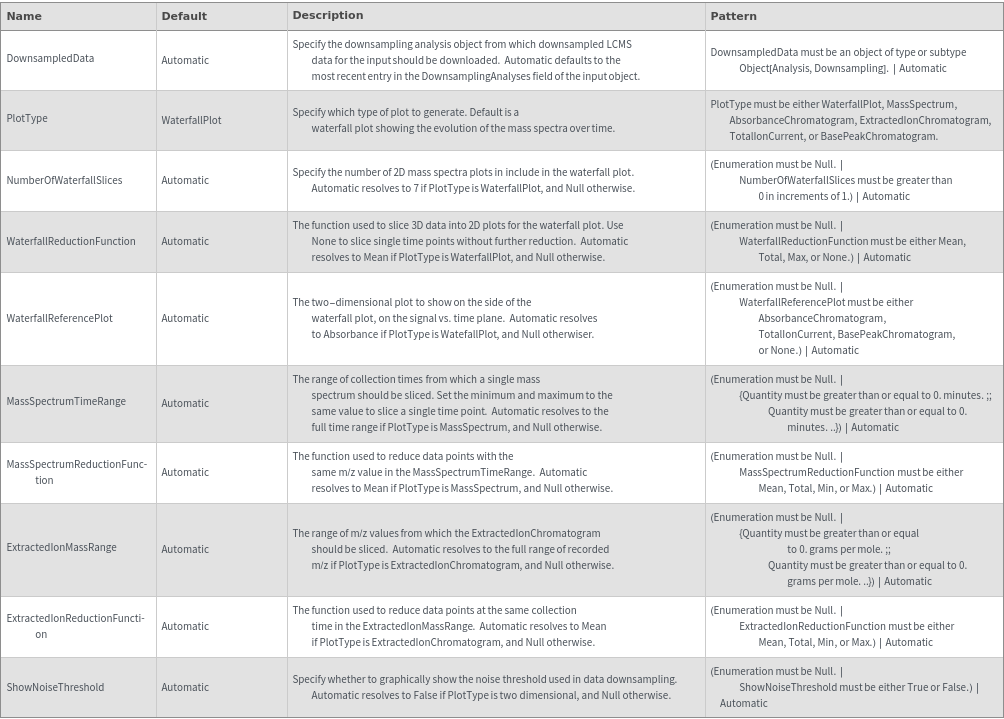
LCMS Data Options
Legend Options
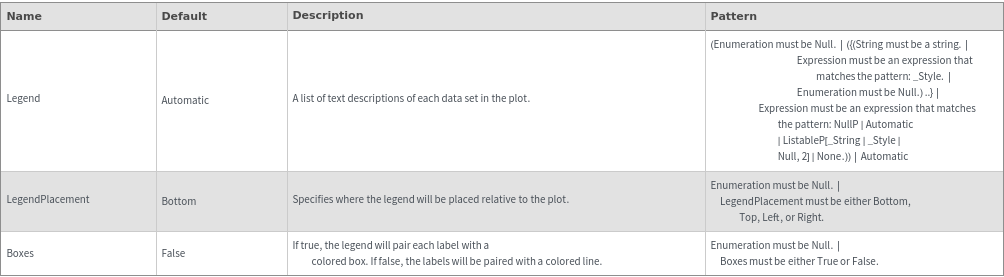
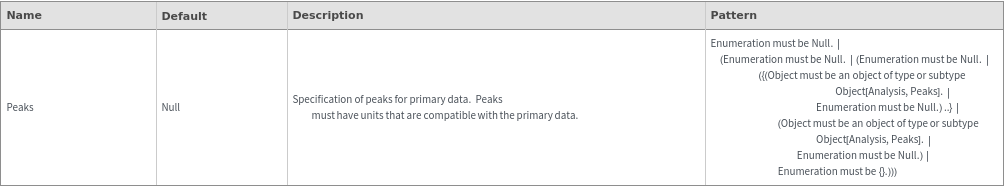
Peaks Options
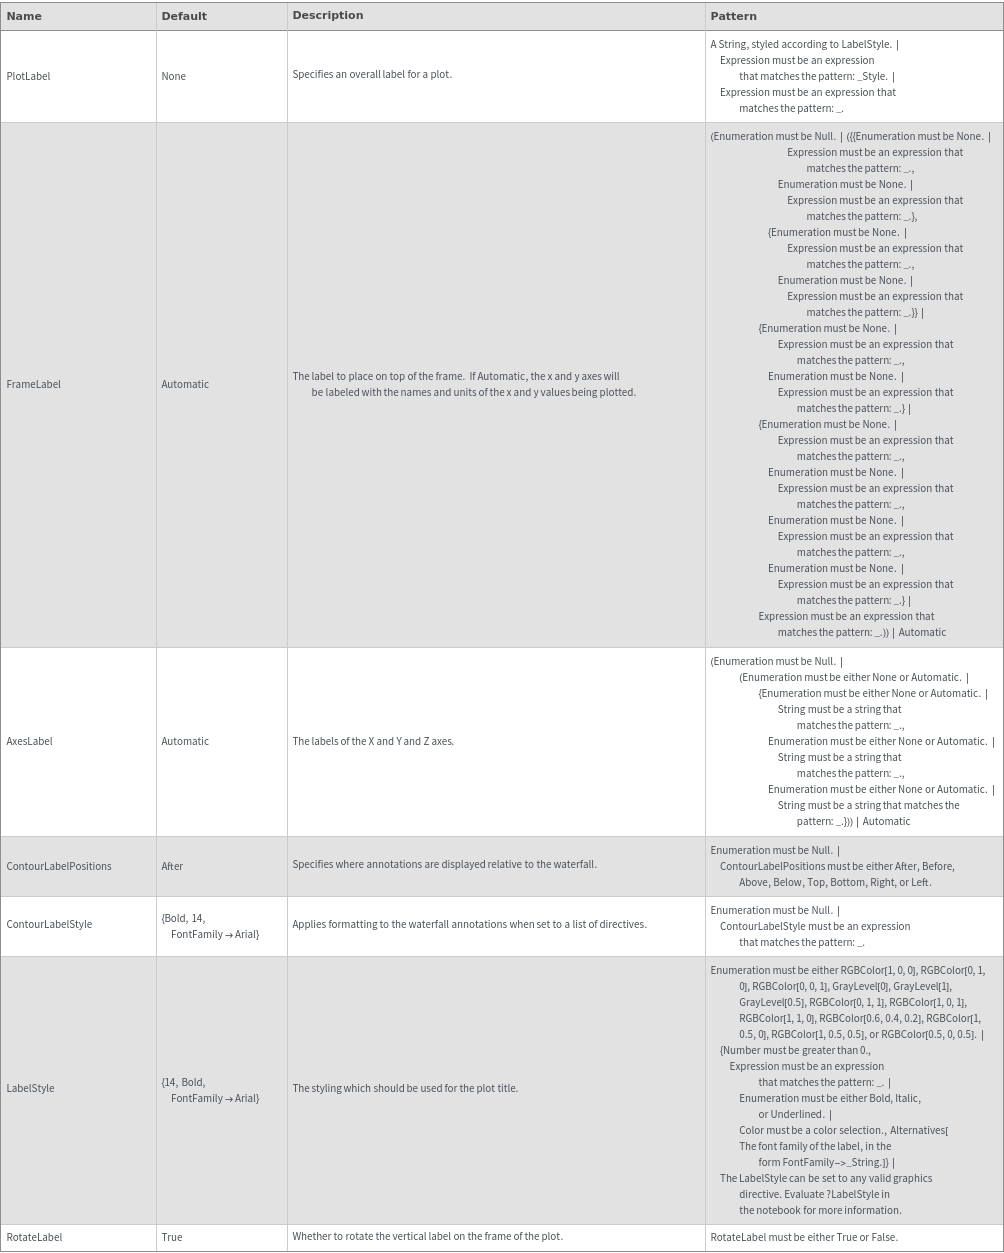
Plot Labeling Options
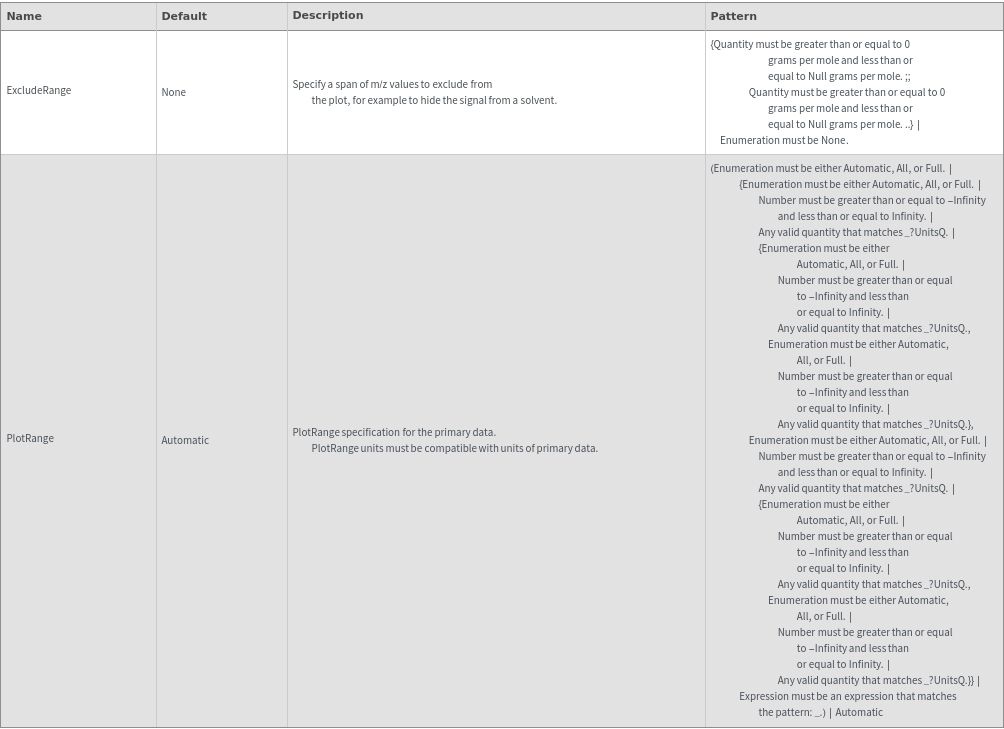
Plot Range Options
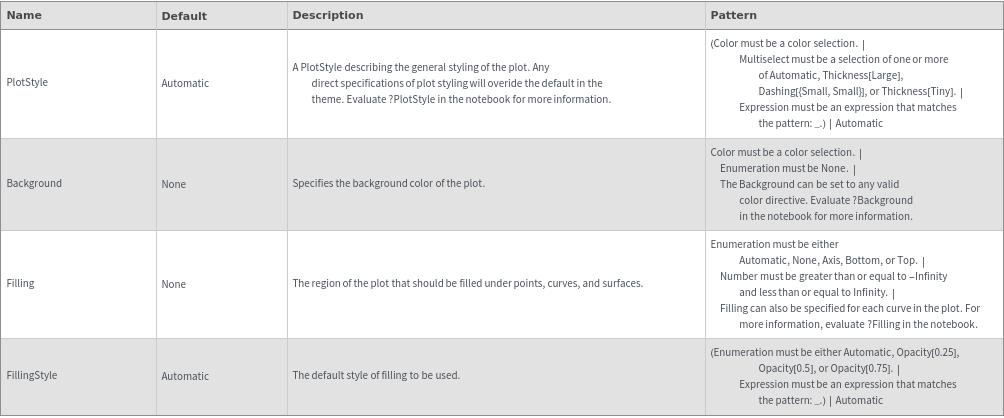
Plot Style Options
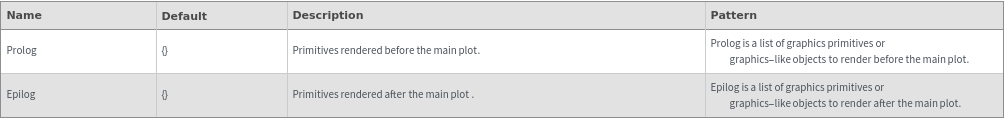
General Options
Examples
Basic Examples (4)


Options (24)
DownsampledData (1)

ExcludeRange (2)


ExtractedIonMassRange (2)


ExtractedIonReductionFunction (1)

MassSpectrumReductionFunction (1)

MassSpectrumTimeRange (2)


NumberOfWaterfallSlices (2)

Peaks (2)


PlotType (6)
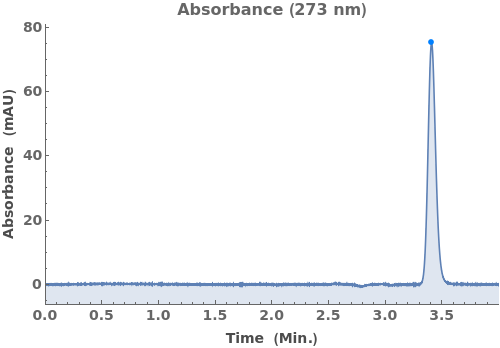
Plot the absorbance chromatogram collected alongside LCMS data:

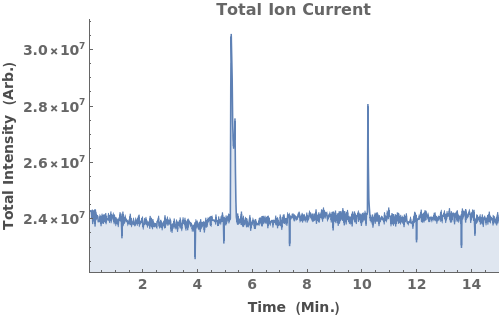
Plot the total ion current (TIC), the total mass spectrum intensity at each time point:

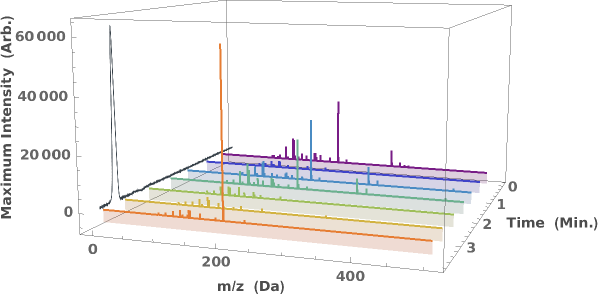
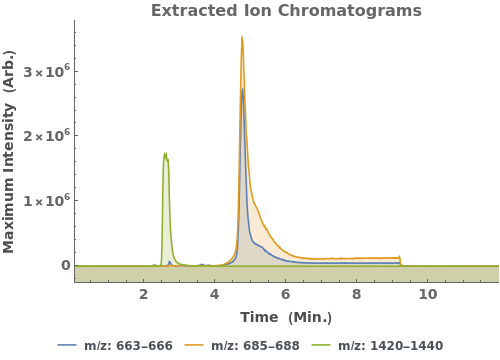
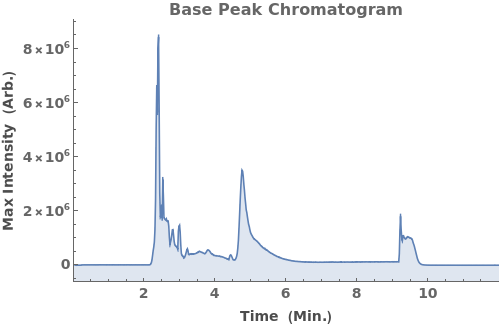
Plot the base peak chromatogram (BPC), the maximum mass spectrum intensity at each time point:

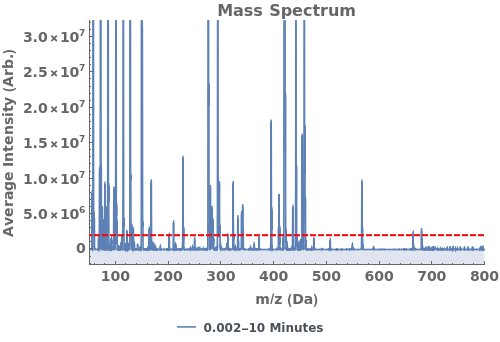
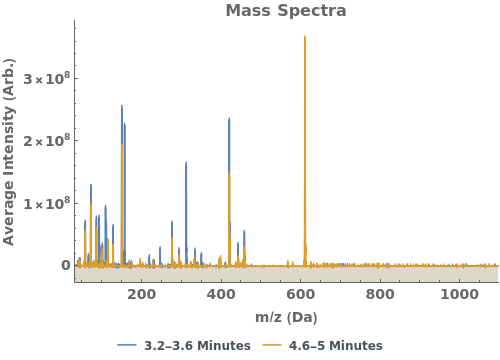
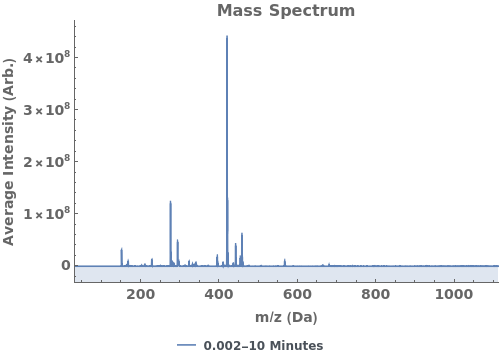
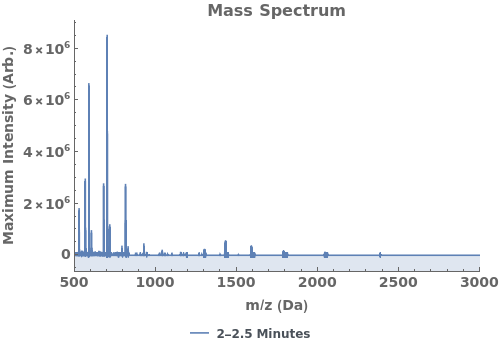
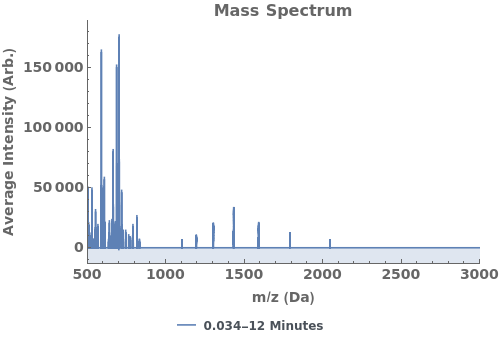
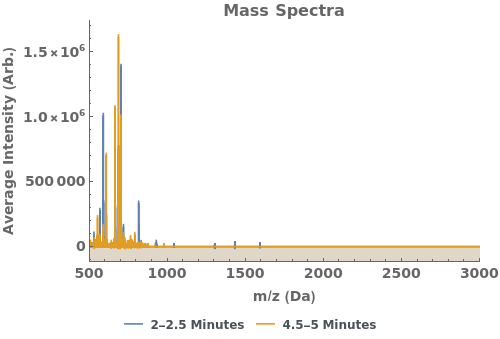
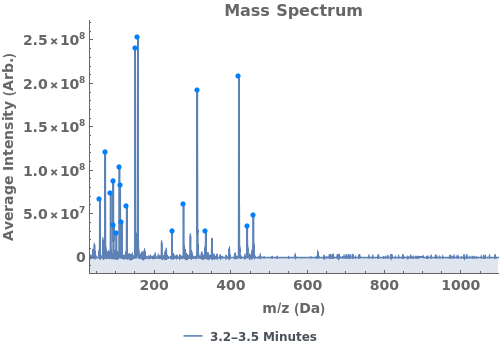
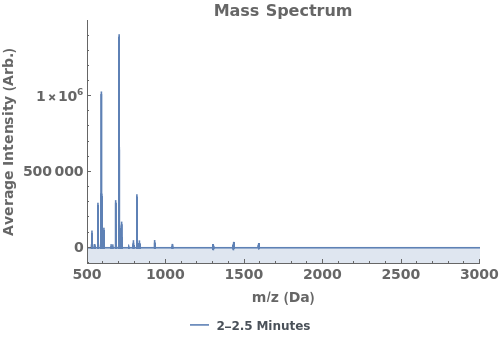
Plot the average mass spectrum (MS) between 2.0 and 2.5 minute elution times:

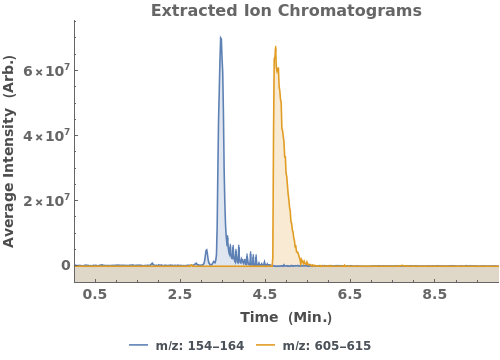
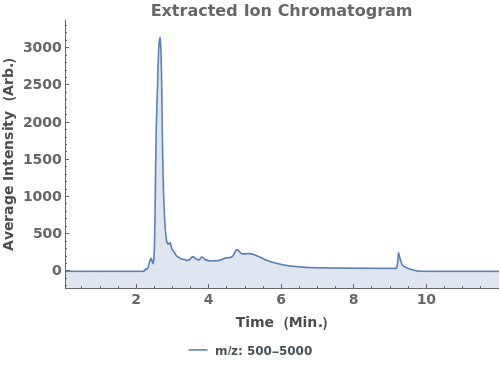
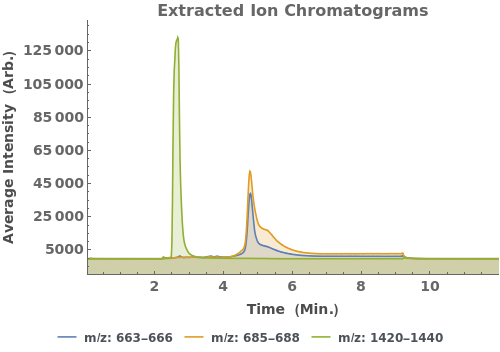
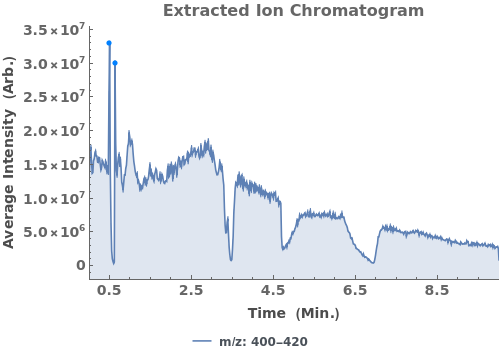
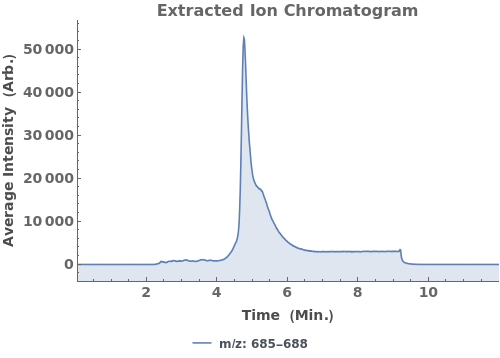
Plot the extracted ion chromatogram (EIC) of average intensity for m/z between 685 and 688:

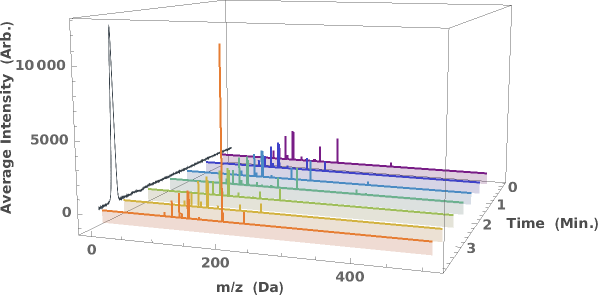
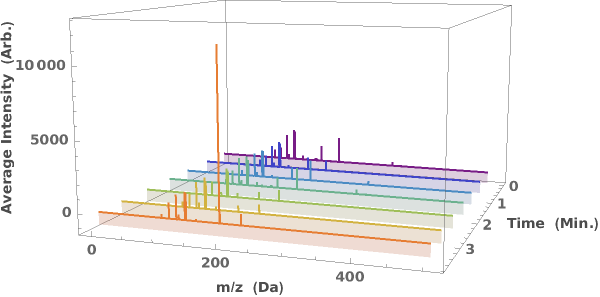
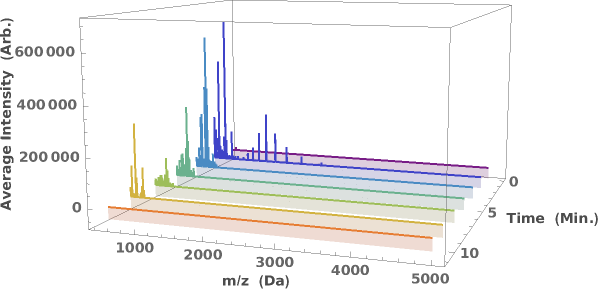
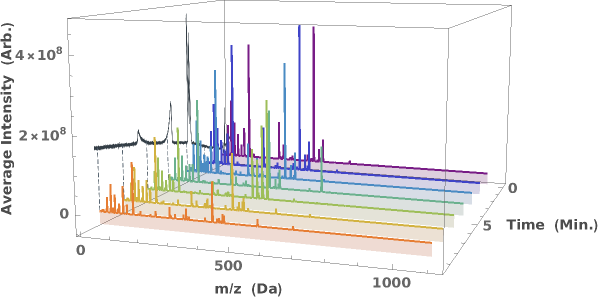
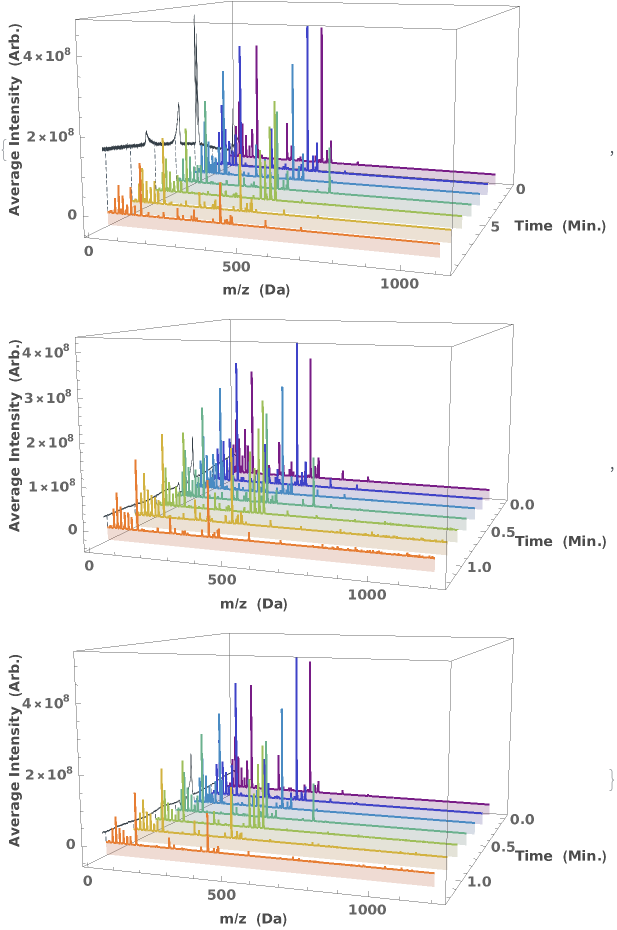
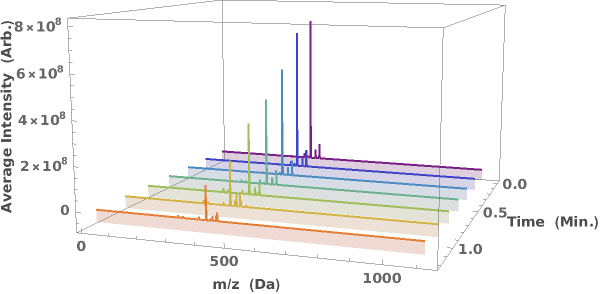
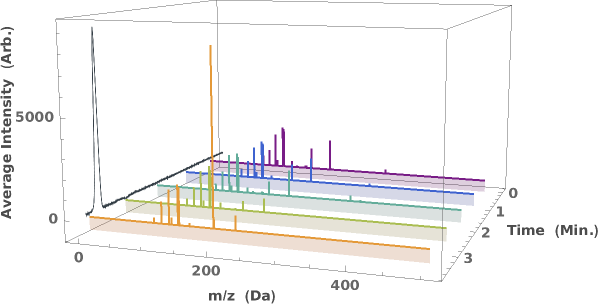
Generate a waterfall plot showing the evolution of mass spectra as a function of elution time: