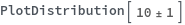
PlotDistribution
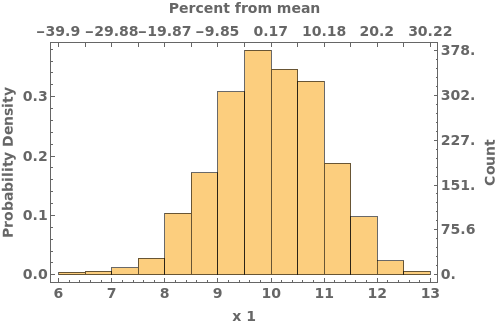
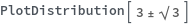
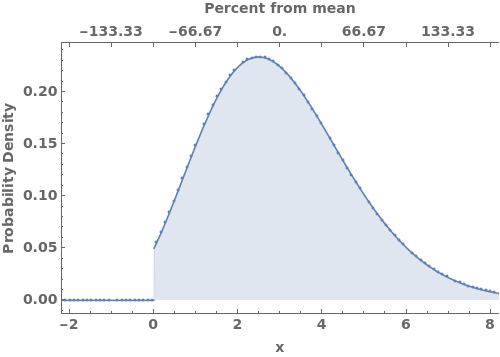
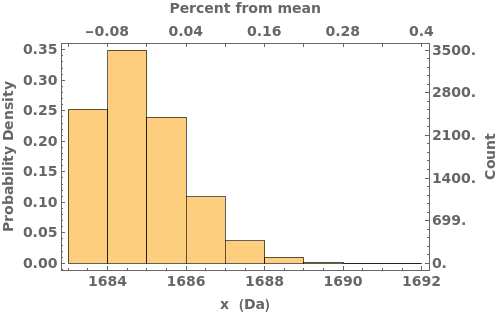
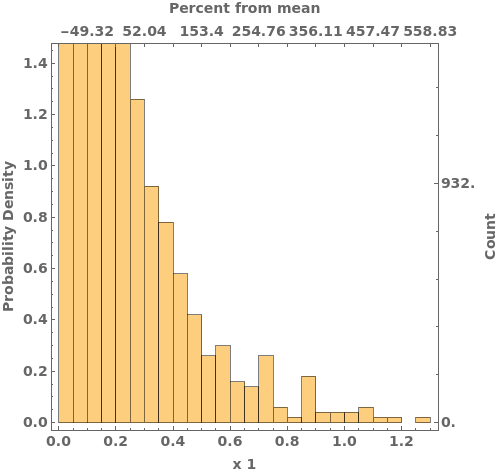
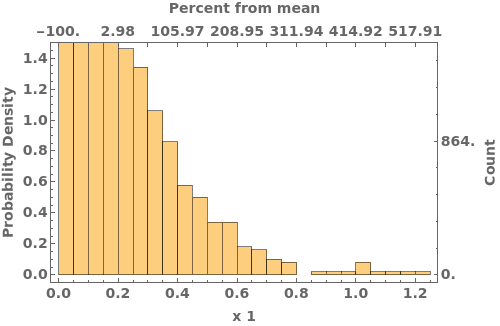
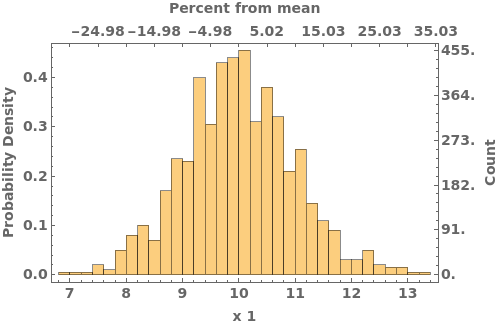
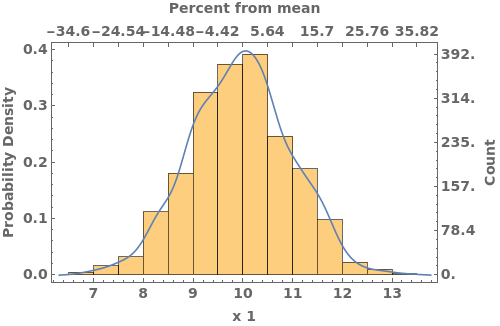
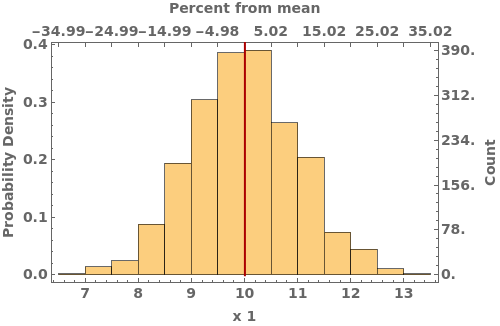
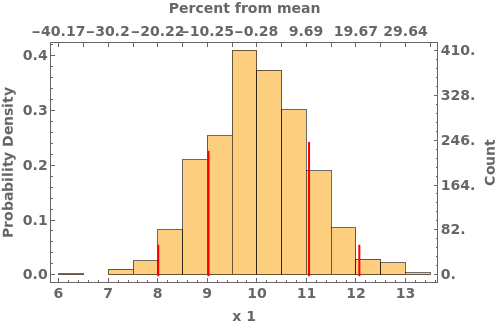
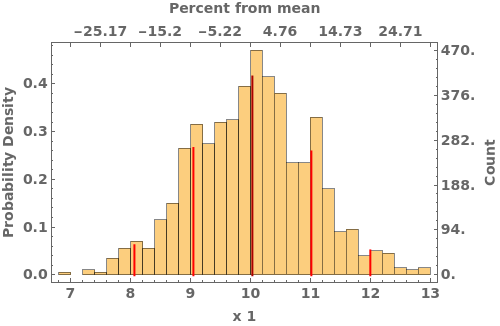
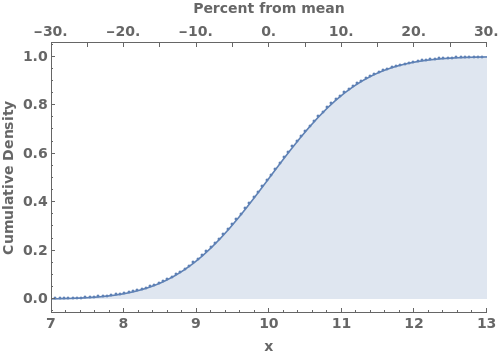
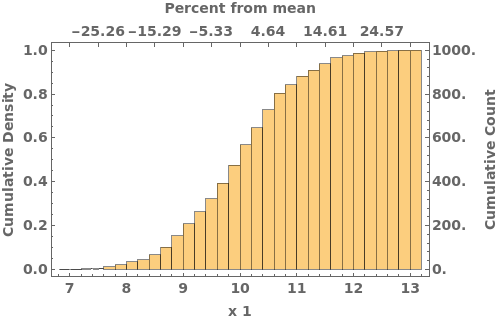
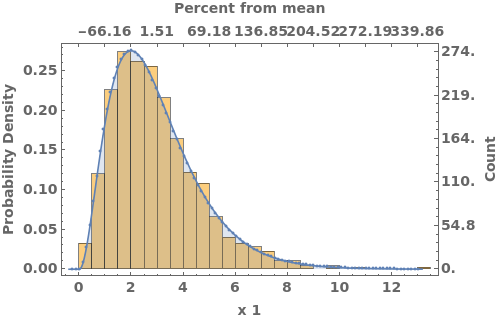
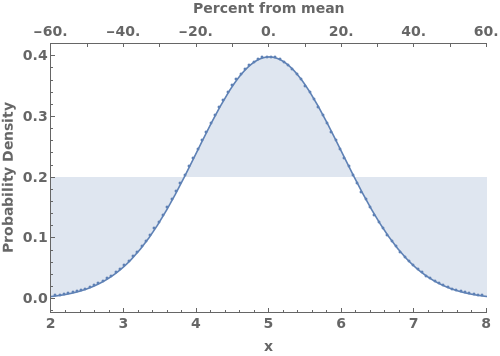
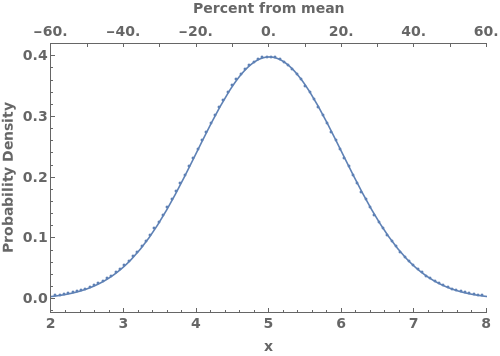
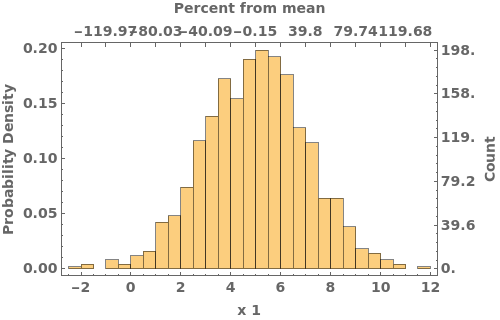
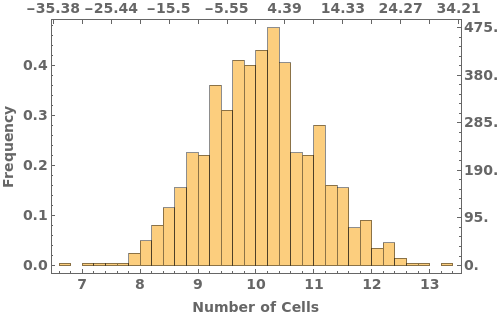
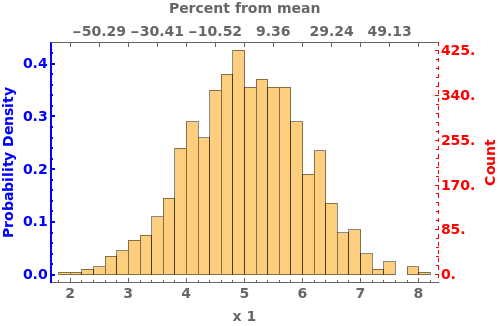
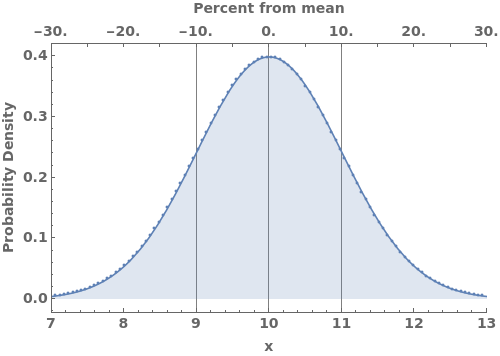
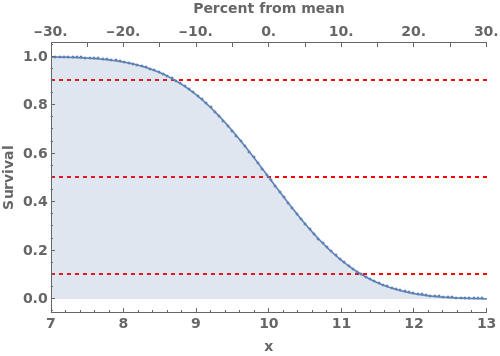
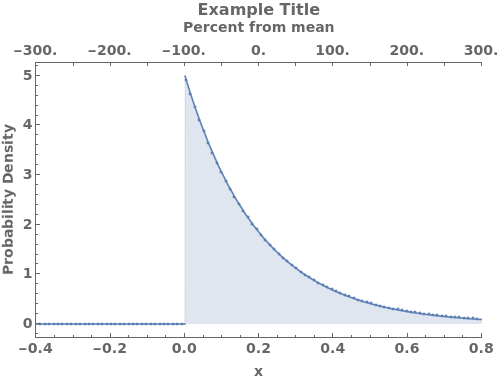
PlotDistribution[dist]⟹fig
plots the PDF of the distribution dist with statistics overlaid.
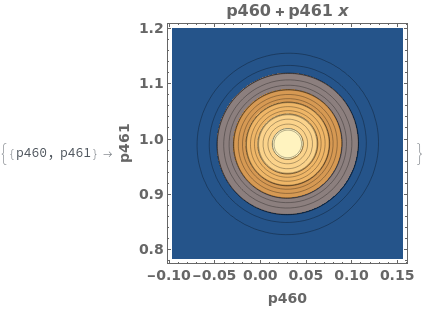
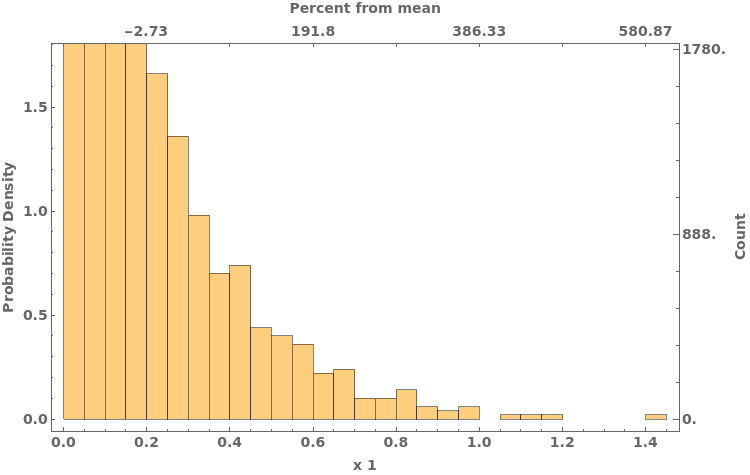
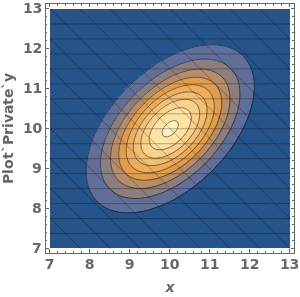
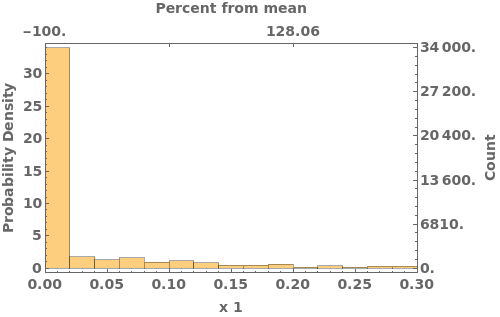
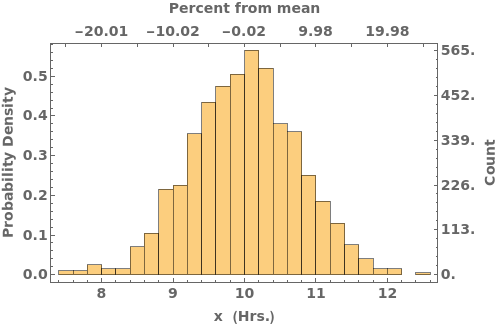
PlotDistribution[fitObject]⟹paramFig
plots the best-fit distribution of each fitted parameter in fitObject.
Details
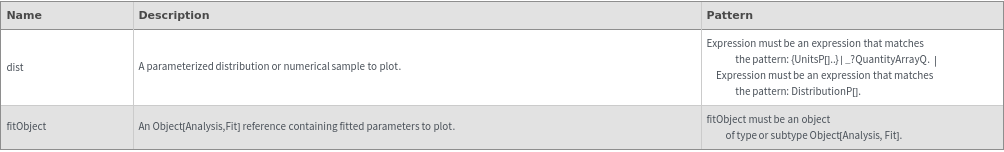
Input
Output

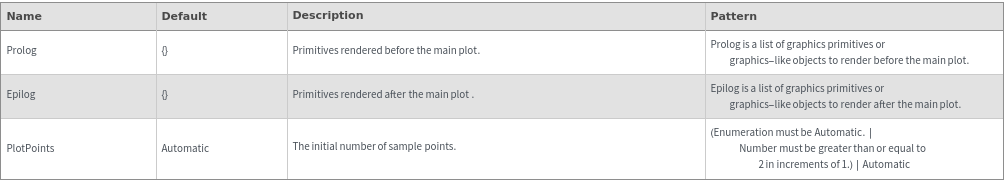
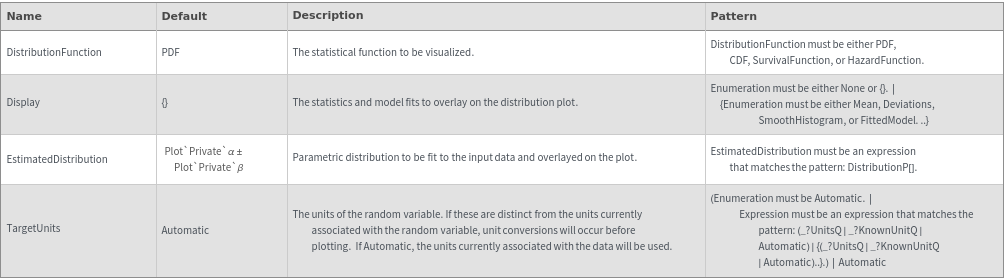
Data Specifications Options
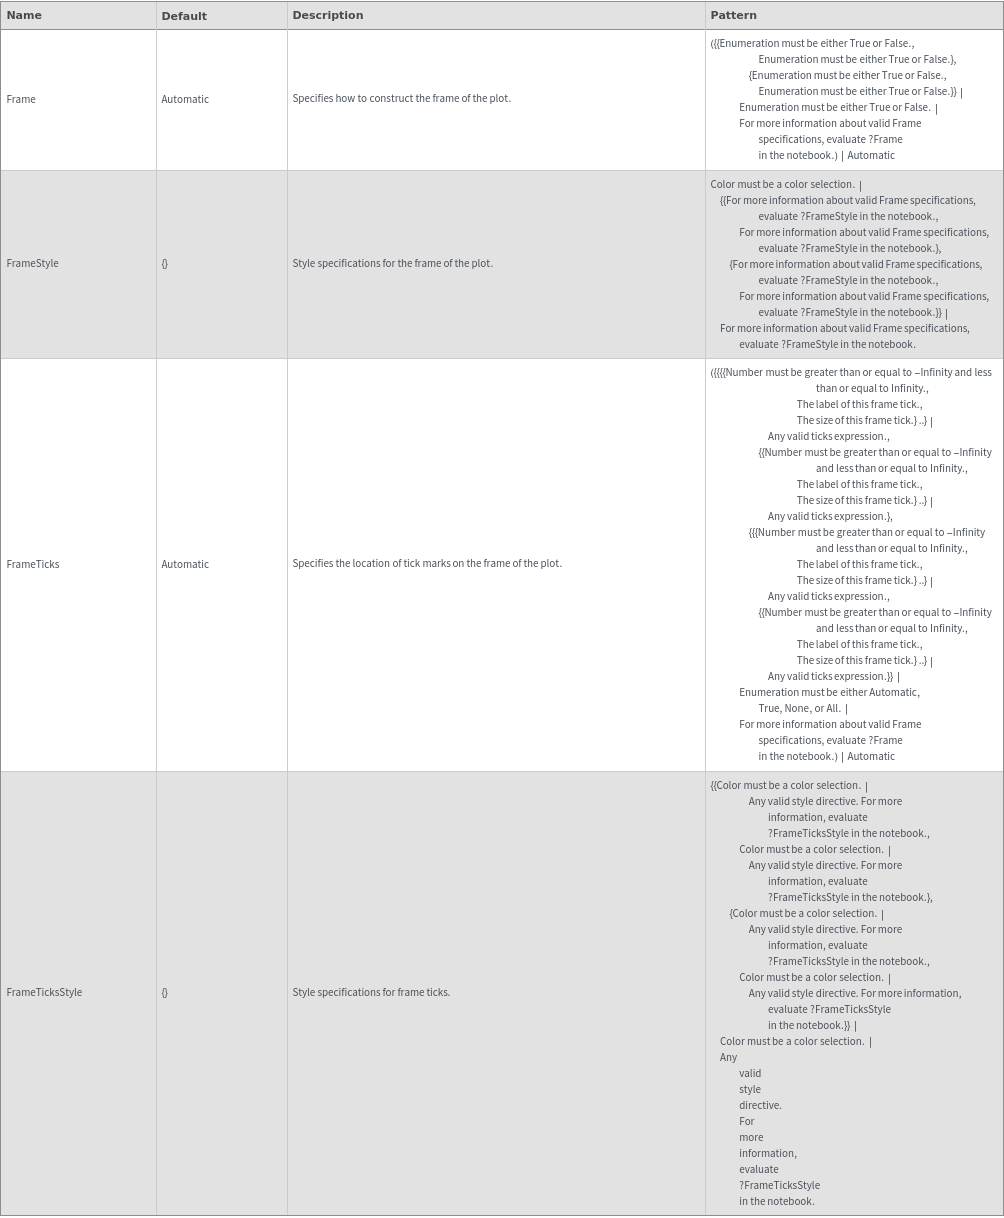
Frame Options
Grid Options
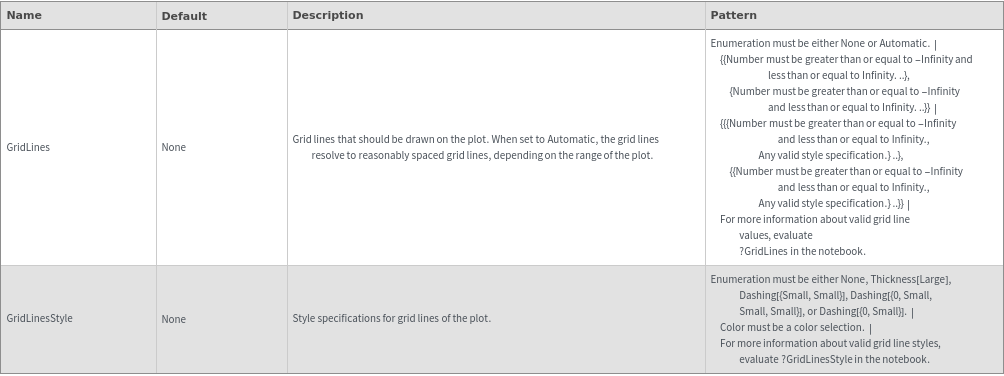
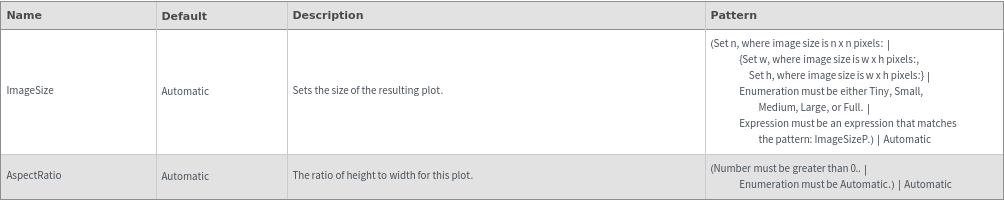
Image Format Options
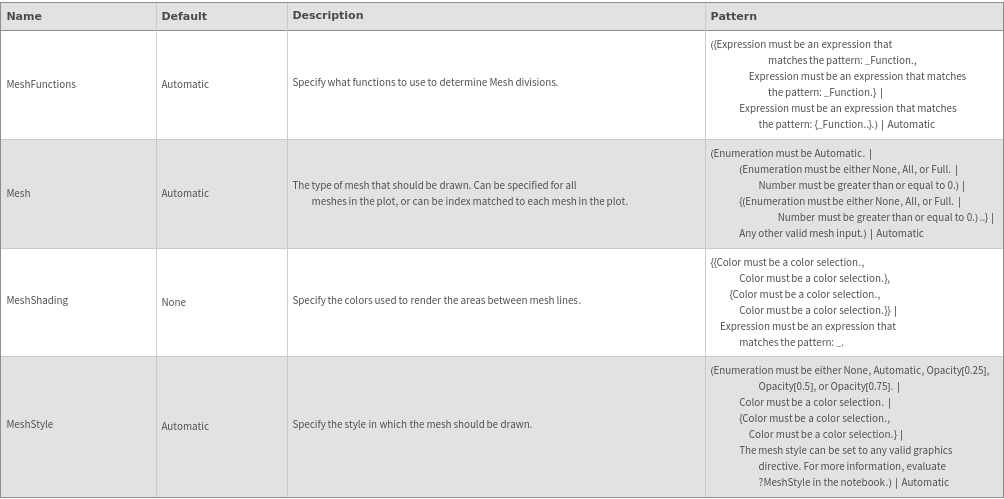
Mesh Options
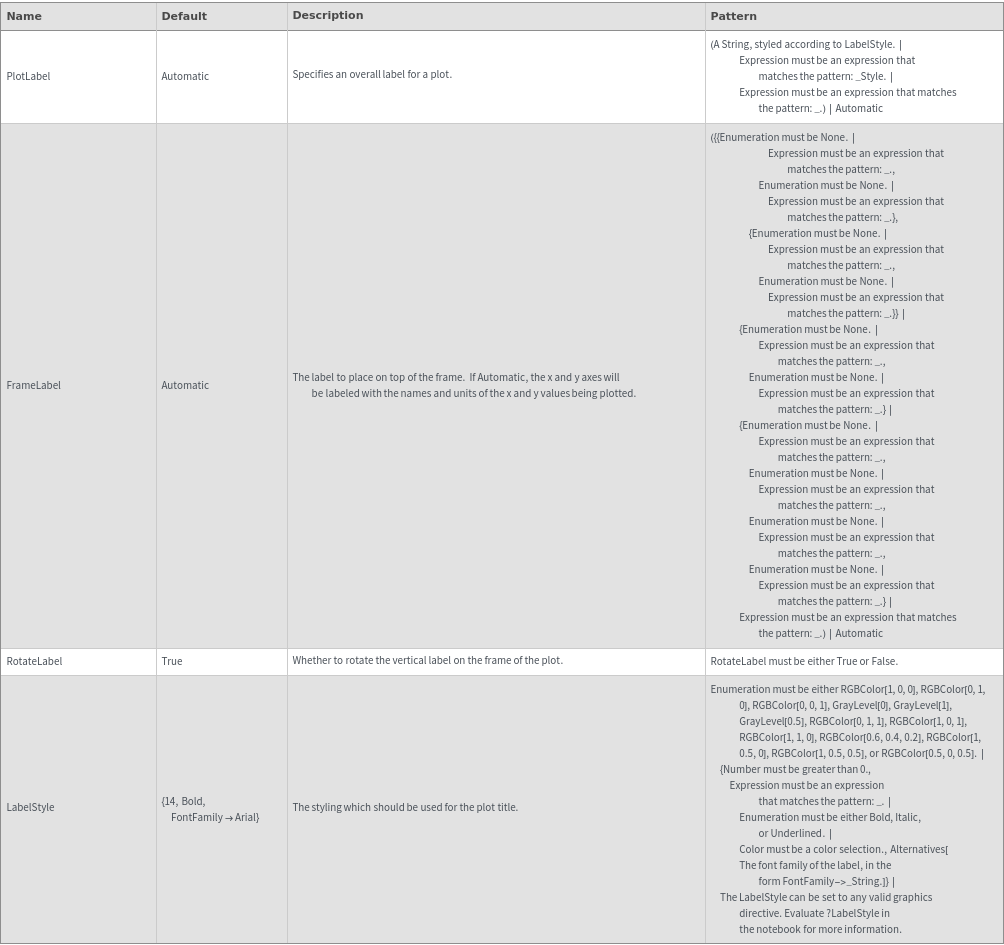
Plot Labeling Options
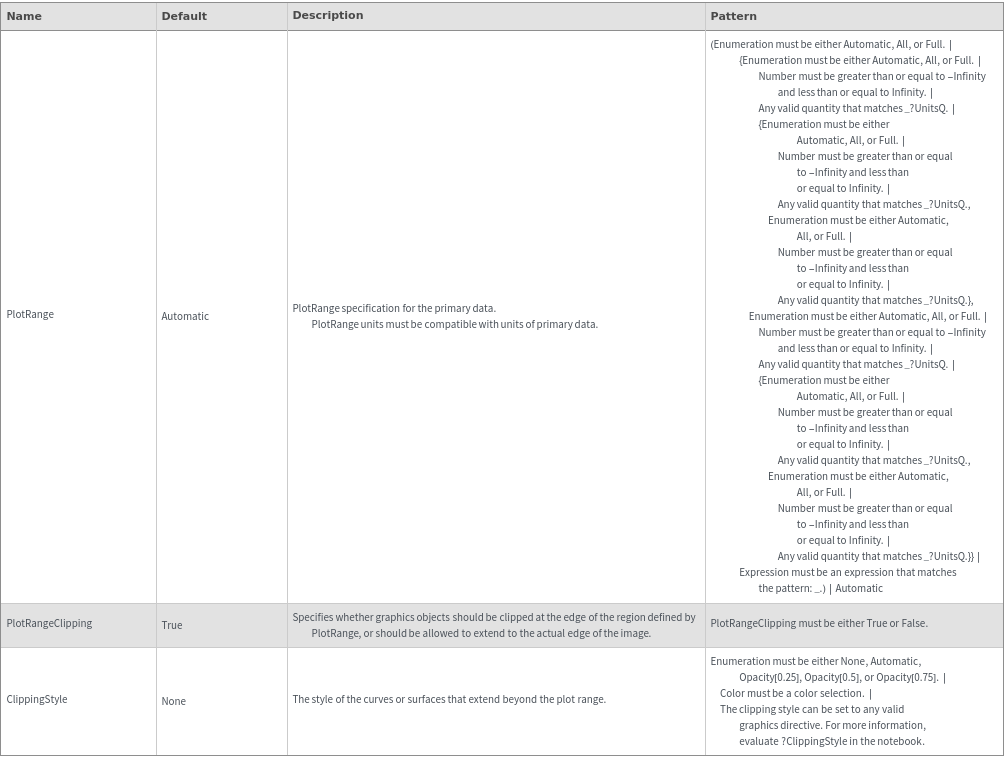
Plot Range Options
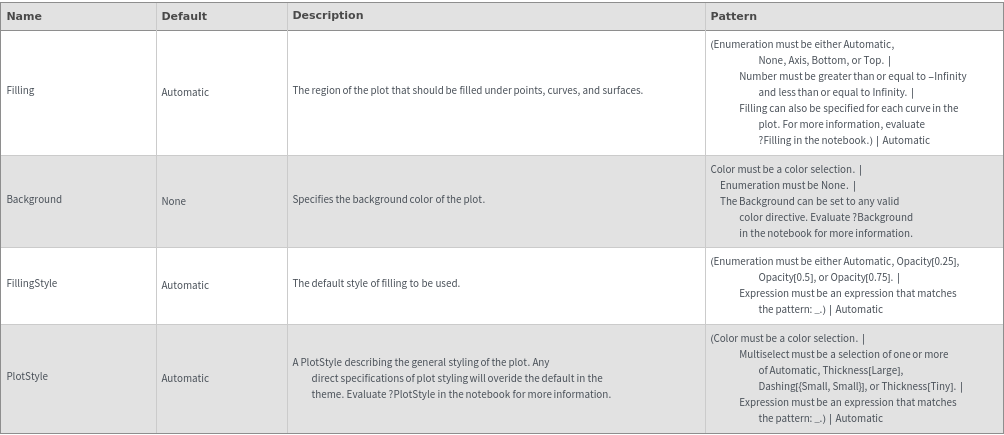
Plot Style Options
General Options