PlotFluorescenceKinetics
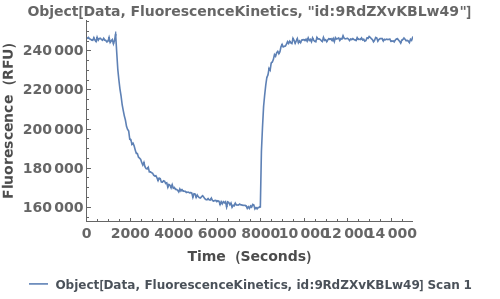
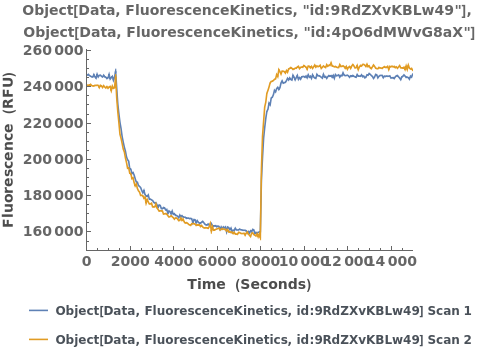
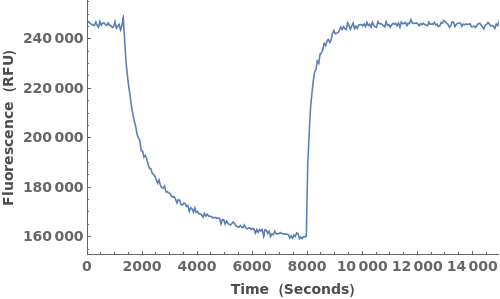
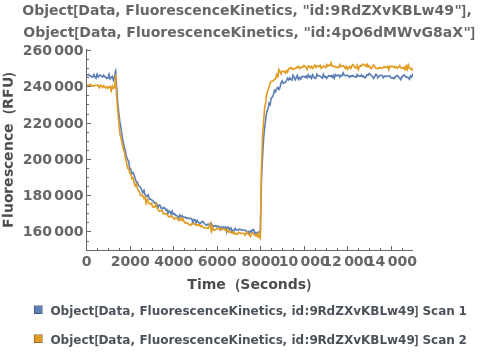
PlotFluorescenceKinetics[fluorescenceKineticsData]⟹plot
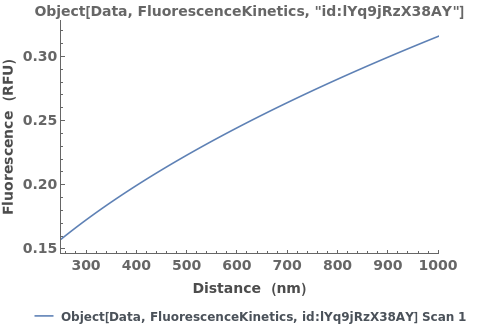
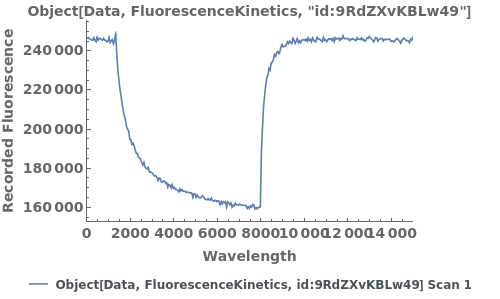
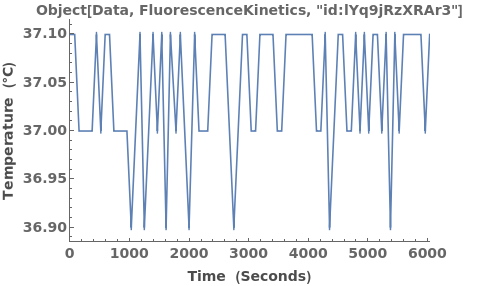
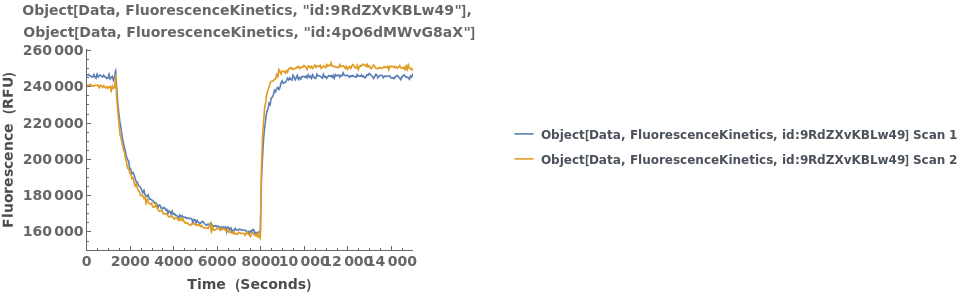
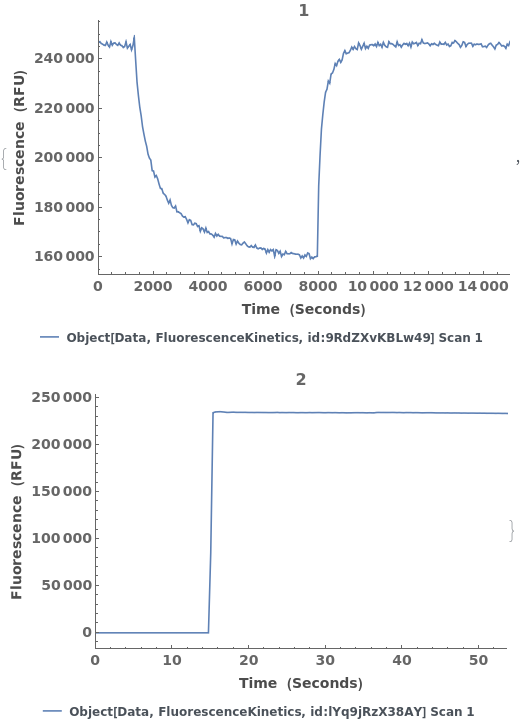
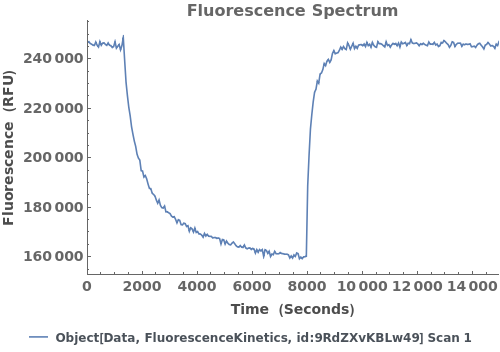
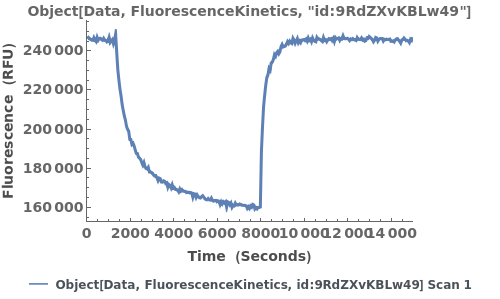
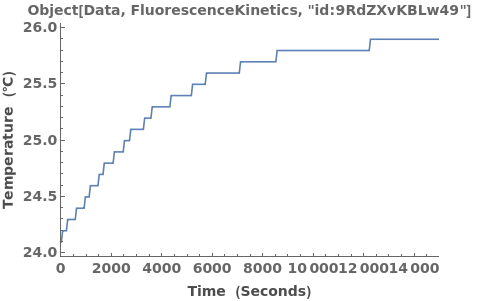
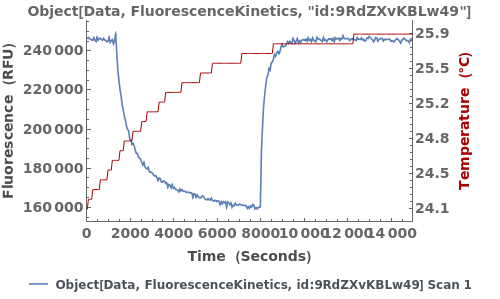
displays fluorescence intensity vs time for the supplied fluorescenceKineticsData.
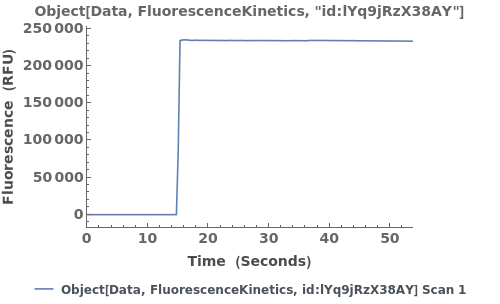
PlotFluorescenceKinetics[trajectory]⟹plot
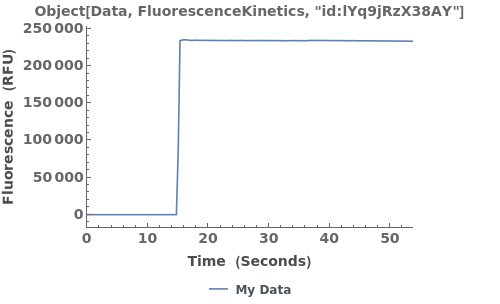
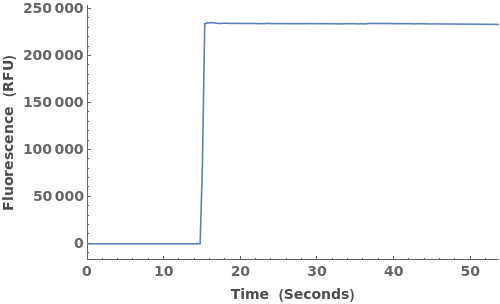
displays fluorescence intensity vs time when given a raw data trajectory.
Details
-
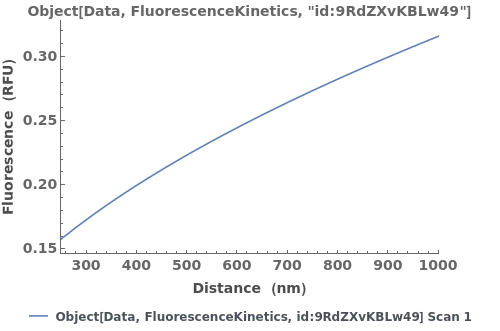
NoTrajectory Raw data could not be resolved for inputs `1`. Please use Inspect[] to verify that the requested fields and wavelengths have corresponding data.
Input
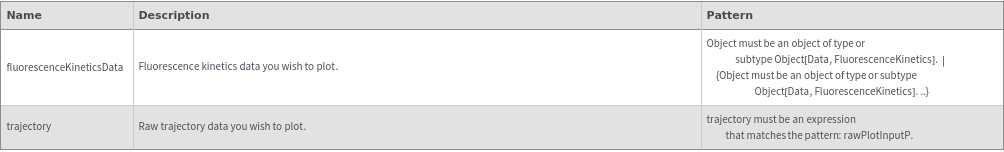
Output

Data Specifications Options
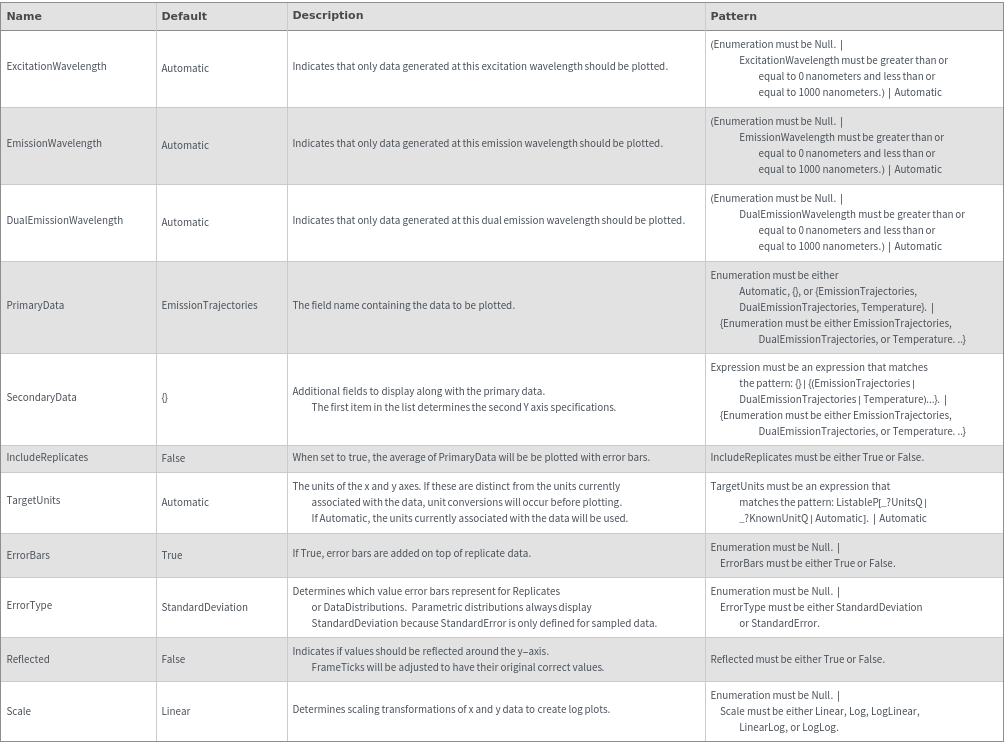
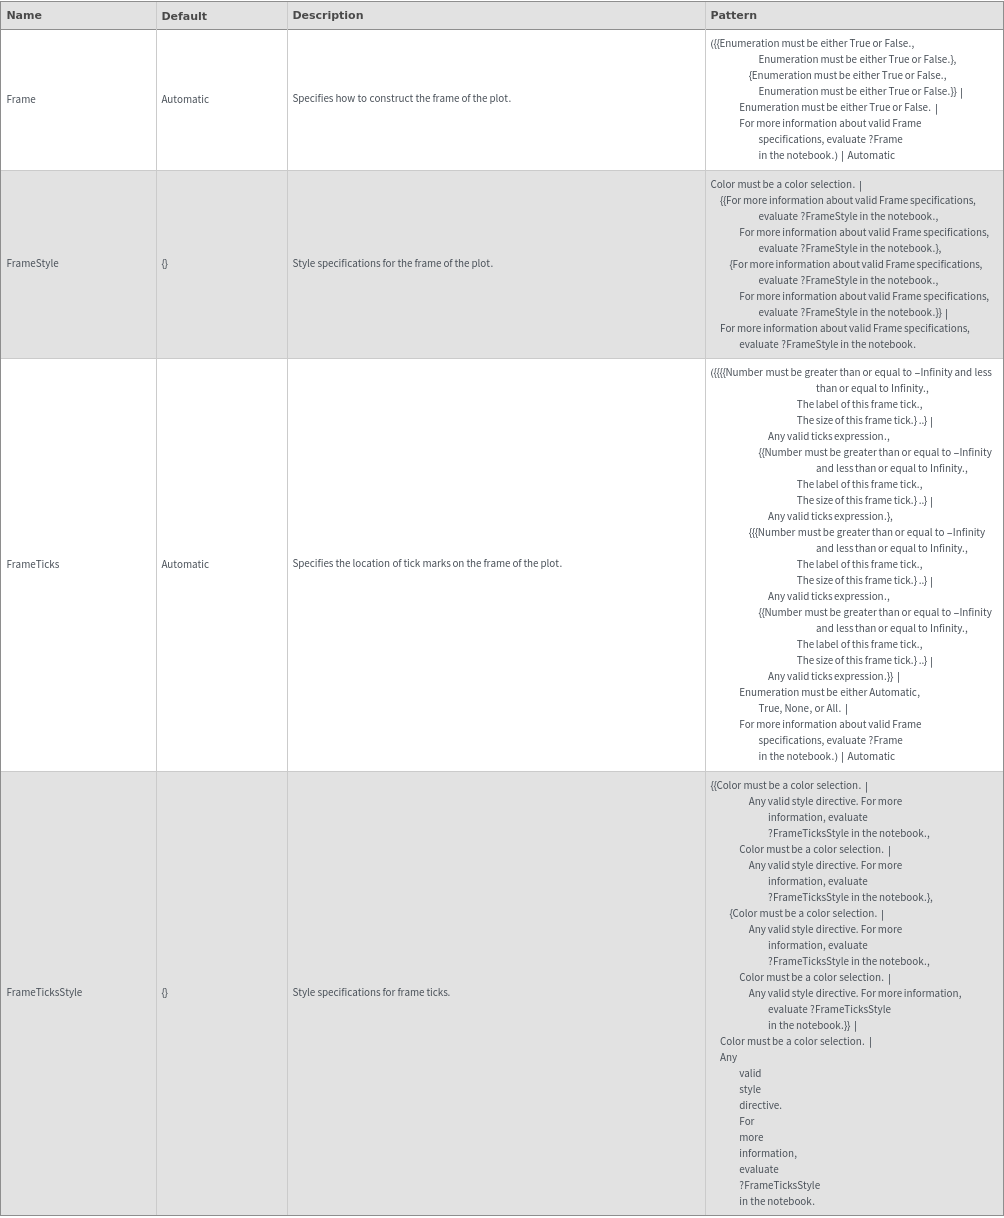
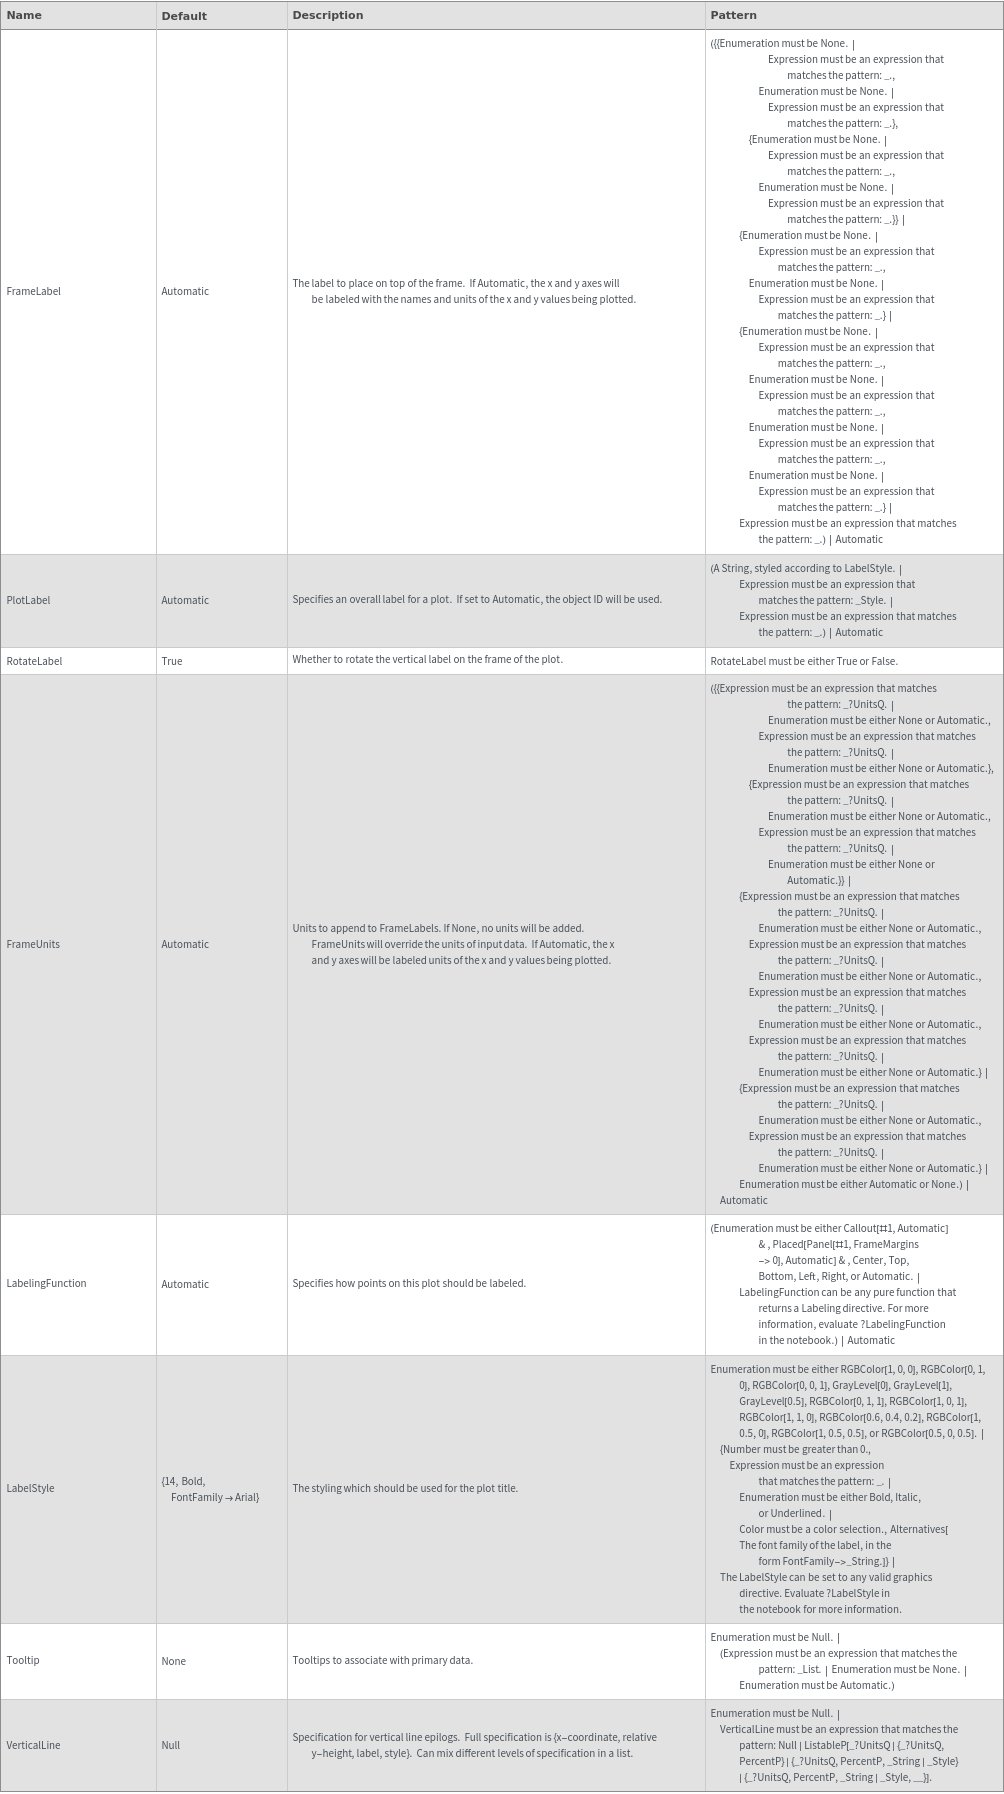
Frame Options
Grid Options
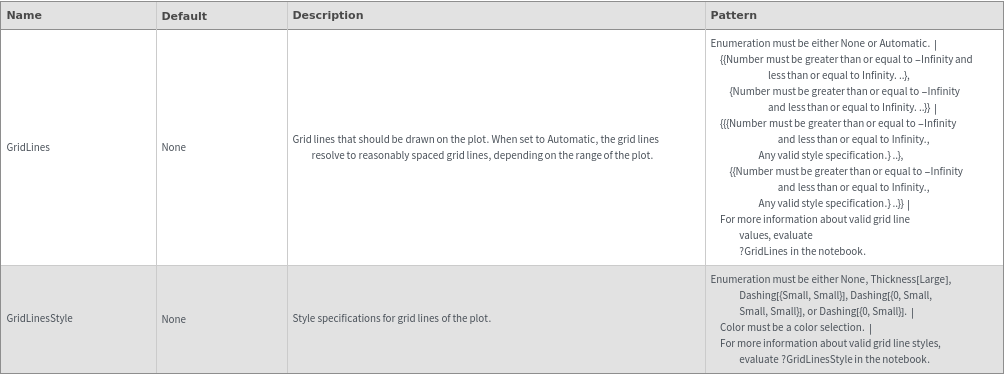
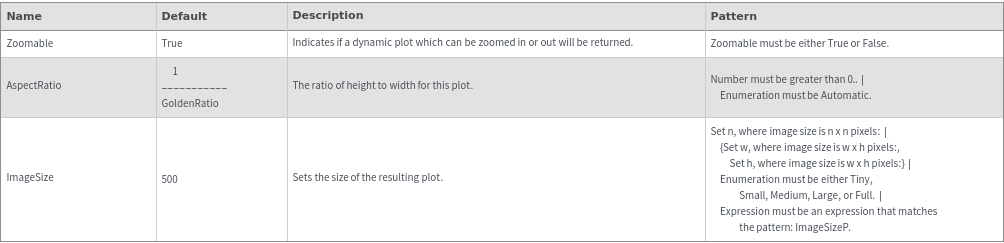
Image Format Options
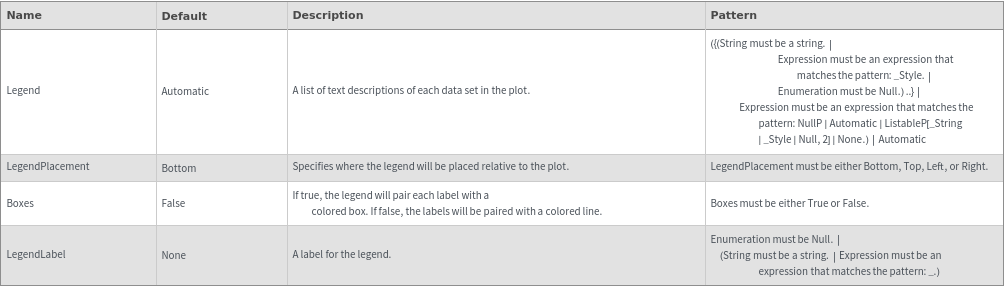
Legend Options
Plot Labeling Options
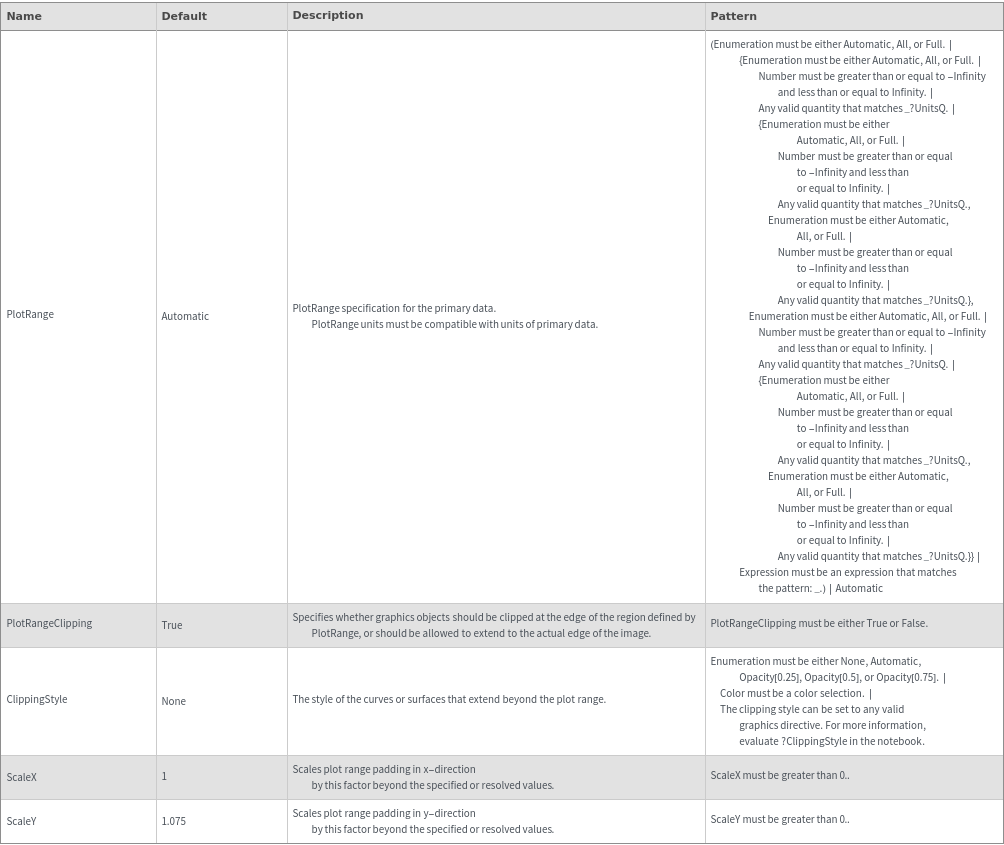
Plot Range Options
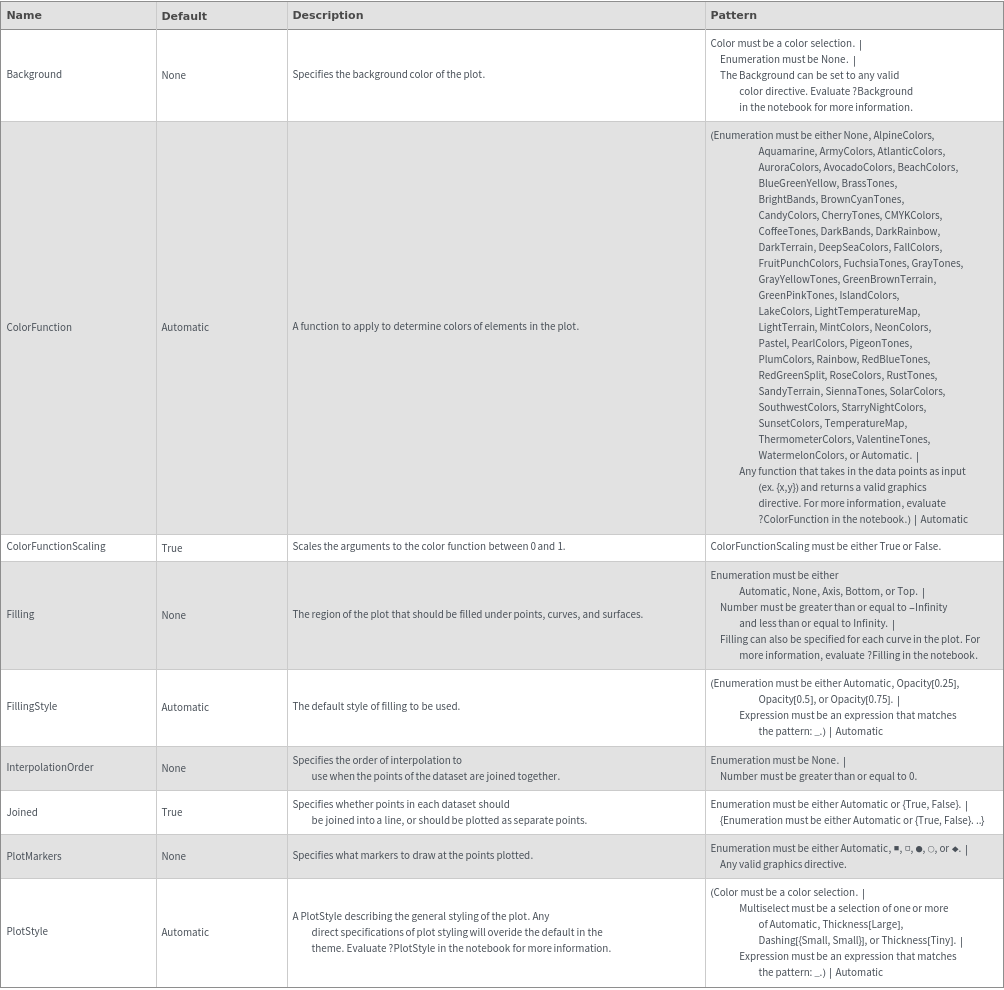
Plot Style Options
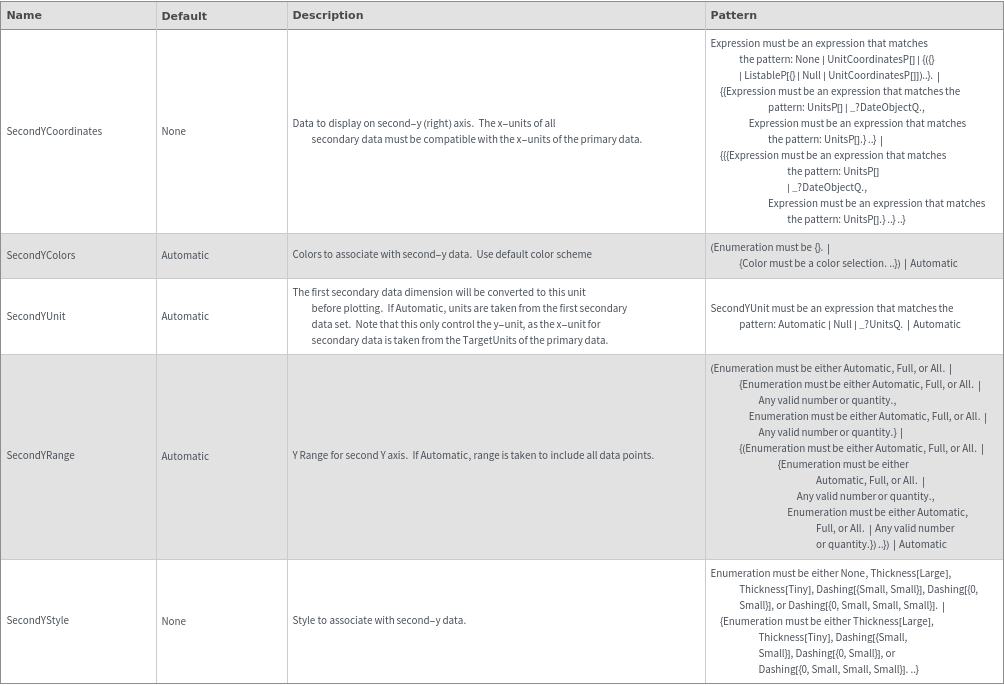
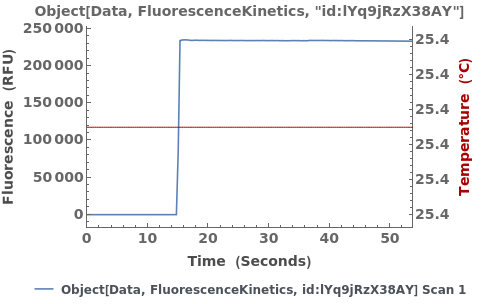
Secondary Data Options