PlotMassSpectrometry
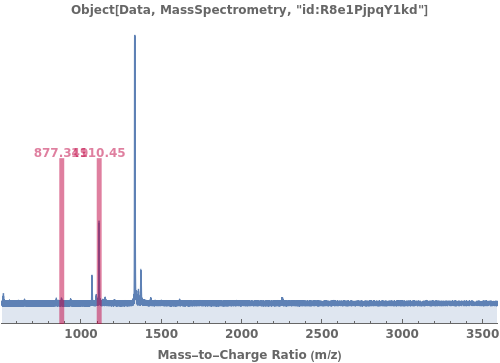
PlotMassSpectrometry[massSpectrometryData]⟹plot
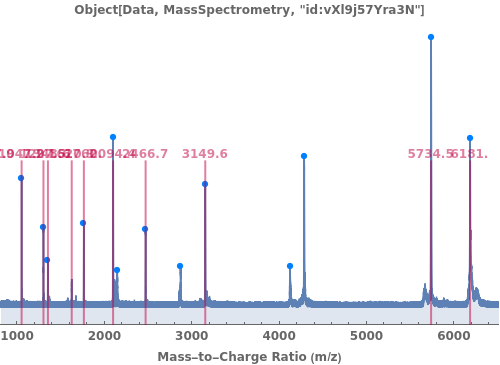
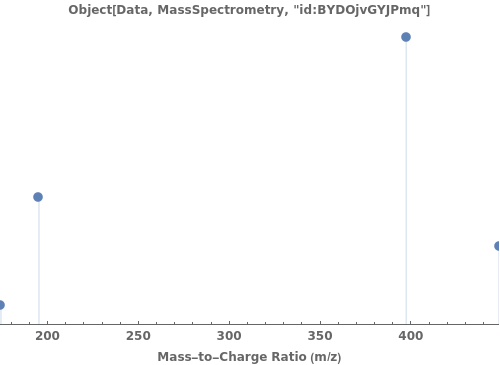
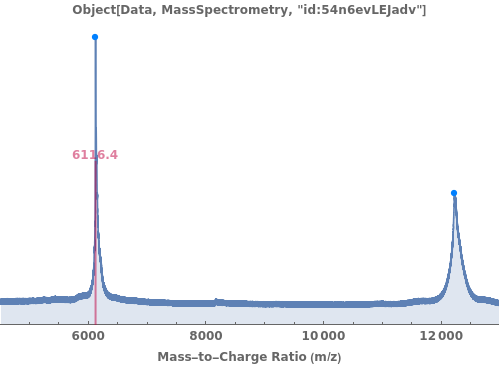
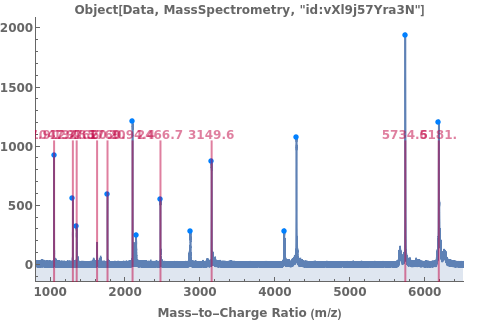
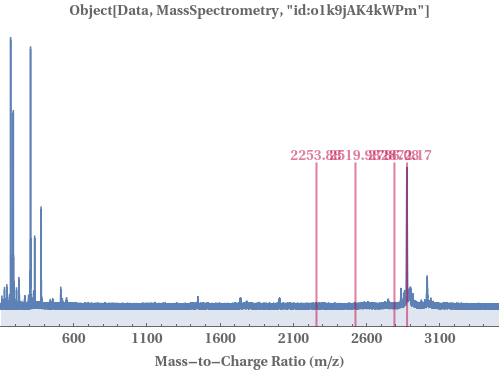
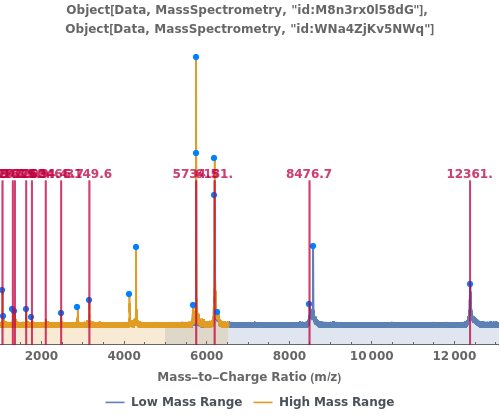
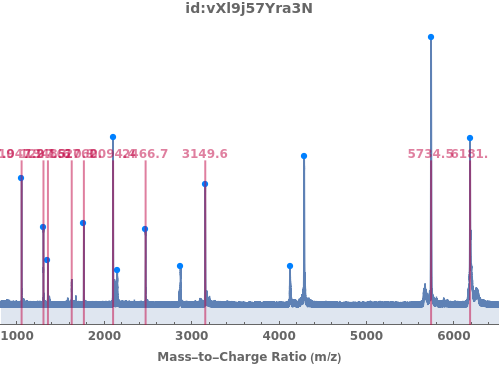
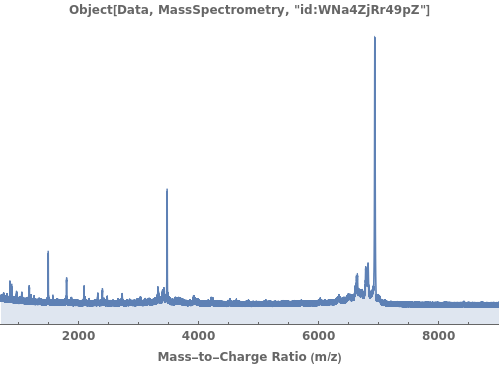
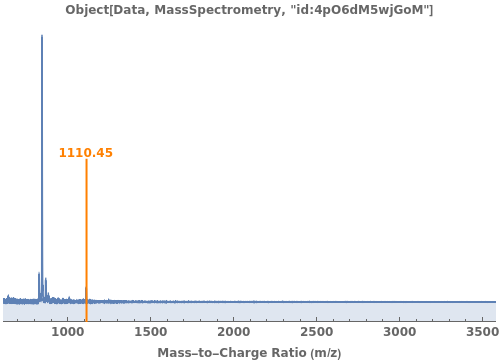
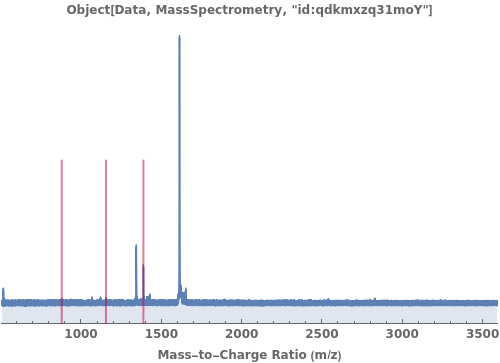
provides a graphical plot the provided mass spectra.
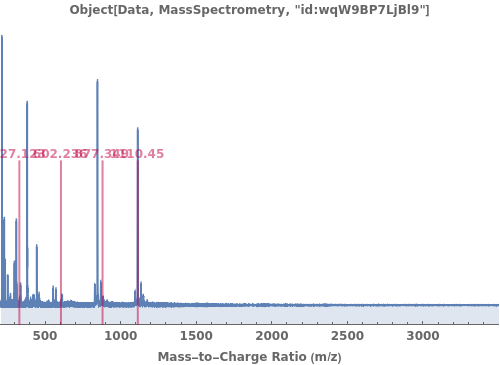
PlotMassSpectrometry[spectra]⟹plot
provides a graphical plot the provided mass spectra.
Details
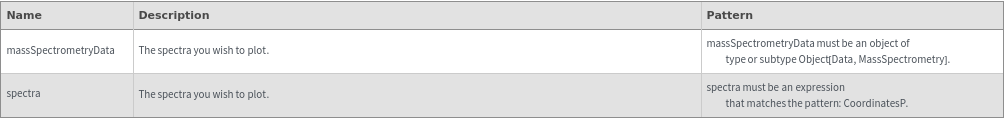
Input
Output

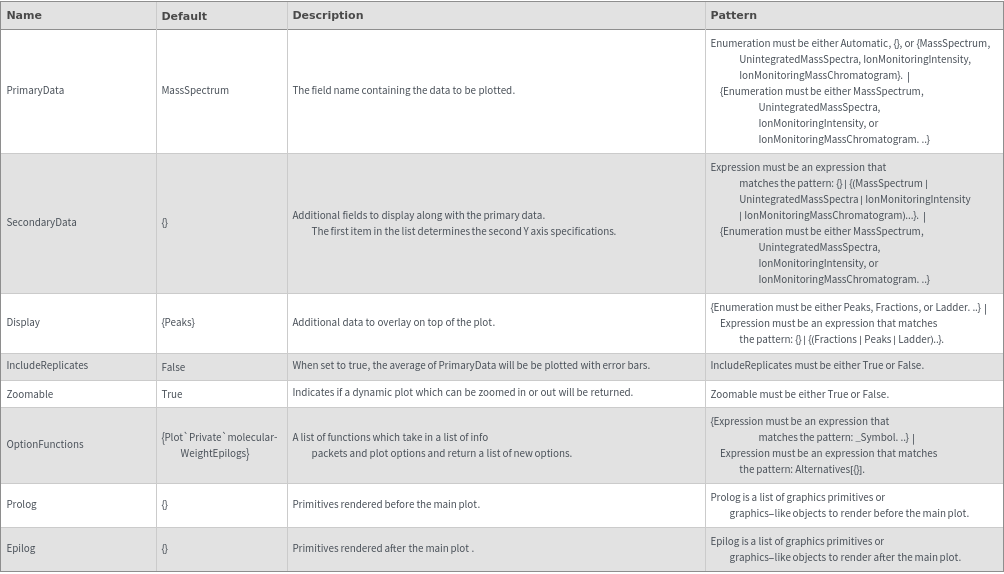
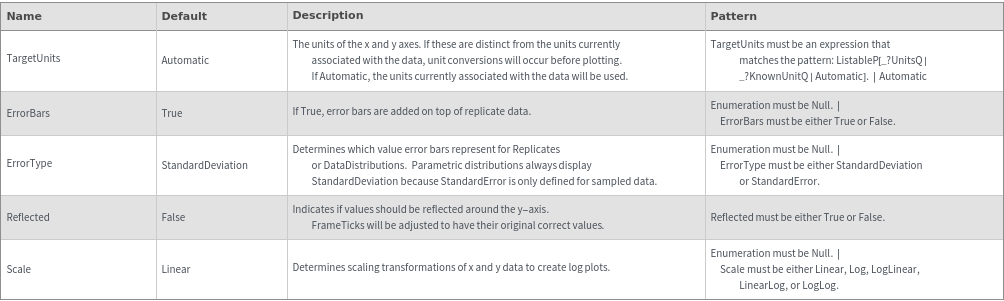
Data Specifications Options
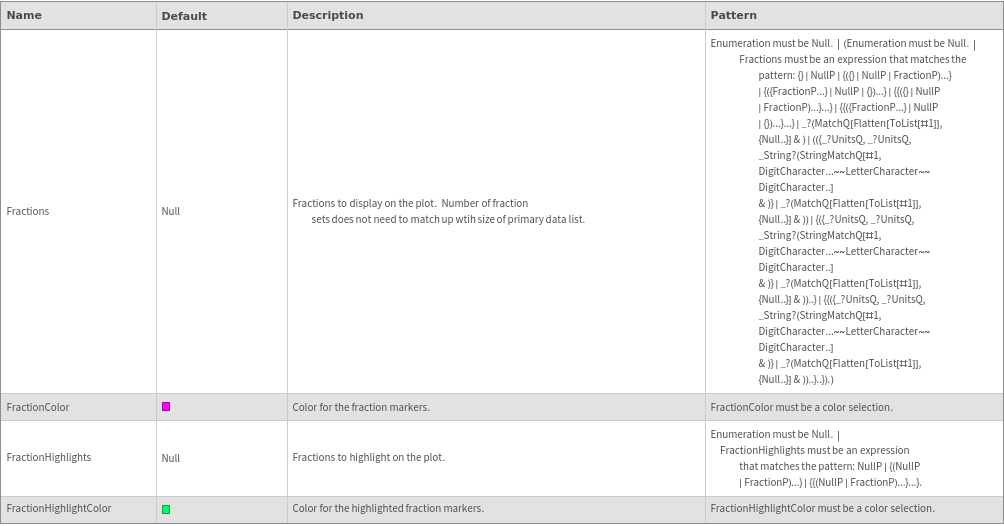
Fractions Options
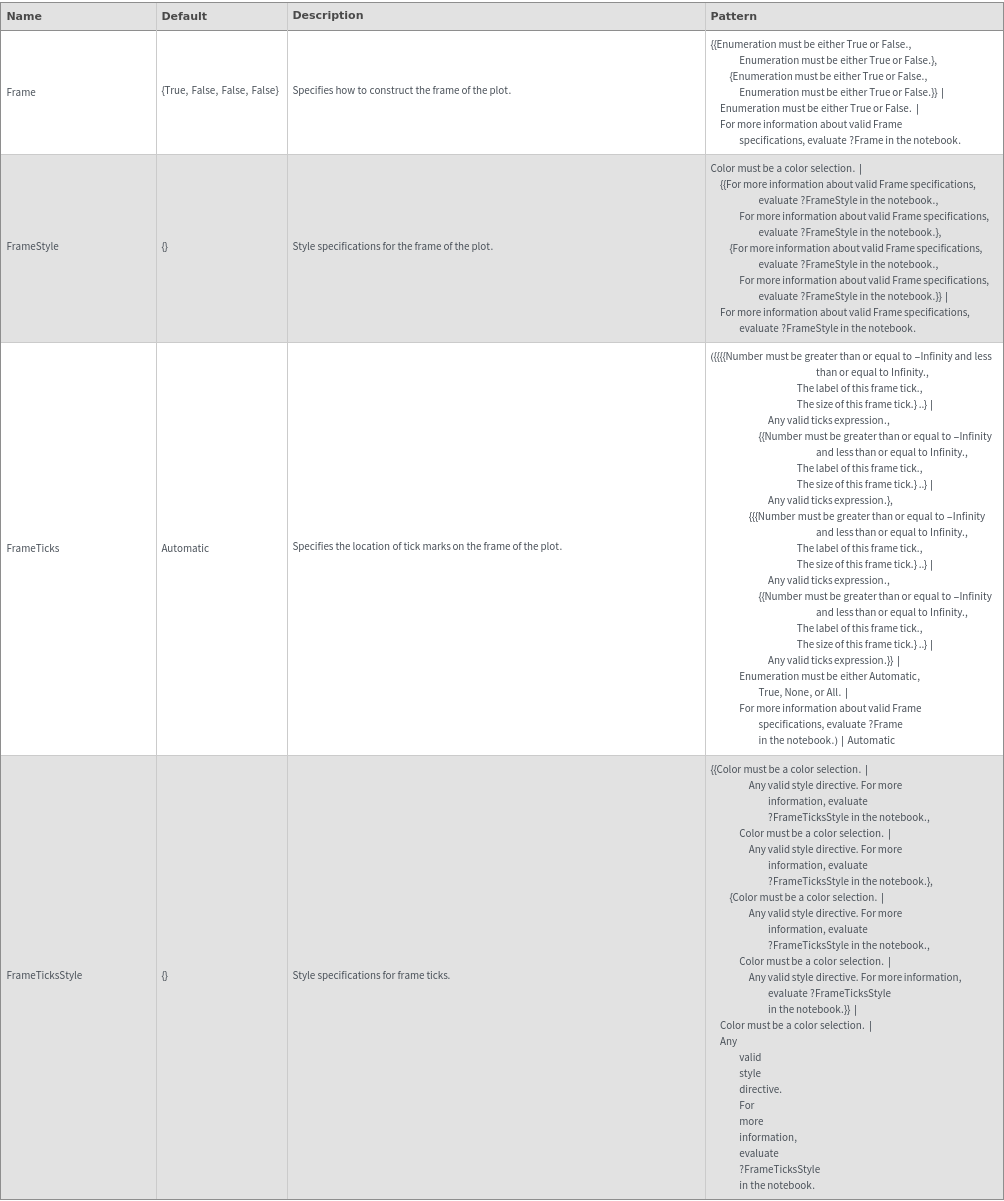
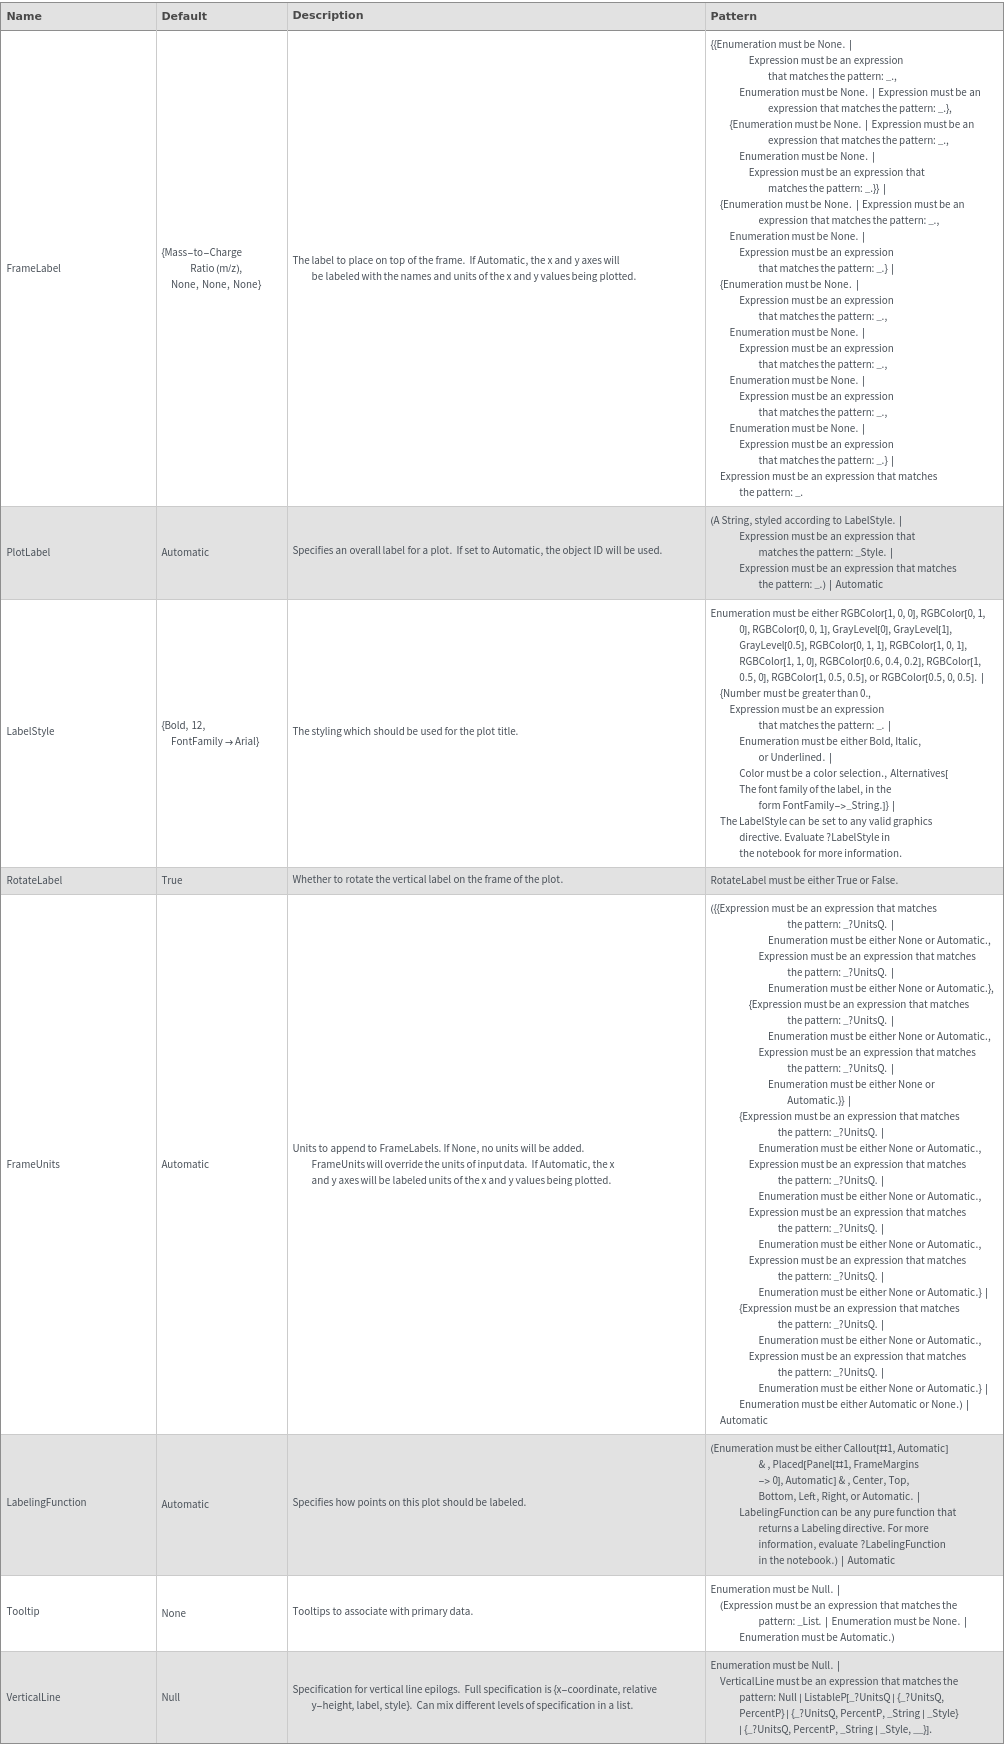
Frame Options
Grid Options
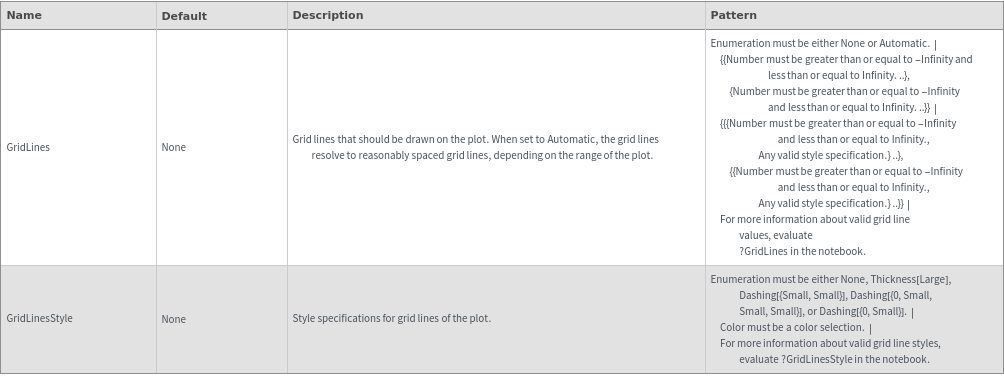
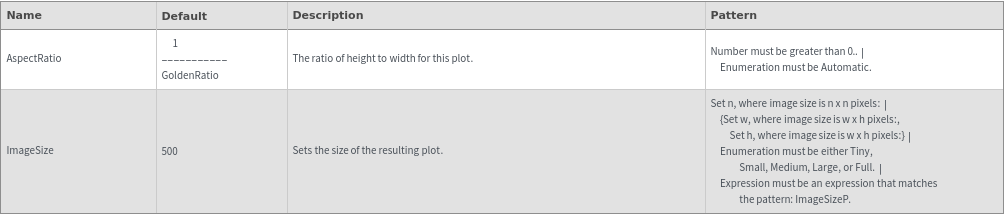
Image Format Options
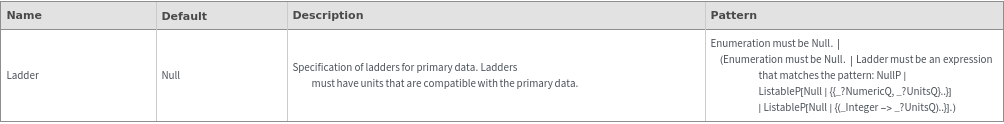
Ladder Options
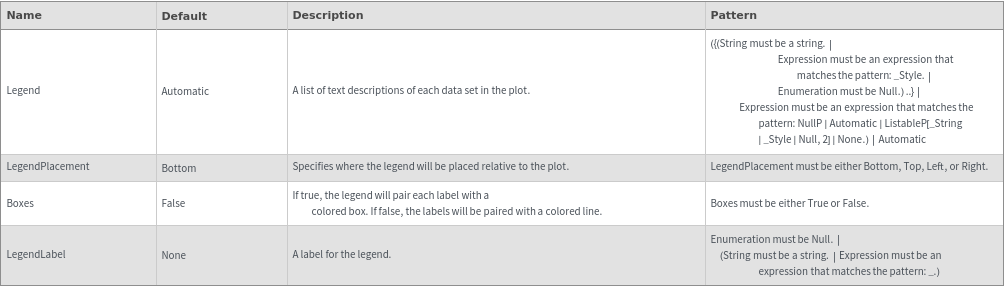
Legend Options
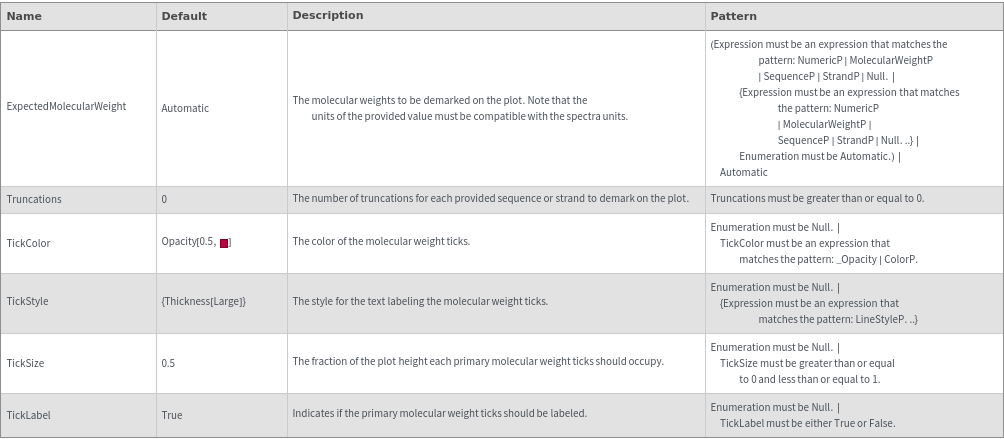
MolecularWeightEpilog Options
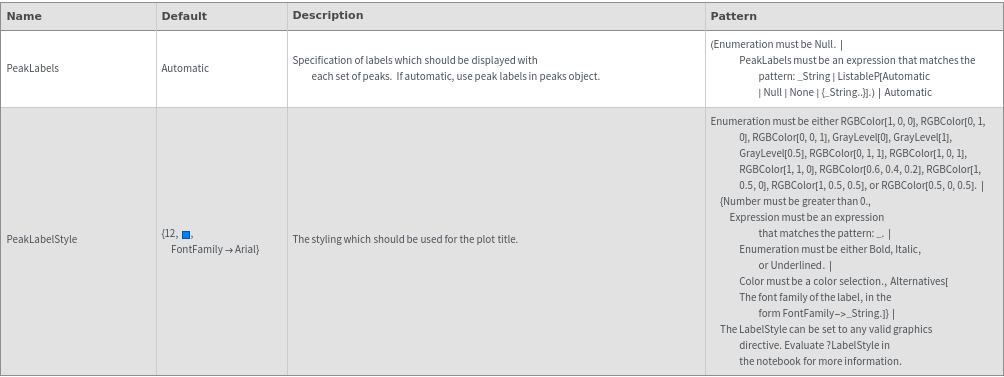
Peaks Options
Plot Labeling Options
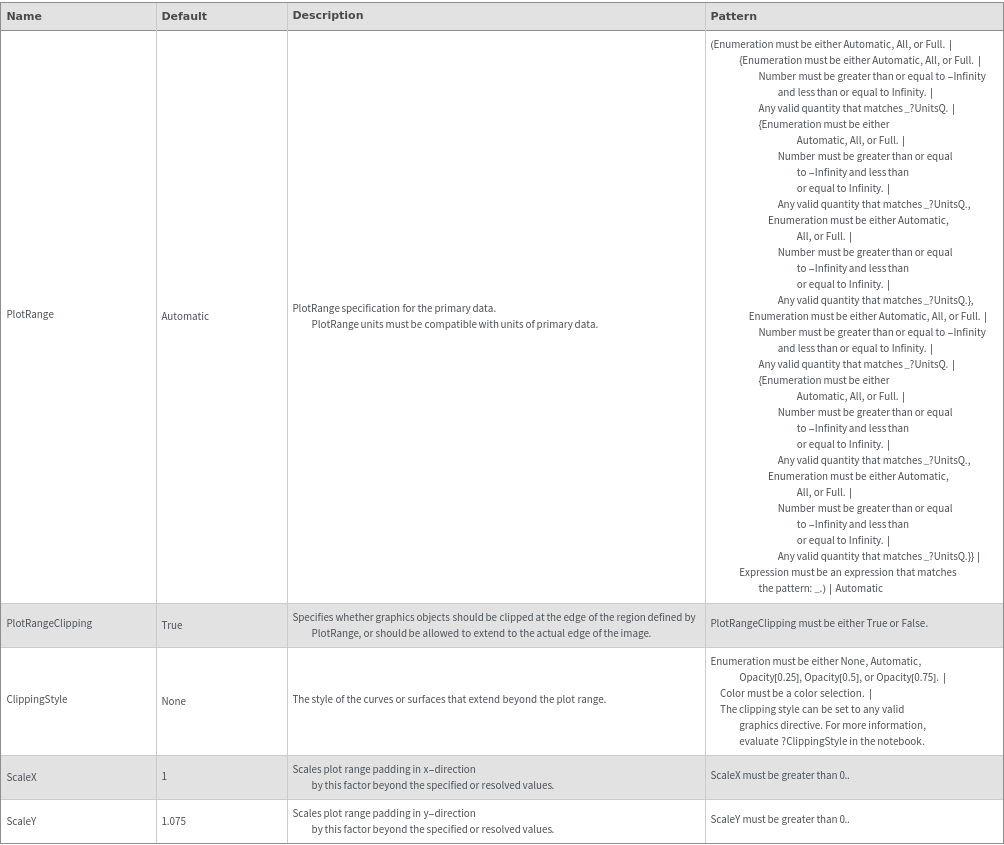
Plot Range Options
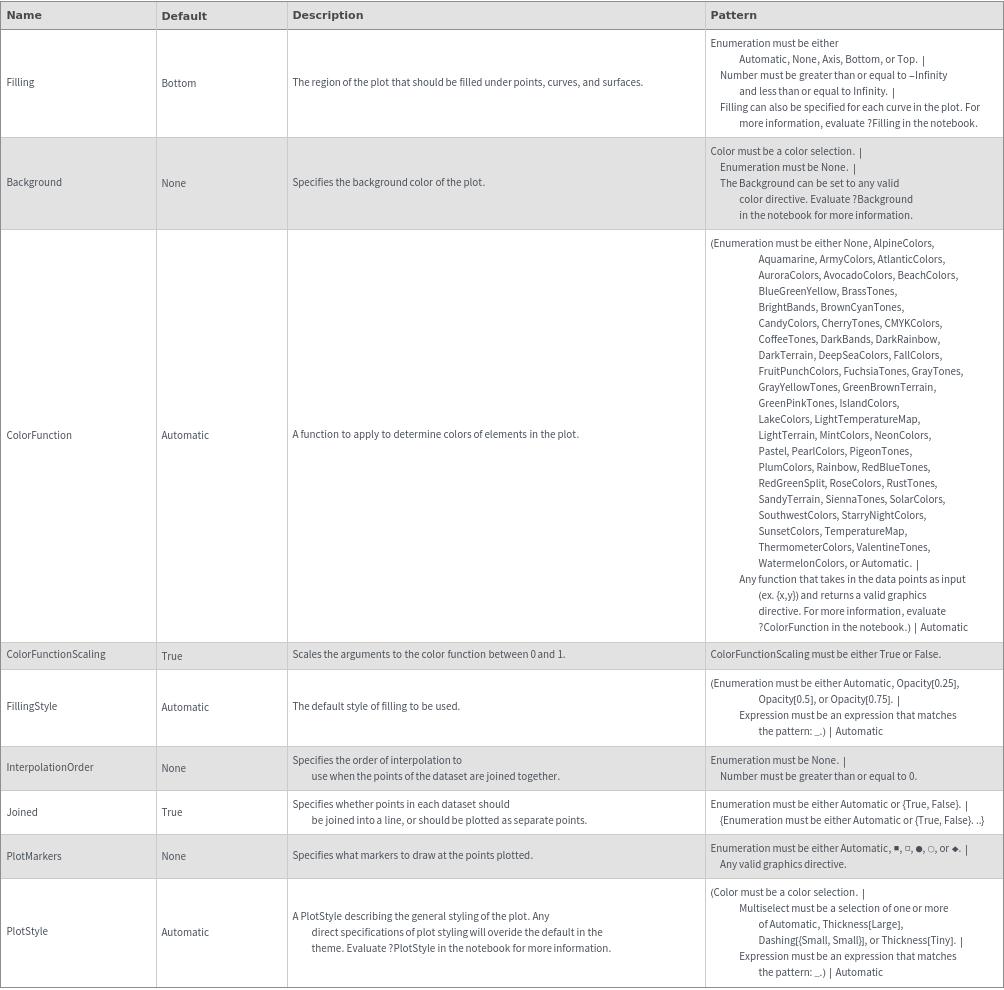
Plot Style Options
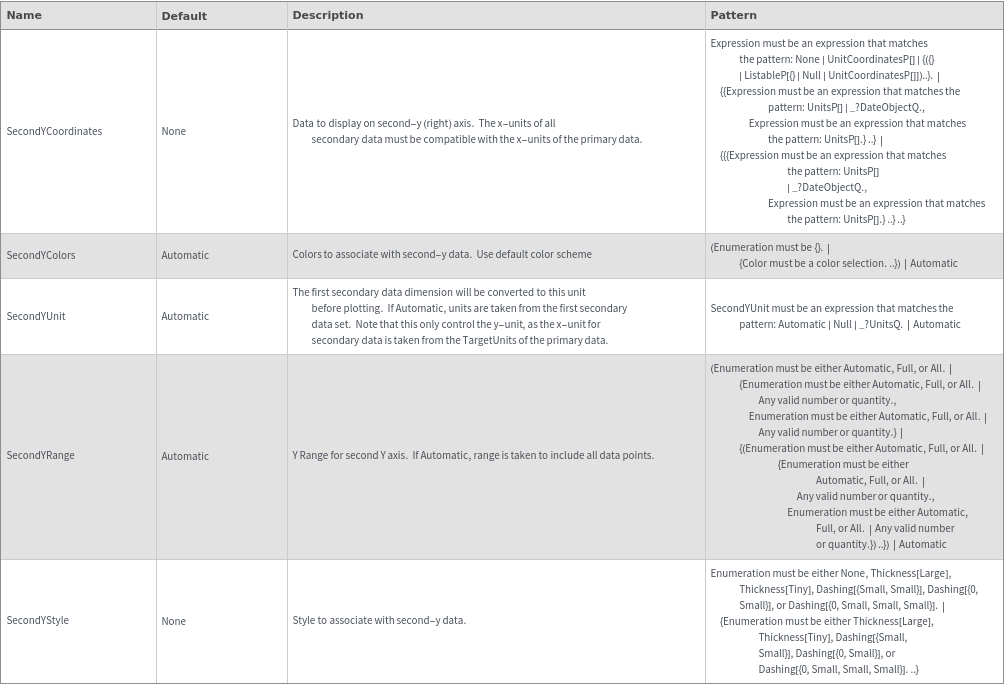
Secondary Data Options
General Options