PlotQuantificationCycle
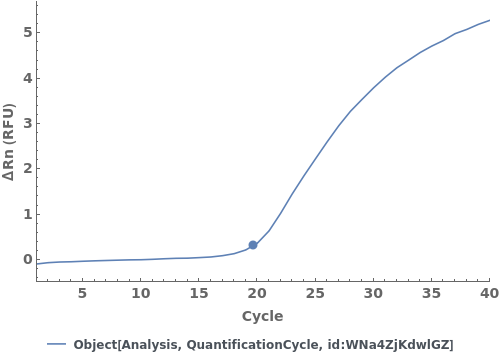
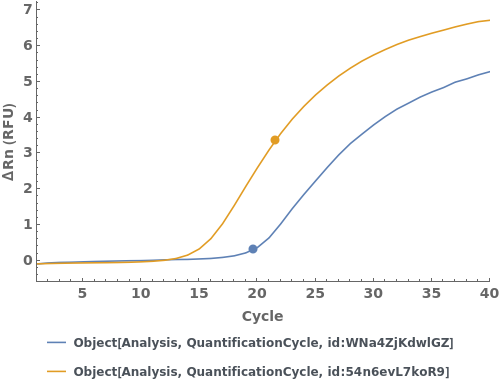
PlotQuantificationCycle[quantificationCycles]⟹fig
plots the normalized and baseline-subtracted amplification curve and quantification cycle from each quantification cycle analysis object in quantificationCycles.
Details
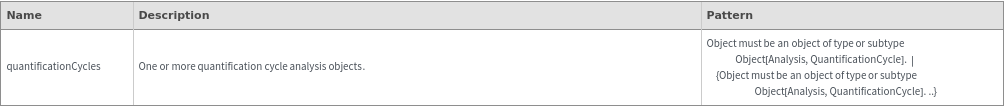
Input
Output

Data Specifications Options
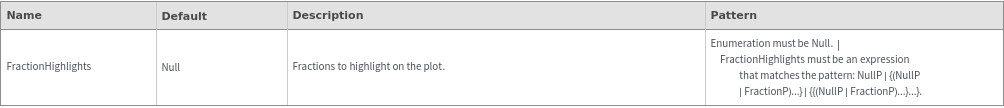
Fractions Options
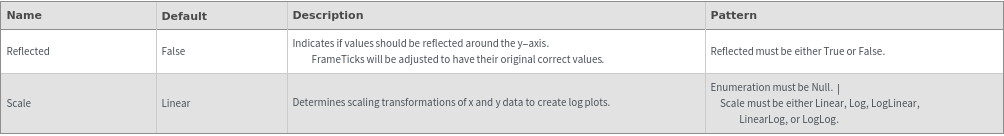
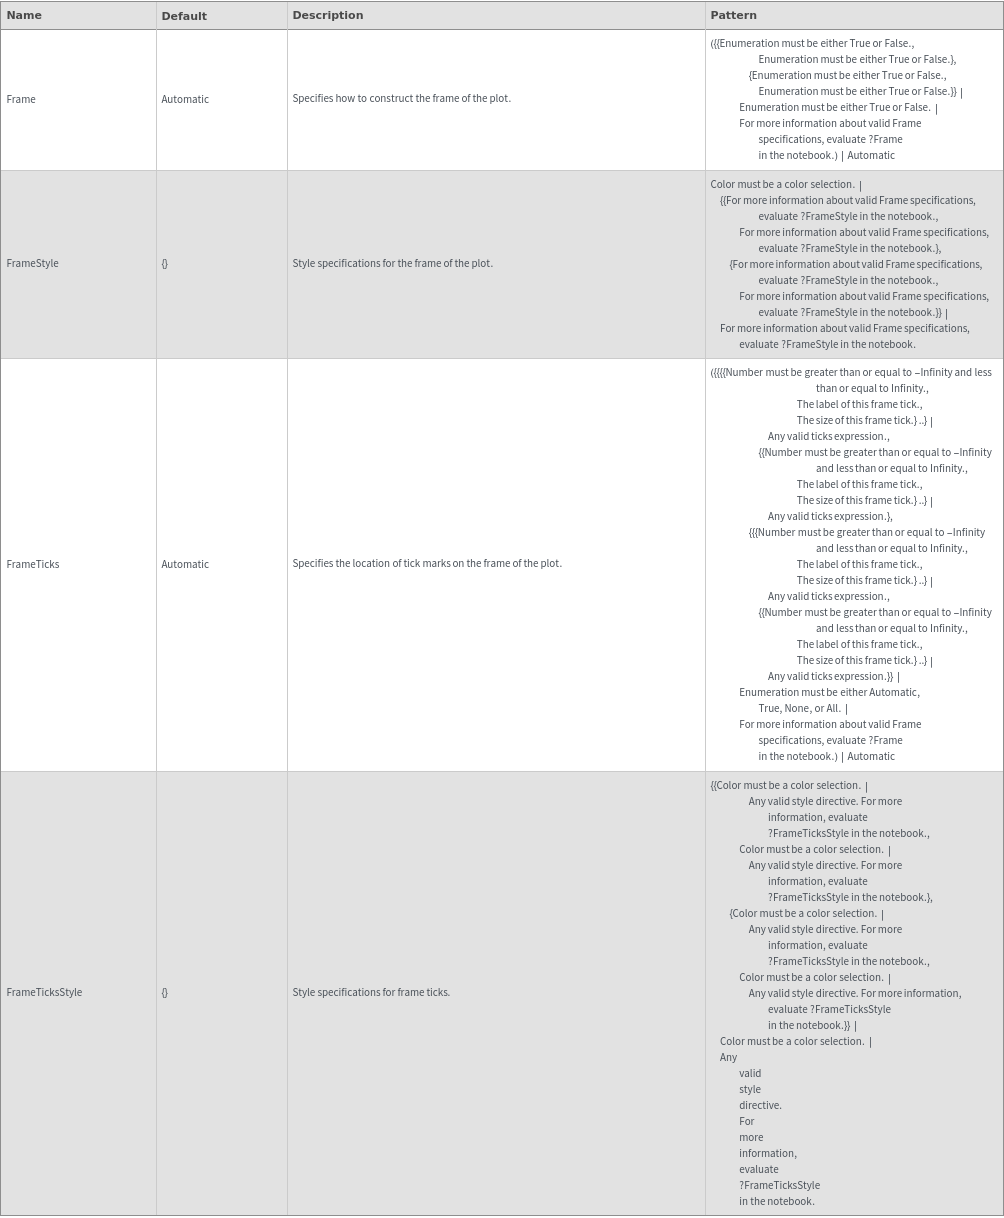
Frame Options
Grid Options
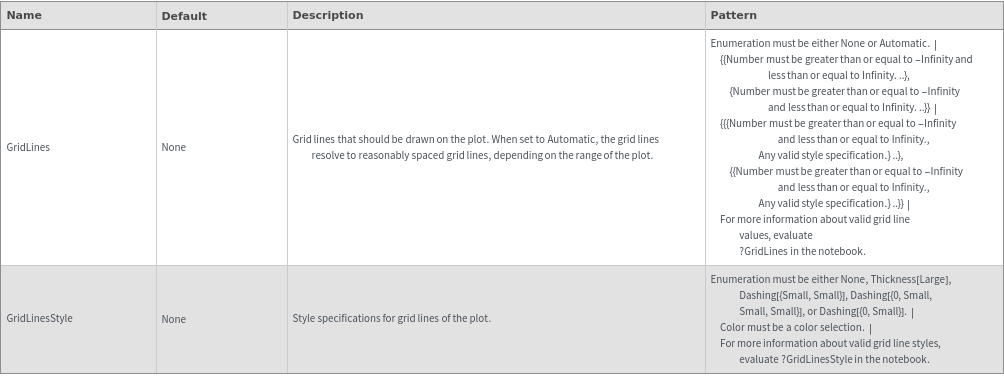
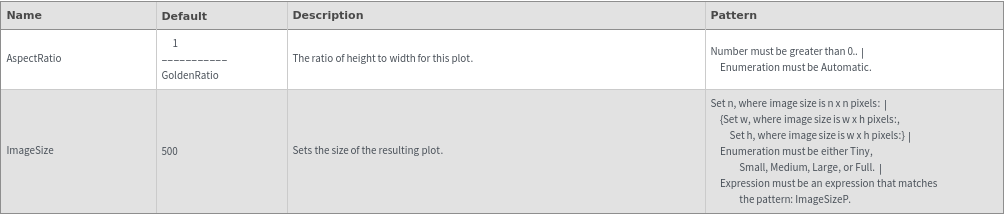
Image Format Options
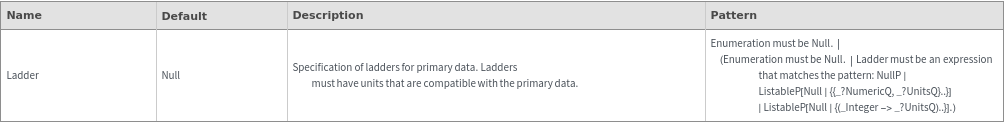
Ladder Options
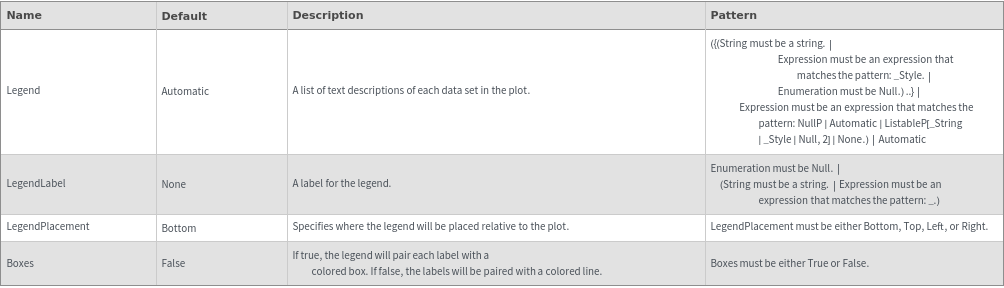
Legend Options
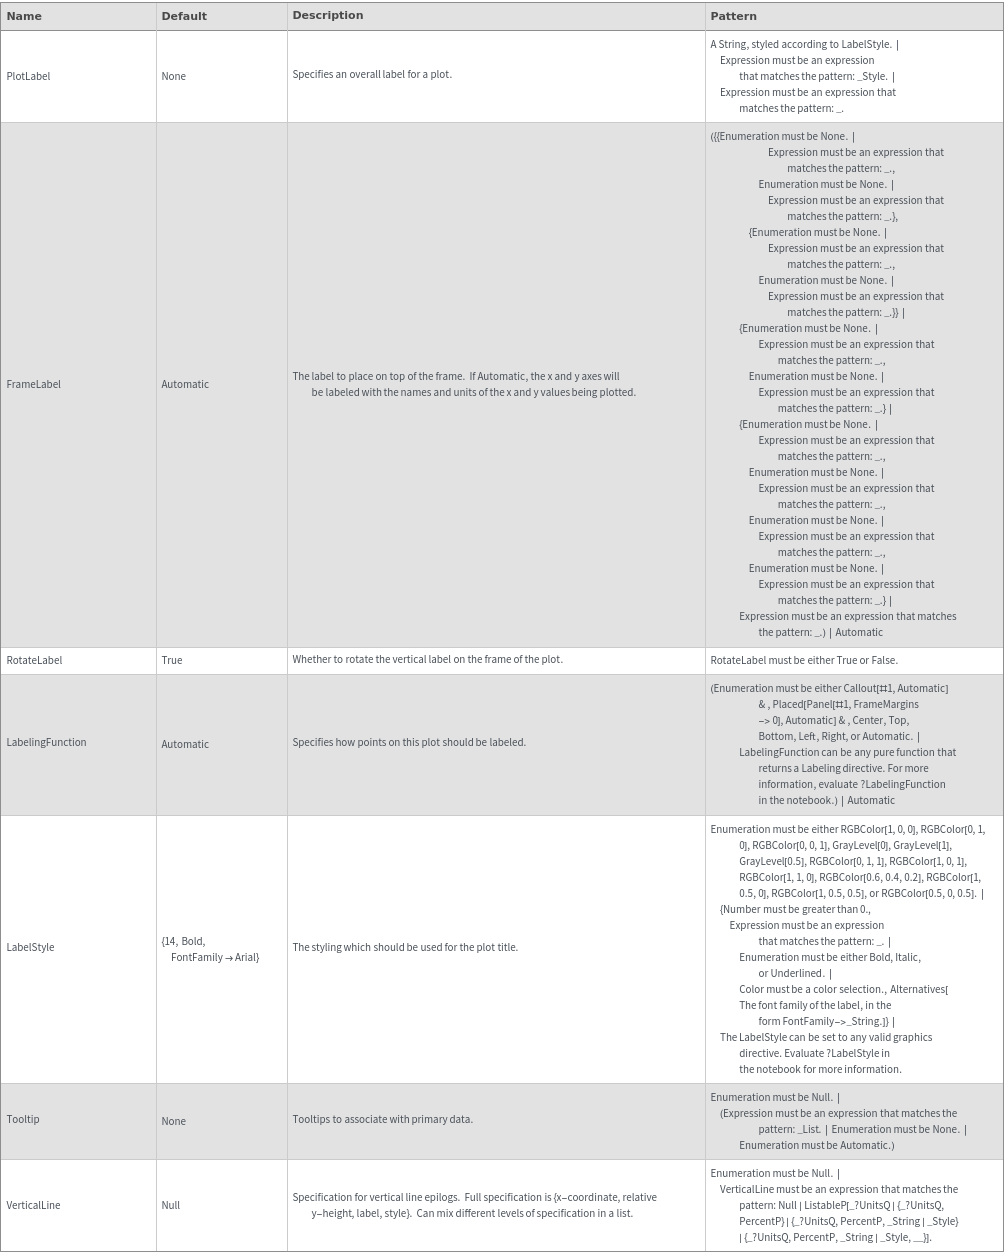
Plot Labeling Options
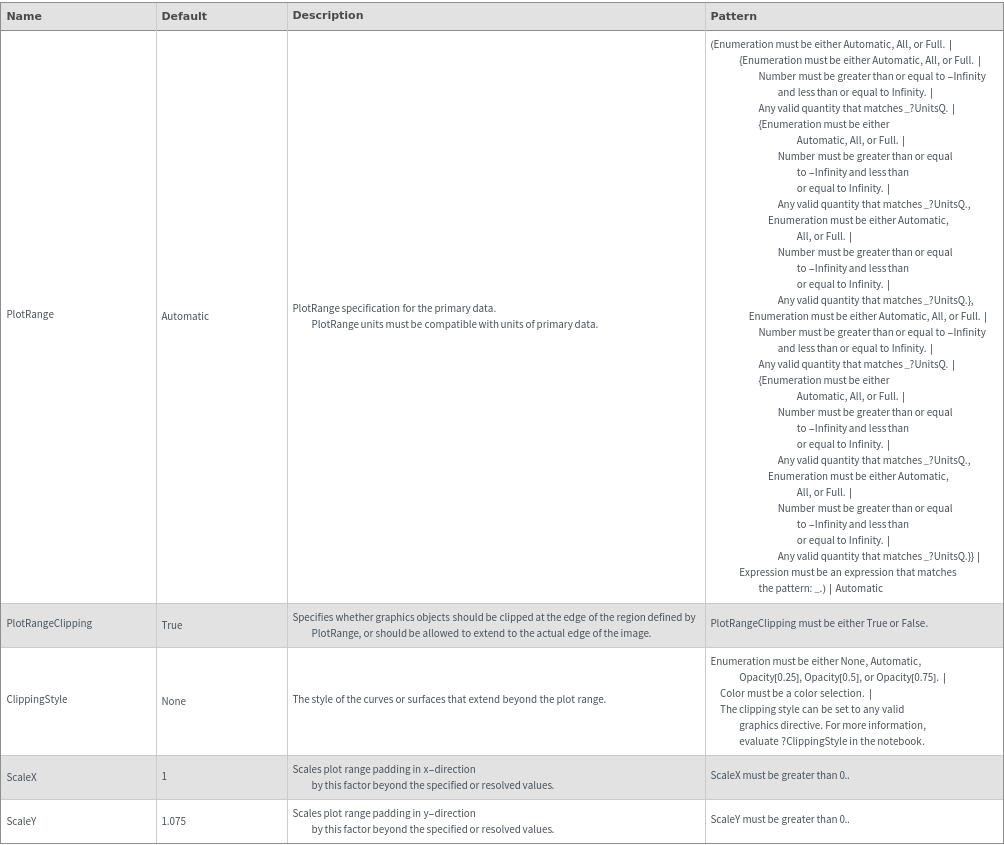
Plot Range Options
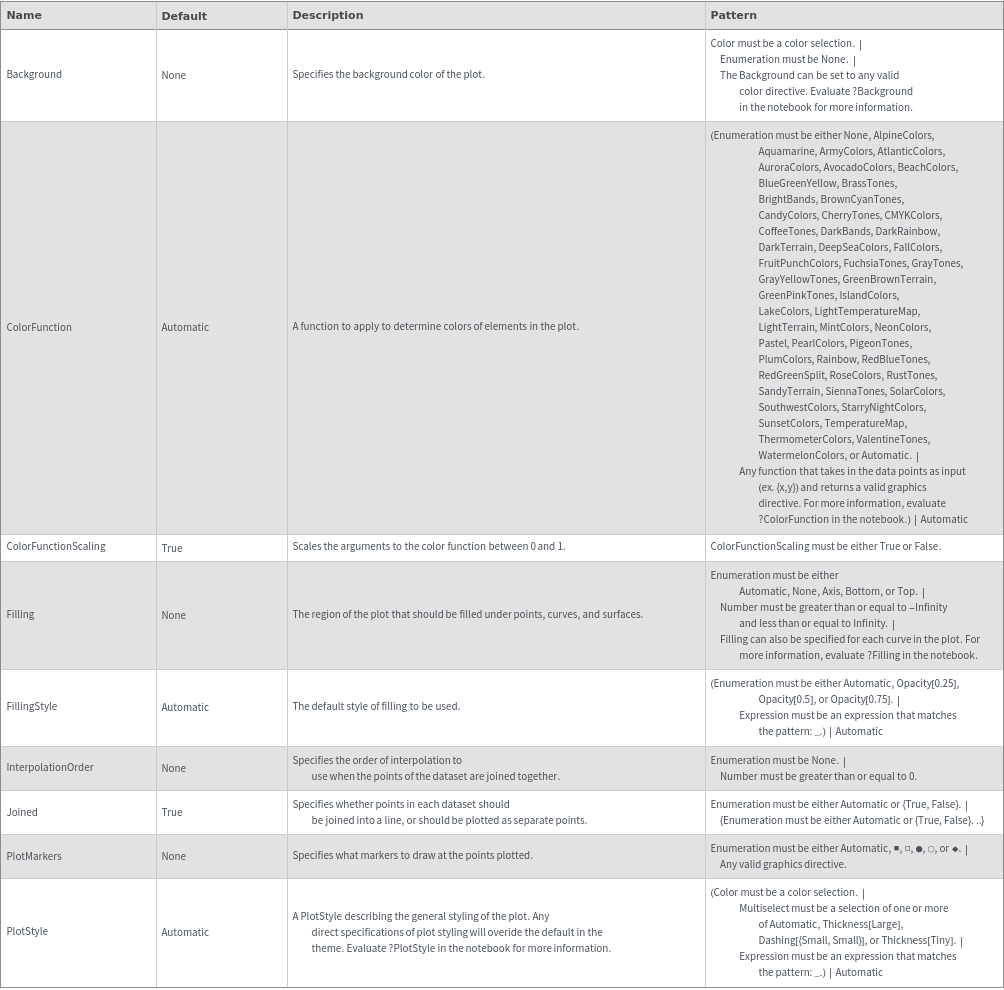
Plot Style Options
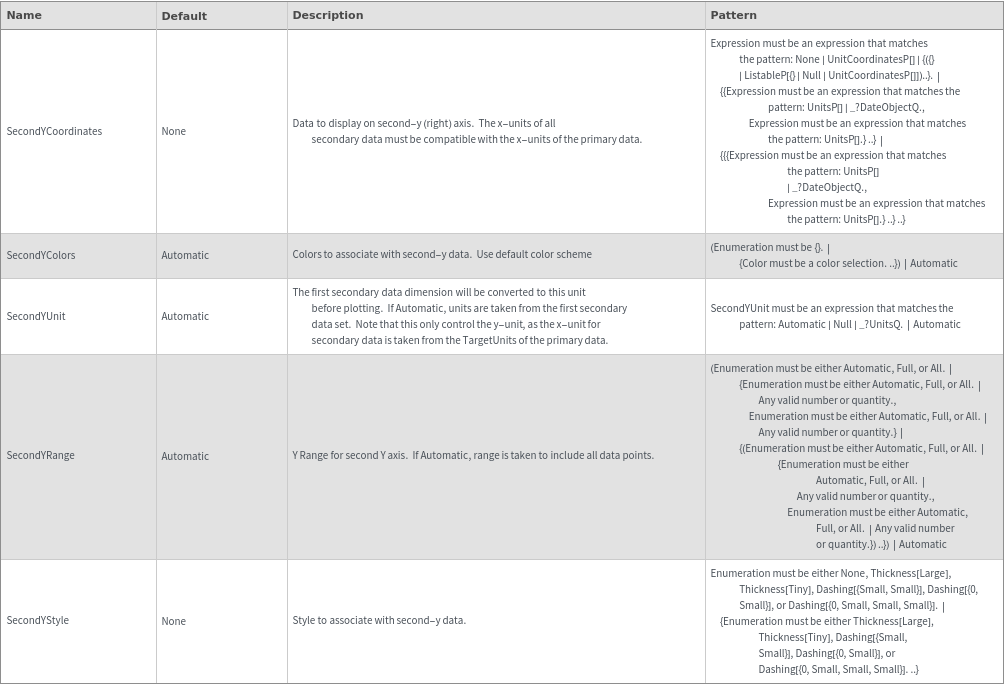
Secondary Data Options
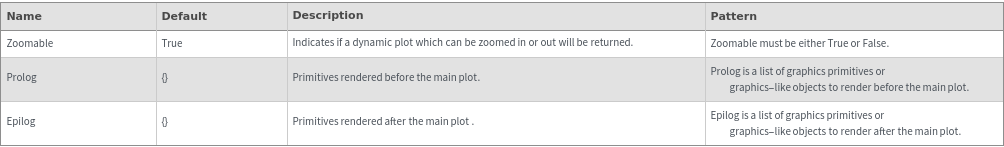
General Options