PlotSupportTimeline
PlotSupportTimeline[]⟹SummaryFigure
displays the average number of troubleshooting tickets for all protocols for the last month with a one day interval.
PlotSupportTimeline[Protocol]⟹ProtocolSummaryFigure
displays the average number of troubleshooting tickets for a given protocol over the last month with a one day interval.
PlotSupportTimeline[TimeSpan]⟹SpanningFigure
displays the average number of troubleshooting tickets for all protocols over TimeSpan with a bin size based on the amount of time to be displayed.
PlotSupportTimeline[Protocol,TimeSpan]⟹ProtocolFigure
displays the average number of troubleshooting tickets for a given protocol over TimeSpan with a bin size based on the amount of time to be displayed.
Details
-
PlotSupportTimeline[timeSpan,bin] figure {_Legended} displays the average number of troubleshooting tickets for all protocols during 'timeSpan' with an interval of 'bin'. PlotSupportTimeline[protocol,timeSpan,bin] figure {_Legended} displays the average number of troubleshooting tickets for a given protocol during 'timeSpan' with interval 'bin' for a given protocol. PlotSupportTimeline[startTime,endTime,bin] figure {_Legended} displays the average number of troubleshooting tickets for all protocols from 'startTime' to 'endTime' with an interval of 'bin'. PlotSupportTimeline[protocol,startTime,endTime,bin] figure {_Legended} displays the average number of troubleshooting tickets for a given protocol from 'startTime' to 'endTime' with interval of 'bin'. -
NoProtocols No completed protocols could be found within the specified time period. If you aren't already doing so you may want to specify the exact dates of interest using PlotSupportTimeline[(protocol), startDate, endDate, bin].
Additional Definitions
Input

Output

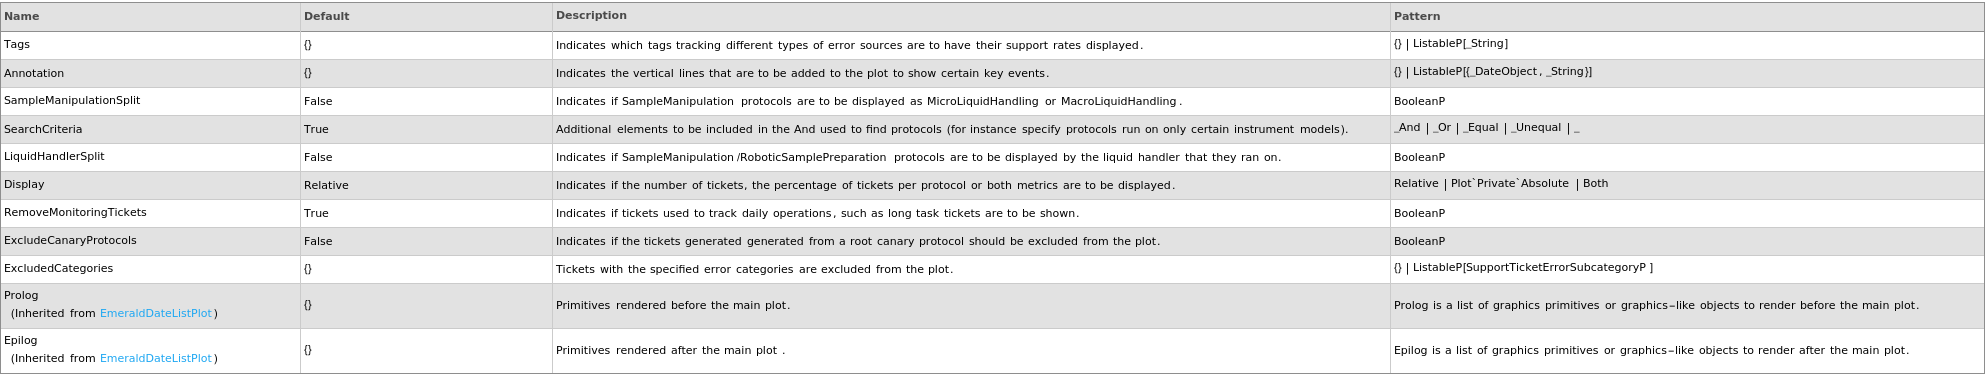
Data Specifications Options
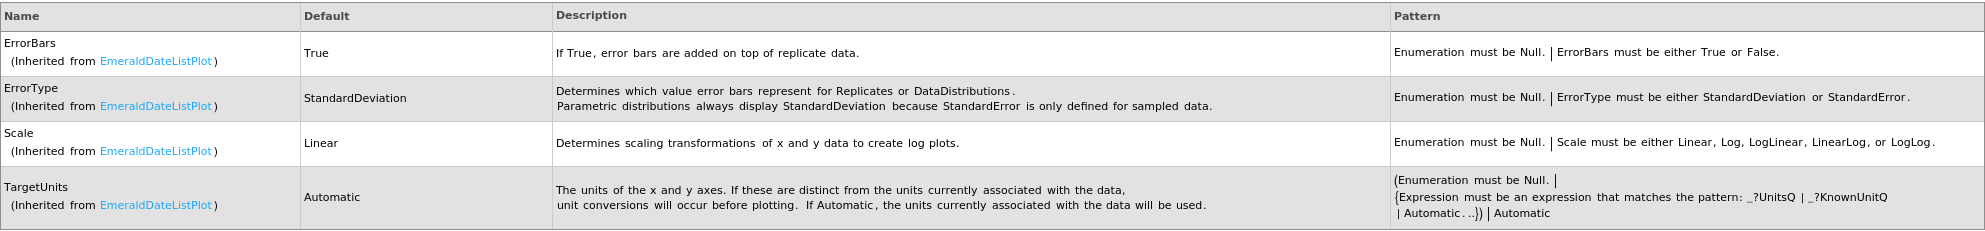
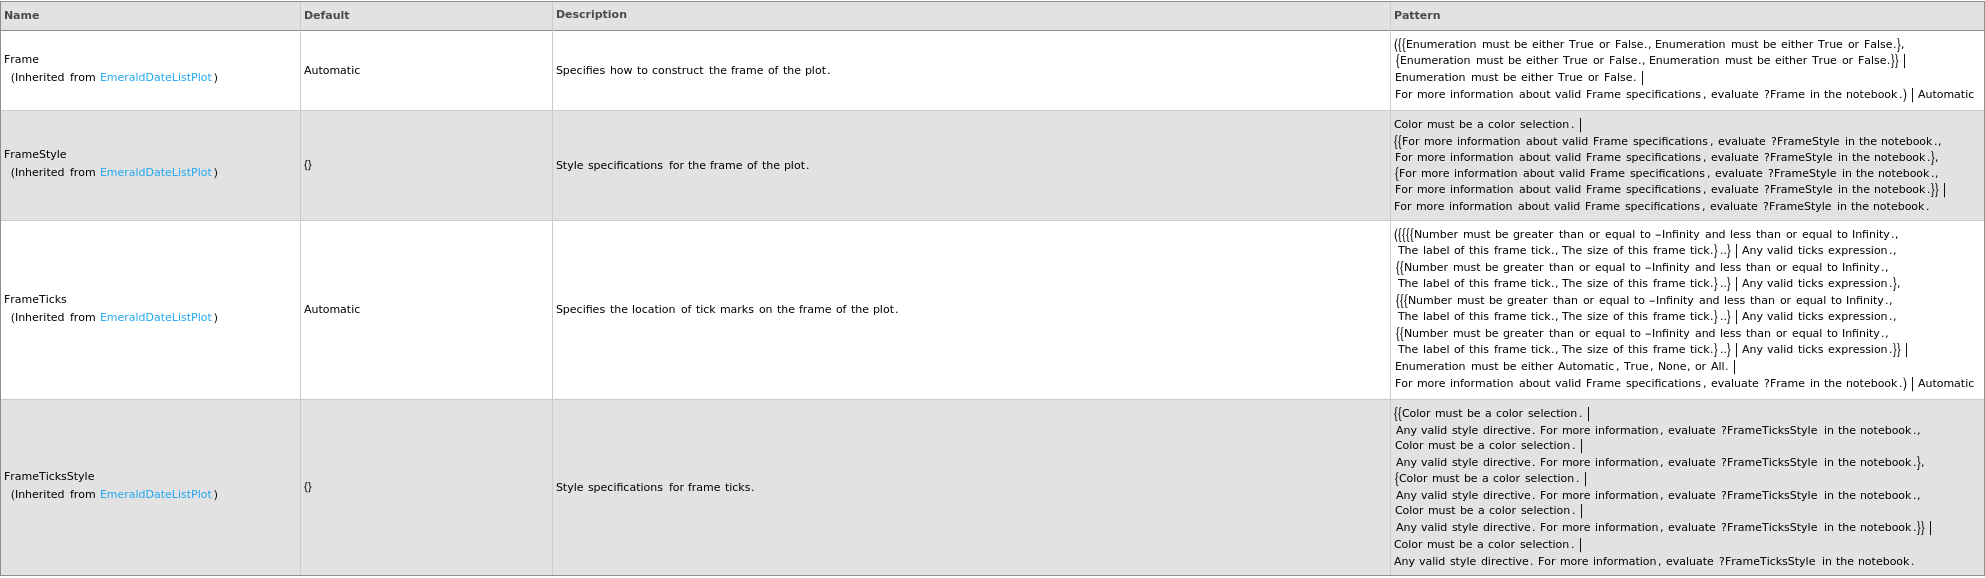
Frame Options
Grid Options
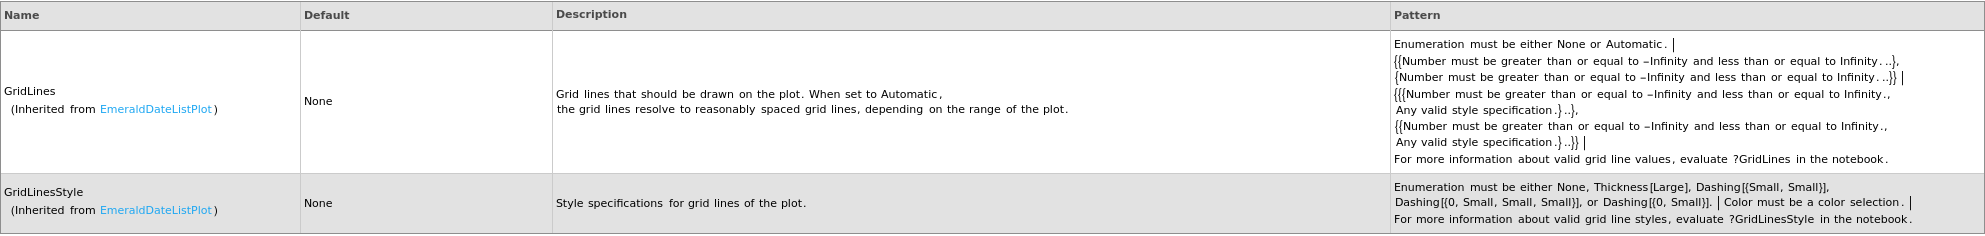
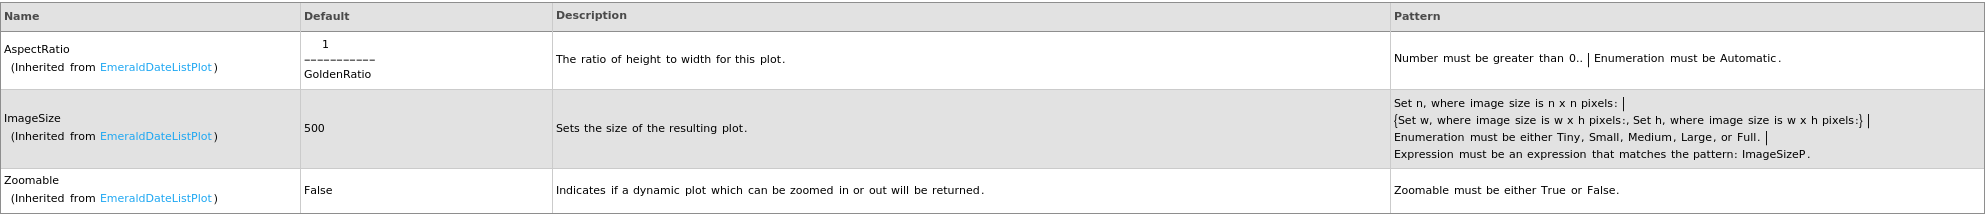
Image Format Options
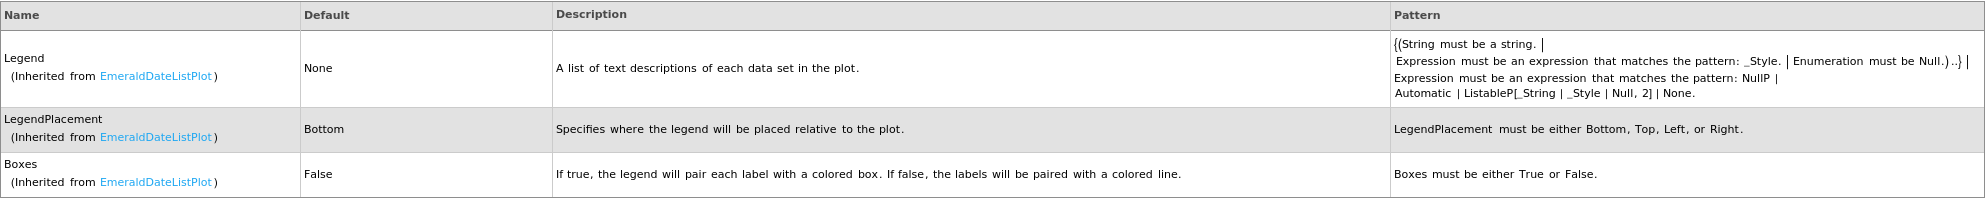
Legend Options
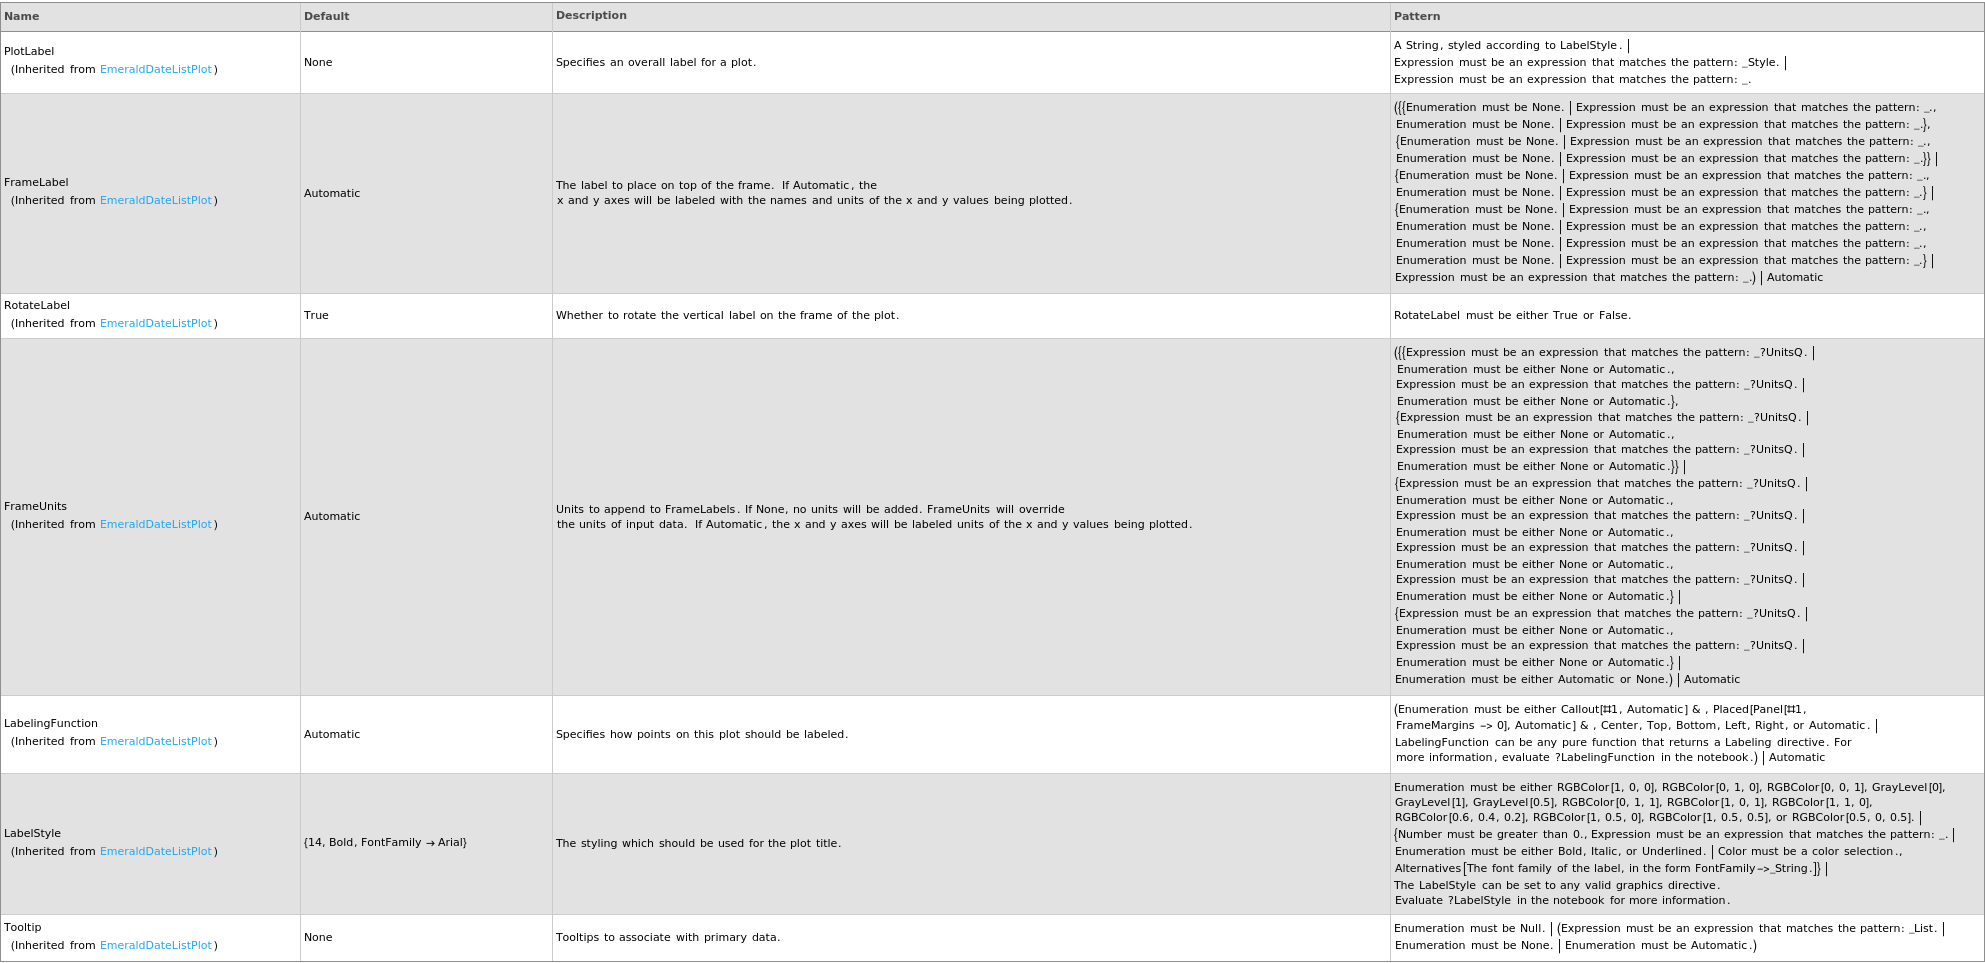
Plot Labeling Options
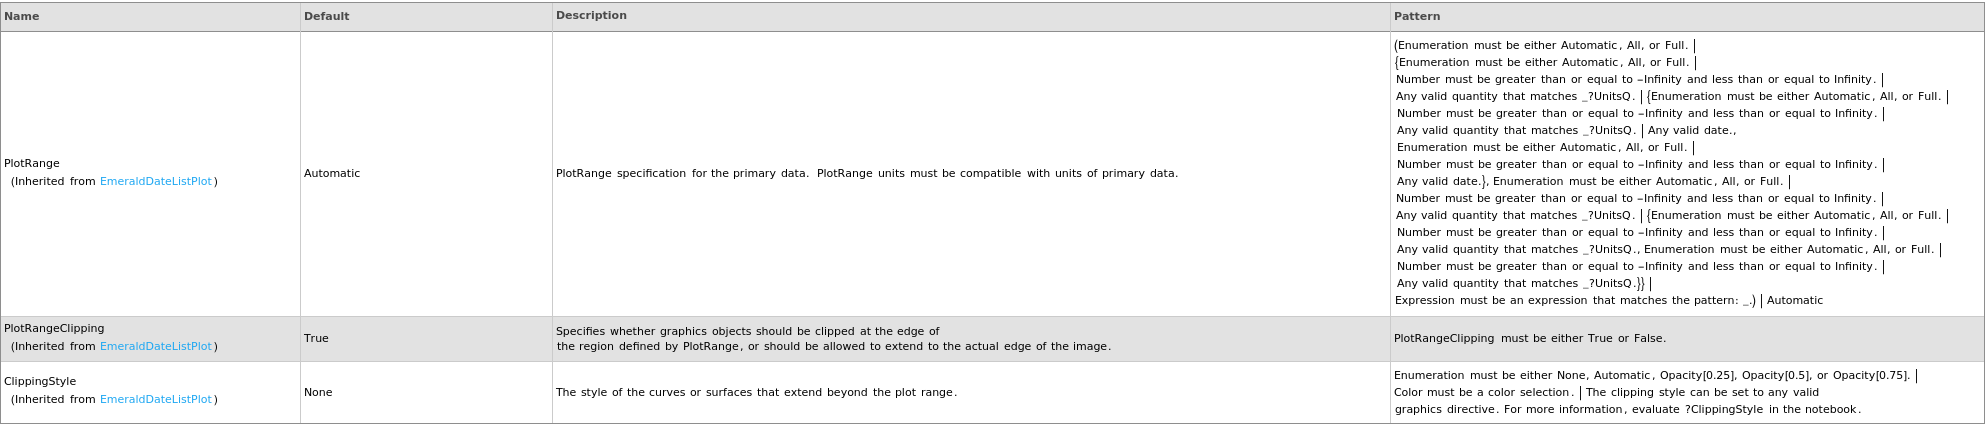
Plot Range Options
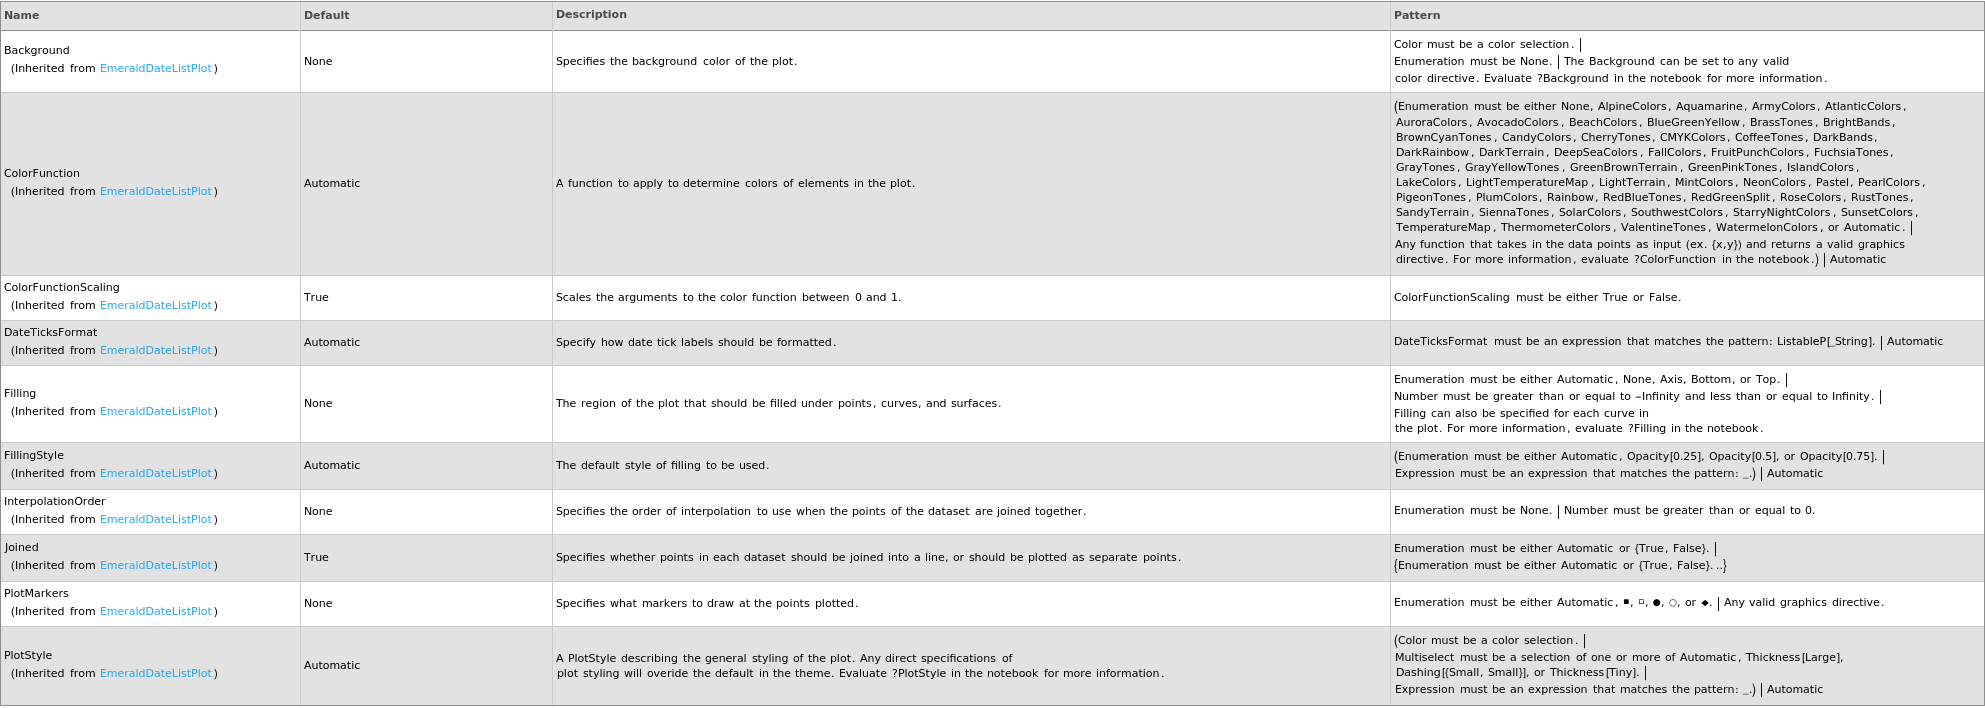
Plot Style Options
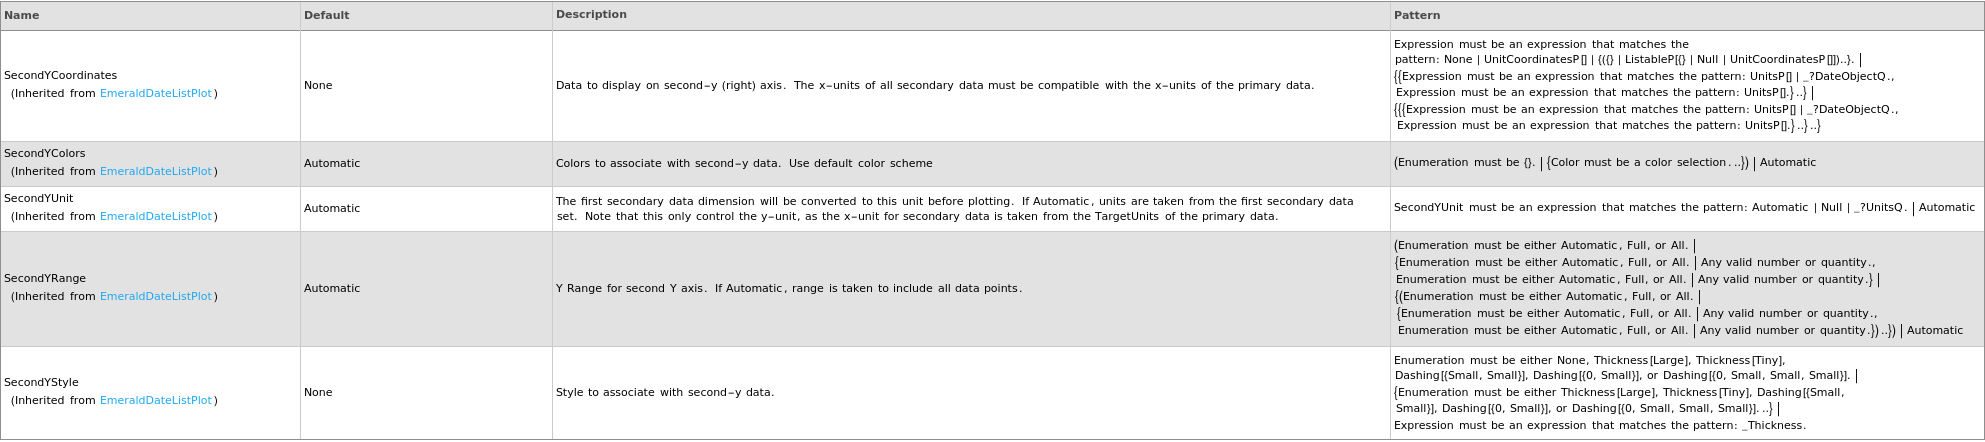
Secondary Data Options
General Options