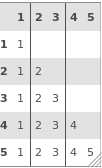
PlotTable
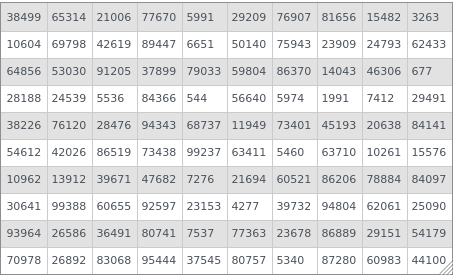
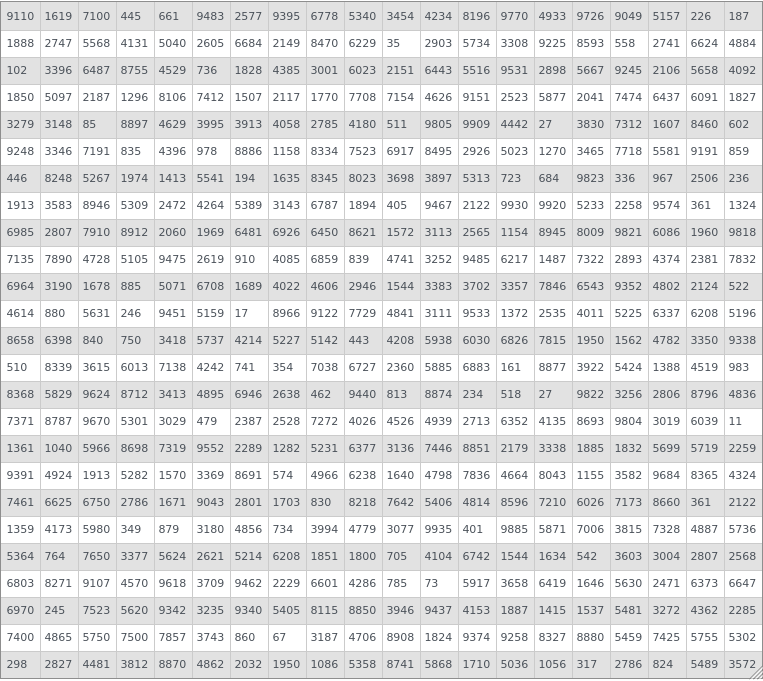
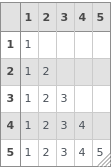
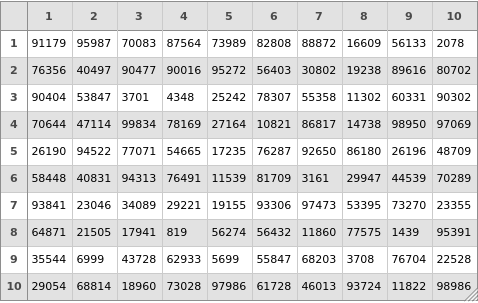
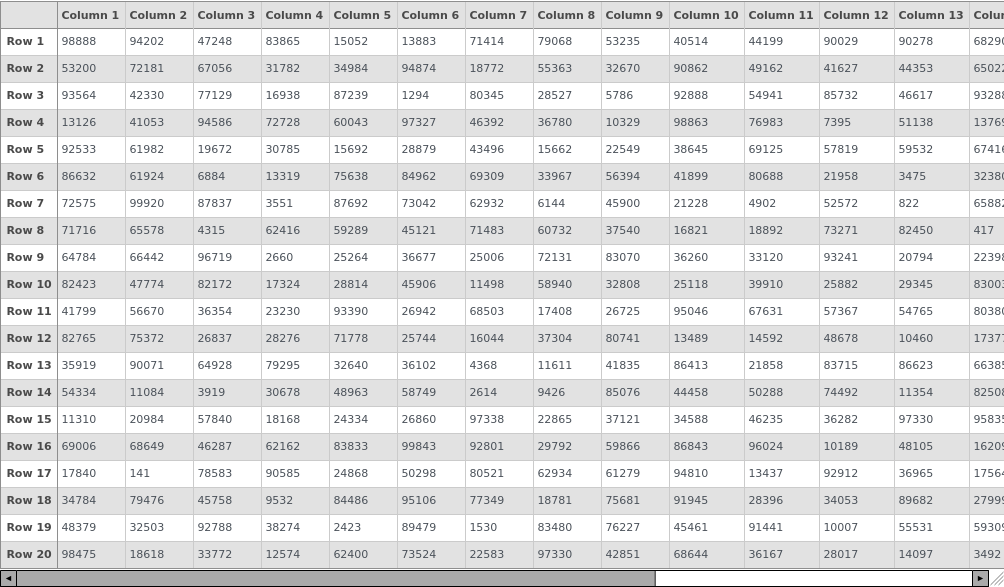
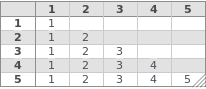
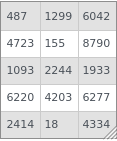
PlotTable[values]⟹table
displays values in a grid table similar to TableForm.
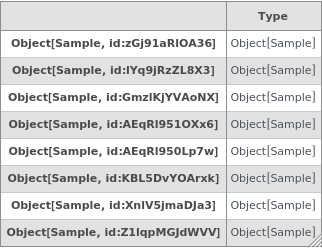
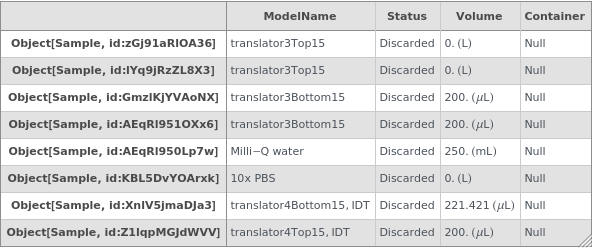
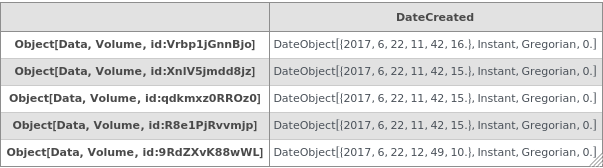
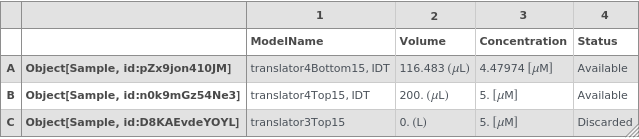
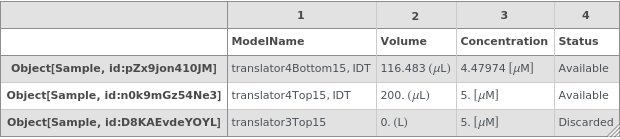
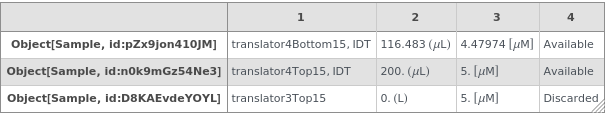
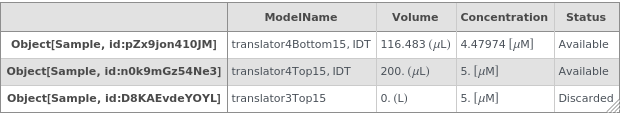
PlotTable[objects,fields]⟹table
creates a table containing the values of fields from objects.
Details
- TableForm is represented strangely in Mathematica's Front End. To ease these troubles, PlotTable can be used.
- PlotTable can take any Grid options as well as the options listed below.
-
HoldRest -
ColumnLabelMismatch Column headings are not the proper length. Please make sure it matches the input length. FieldsPatternMismatch The input fields are not a field name or a list of field names. Please make sure they are correct field names. RowLabelMismatch Row headings are not the proper length. Please make sure it matches the input length. SecondaryLabelMismatch The number of secondary headers (`1`) cannot be evenly divided over the number of `2` in the table (`3`). Spanning of secondary headers for `2` have been adjusted. Please modify your SecondaryTableHeadings option if you would specify a different spanning. SecondaryLabelsSpanning The number cells to span (`1`) does not match the number of `2` in the table (`3`). Secondary headers for `2` have been omitted. Please modify your SecondaryTableHeadings option if you would like to include these headers. TooManySecondaryLabels The number of secondary headers (`1`) exceeds the number of `2` in the table (`3`). Secondary headers for `2` have been omitted. Please modify your SecondaryTableHeadings option if you would like to include these headers.
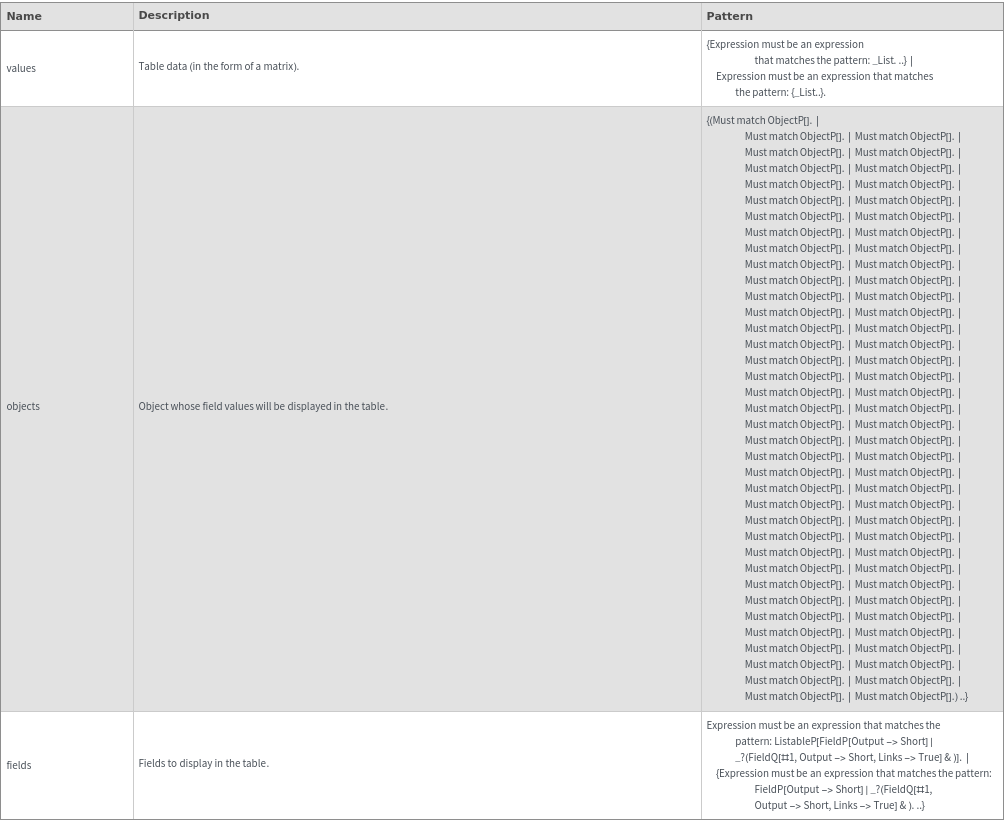
Input
Output

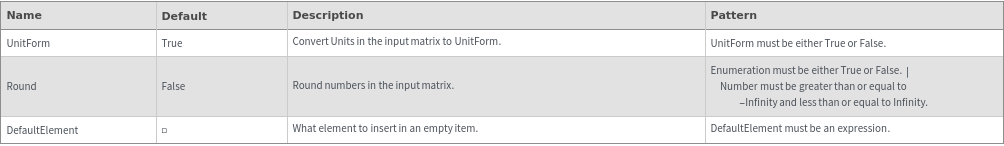
Data Specifications Options
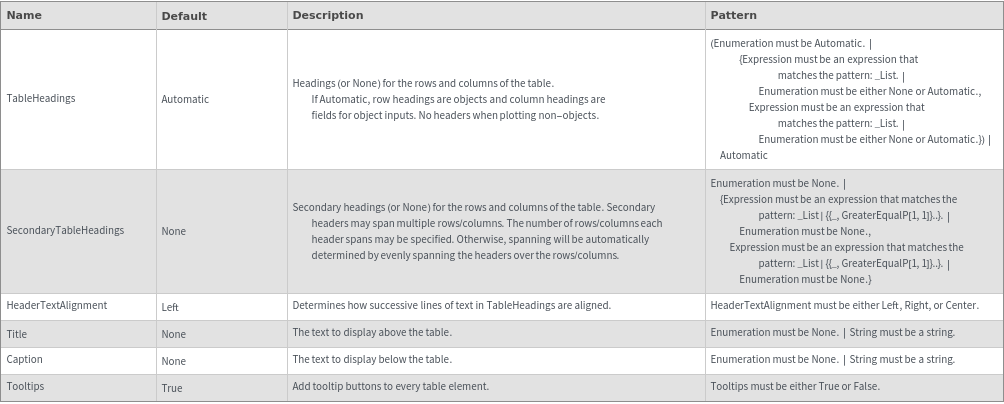
Plot Labeling Options
Plot Style Options
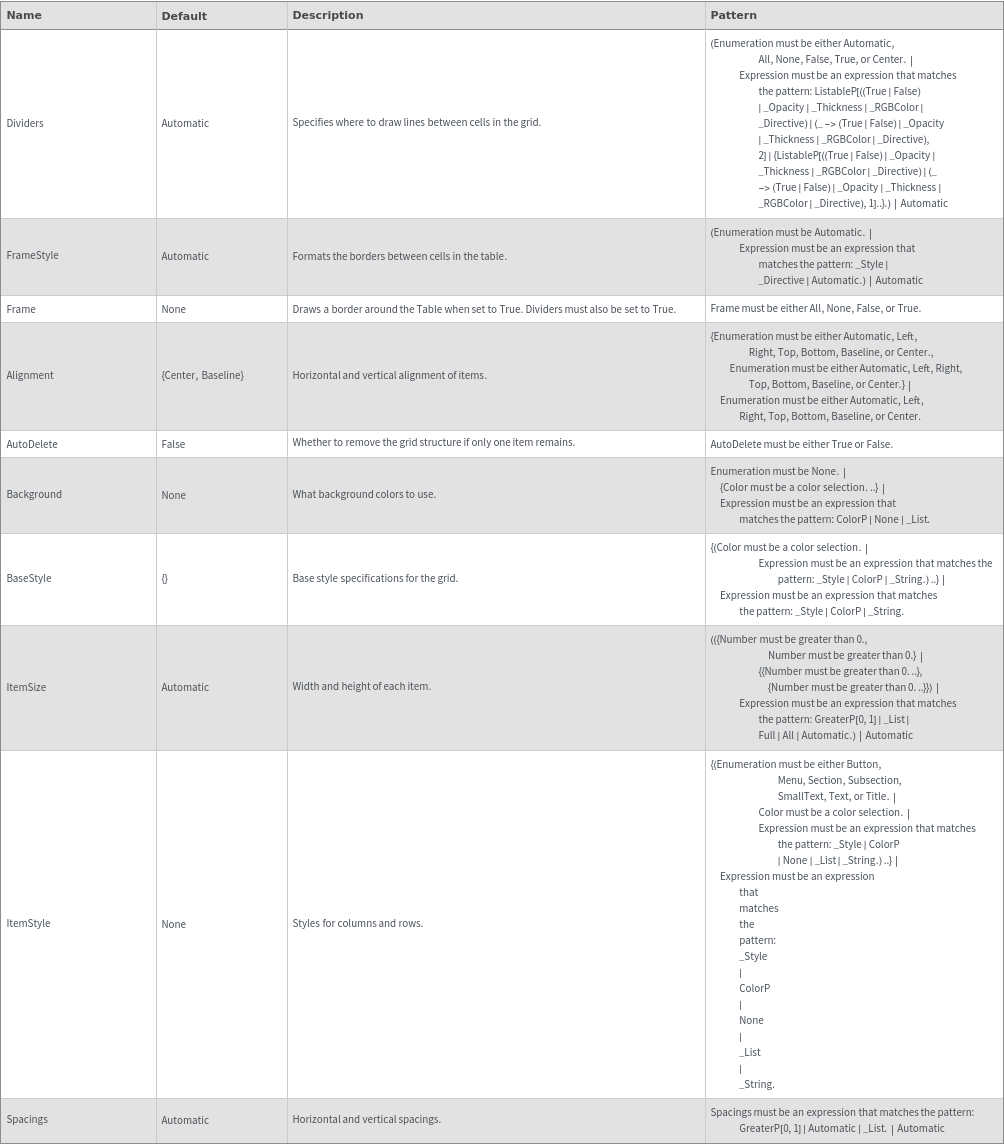
Control Options

Attributes
Messages
Examples
Basic Examples (4)


Additional Examples (2)


Options (38)


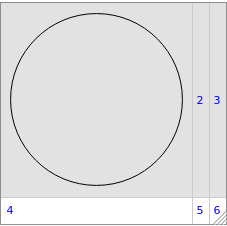


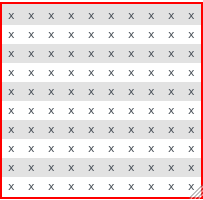
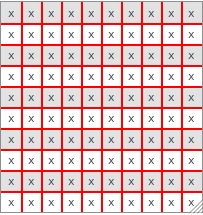
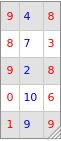
Dividers (3)


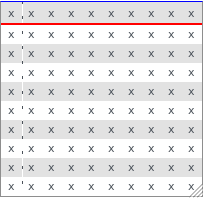


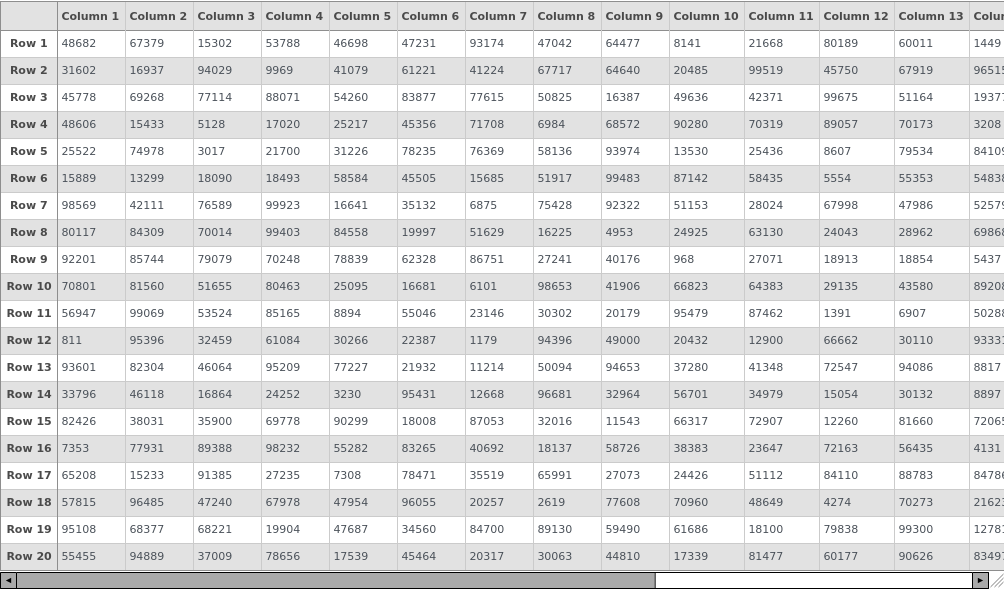
HorizontalScrollBar (2)


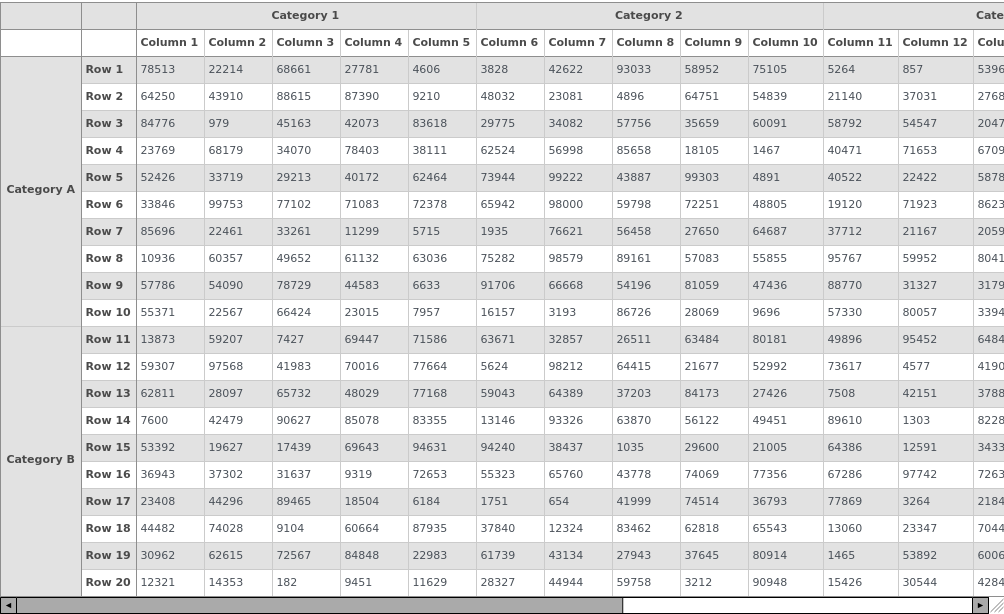
SecondaryTableHeadings (6)
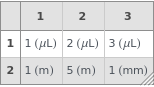
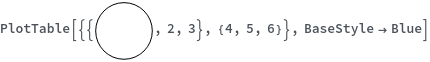
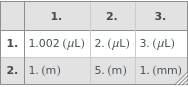
Specify secondary row and column headings:

Specify only secondary row headings:

Specify only secondary column headings:

Specify secondary row and column headings:

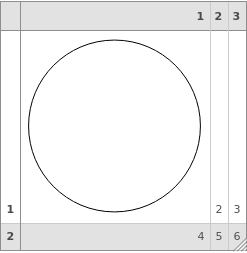
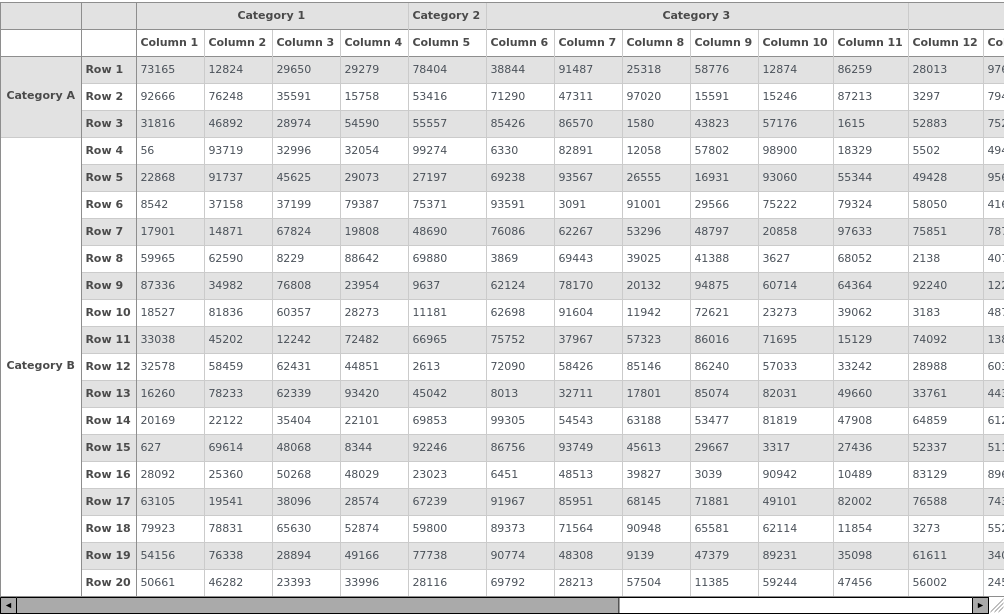
Specify secondary row and column headings that span multiple cells:

Specify secondary row and column headings that span a specified number of cells:


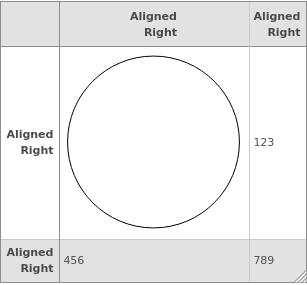
TableHeadings (8)
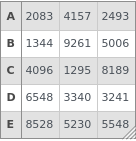
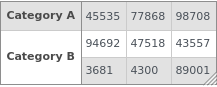
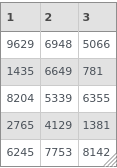
Specify row and column headings:

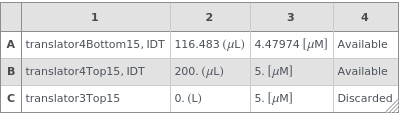


Specify row and column headings:

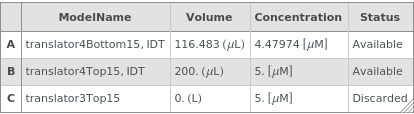
Automatic row and column headings will default to the objects and fields when plotting objects:

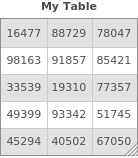
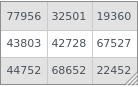
Automatic row and column headings will default to no headers when plotting non-objects:

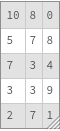
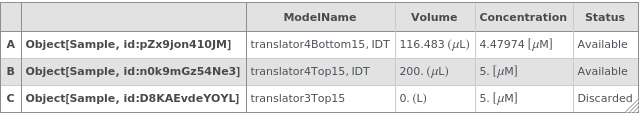
If TableHeadings is specified as None for the rows, no row heading cells are displayed:

If TableHeadings is specified as None for the columns, no column heading cells are displayed: