PlotTimeSlice
PlotTimeSlice[Object, Time]⟹Plot
plots a slice of a 3D field at given Time for the input Object.
Details
Input
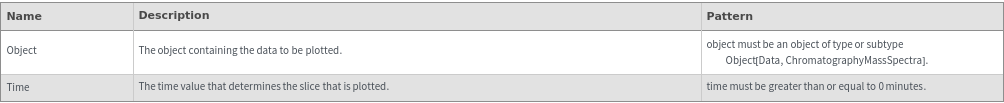
Output

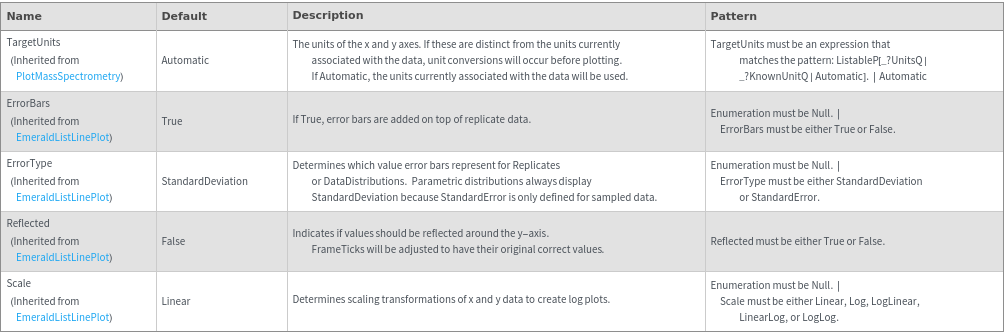
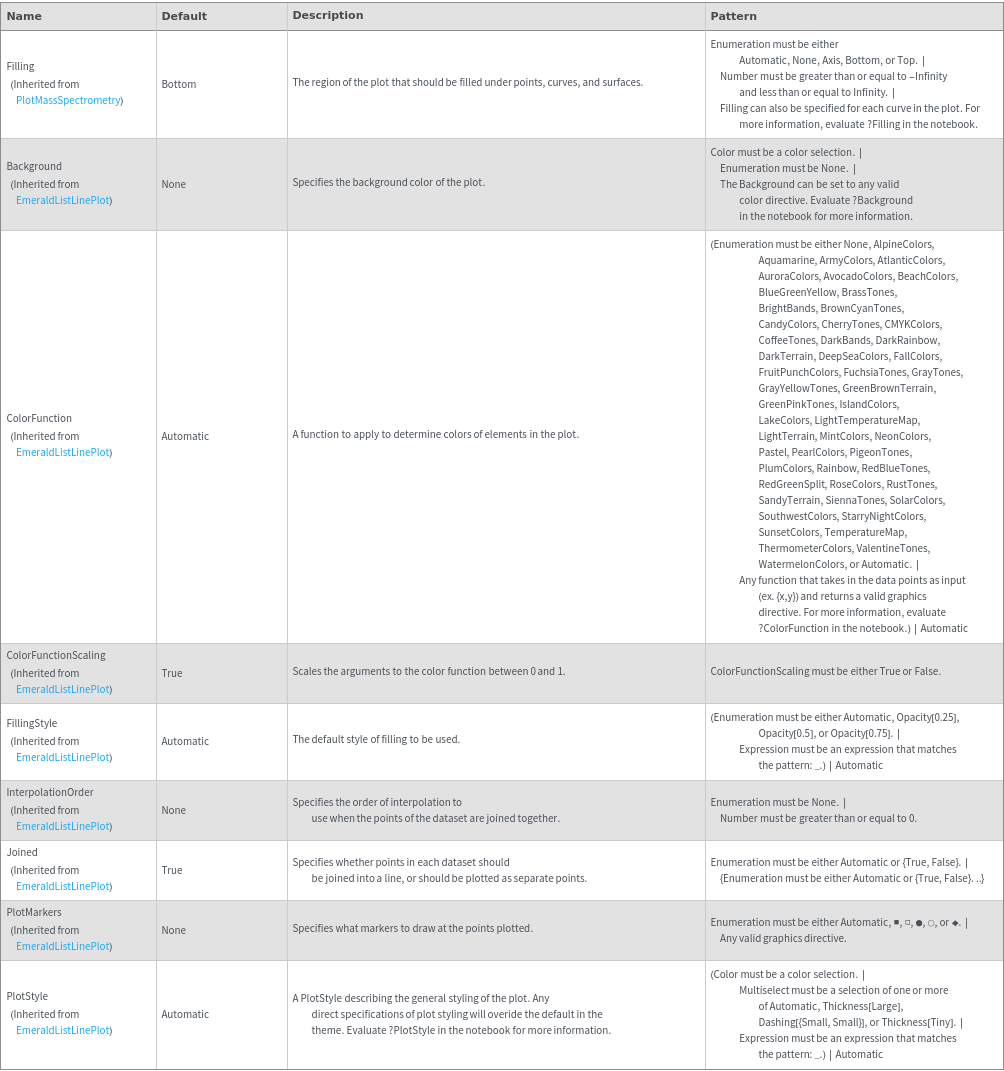
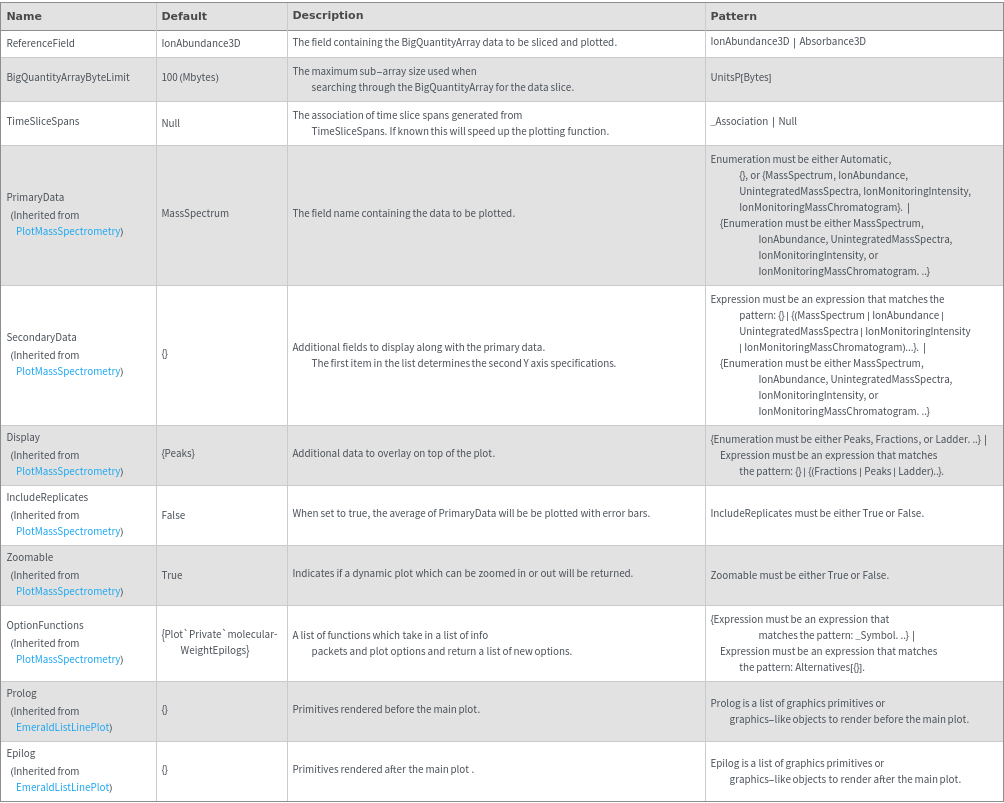
Data Specifications Options
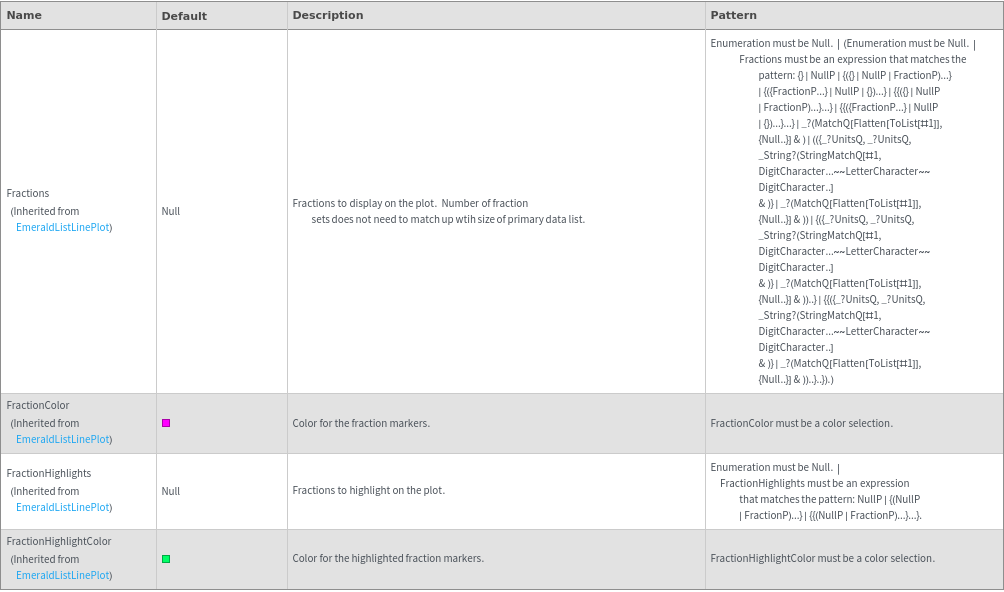
Fractions Options
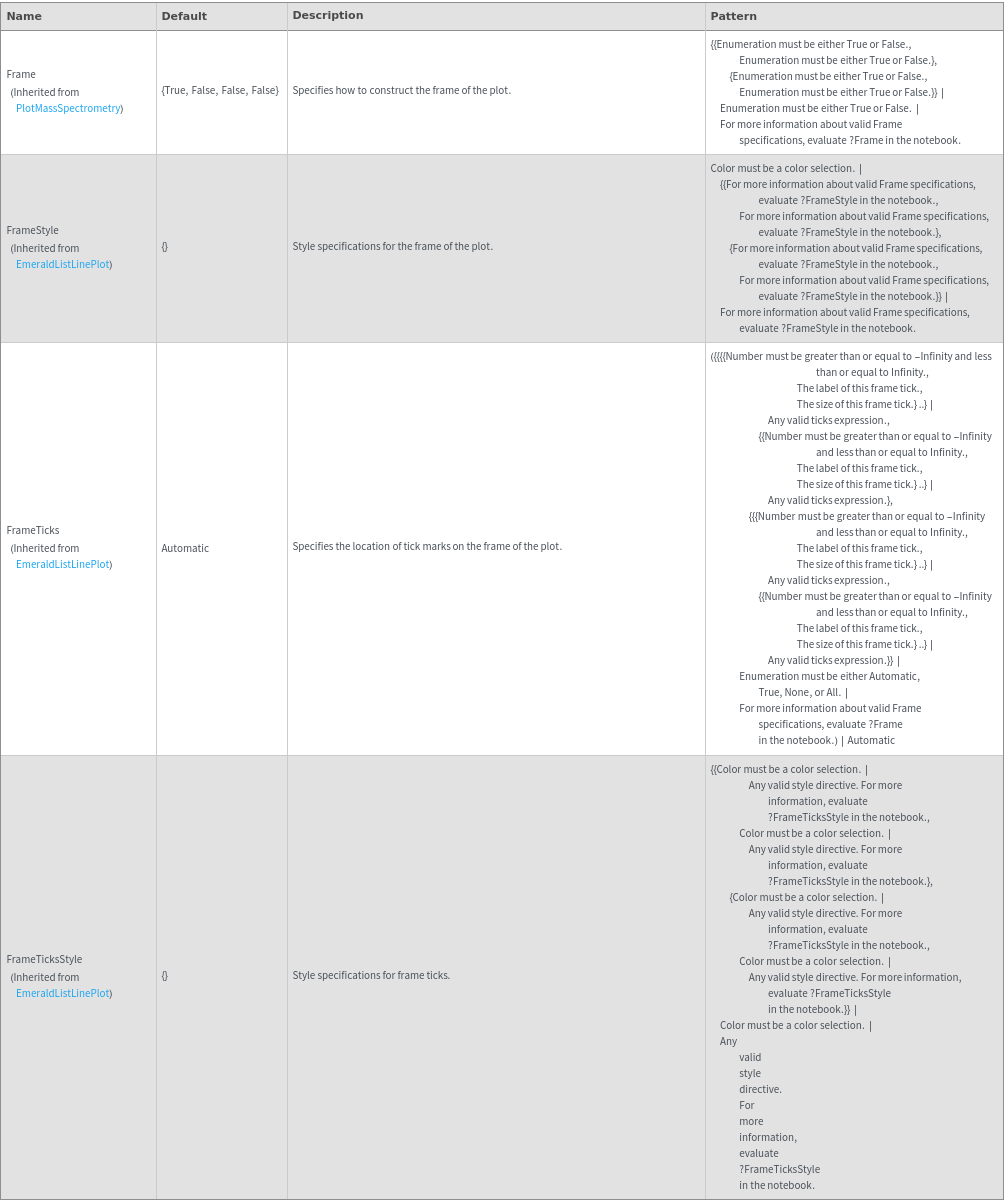
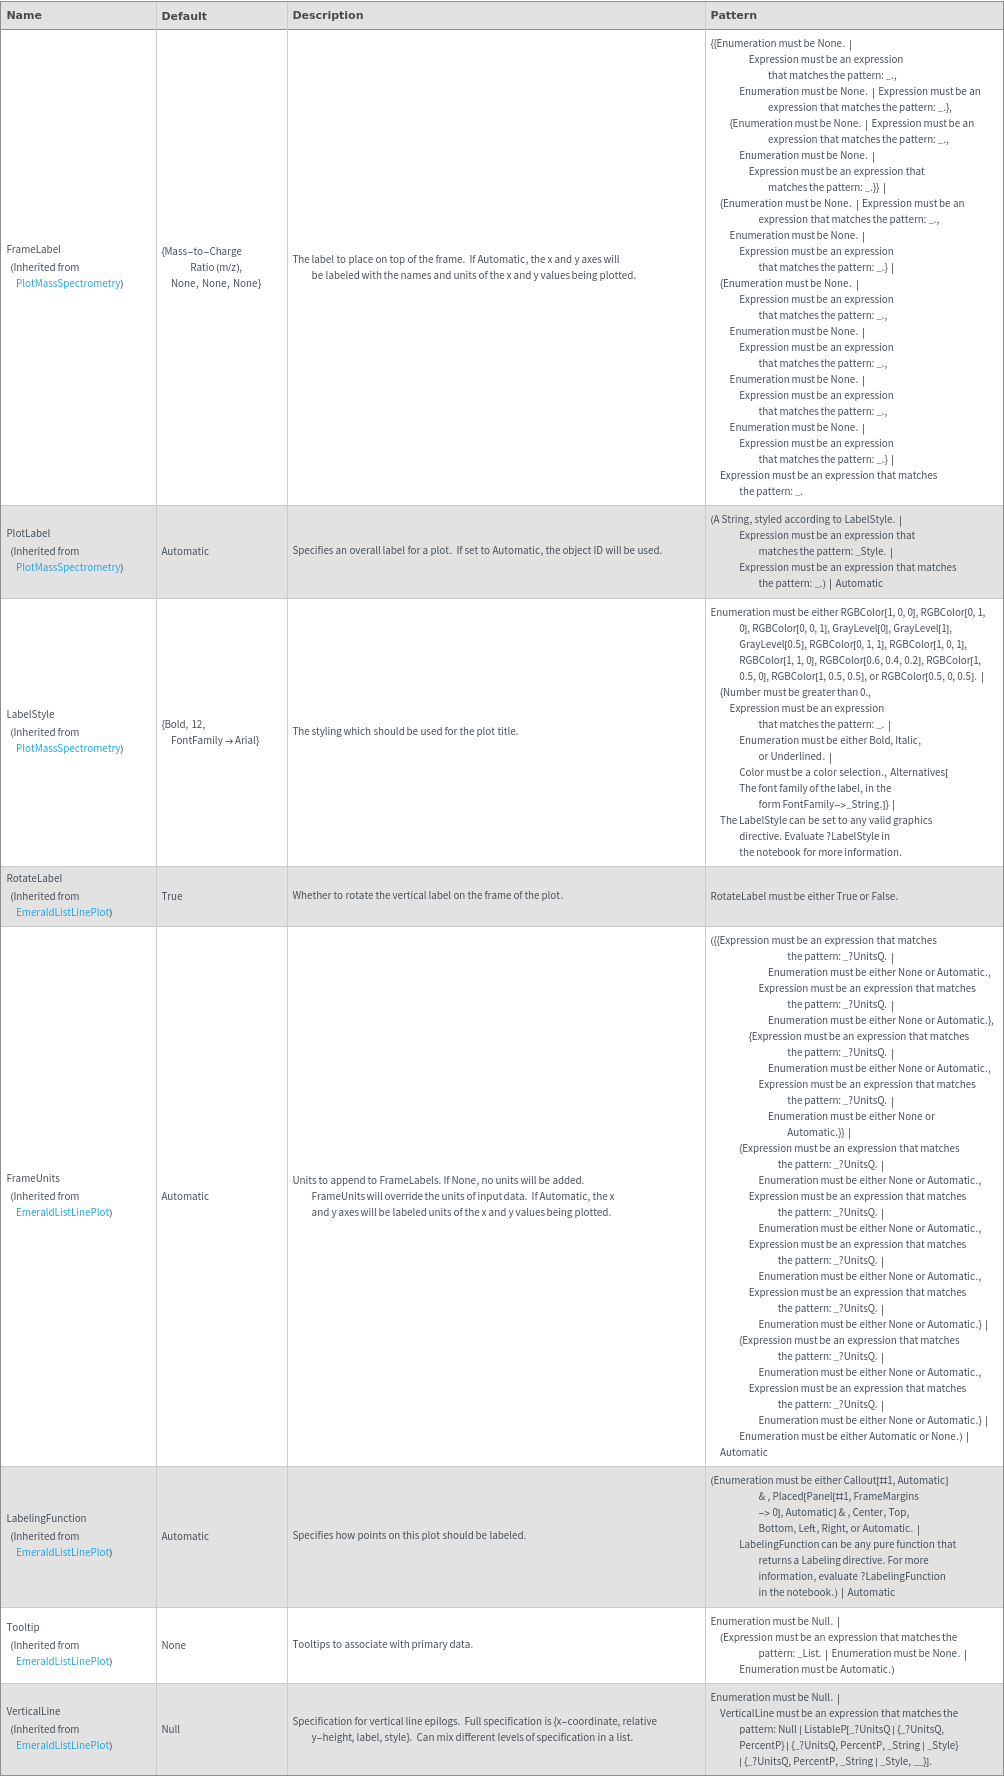
Frame Options
Grid Options
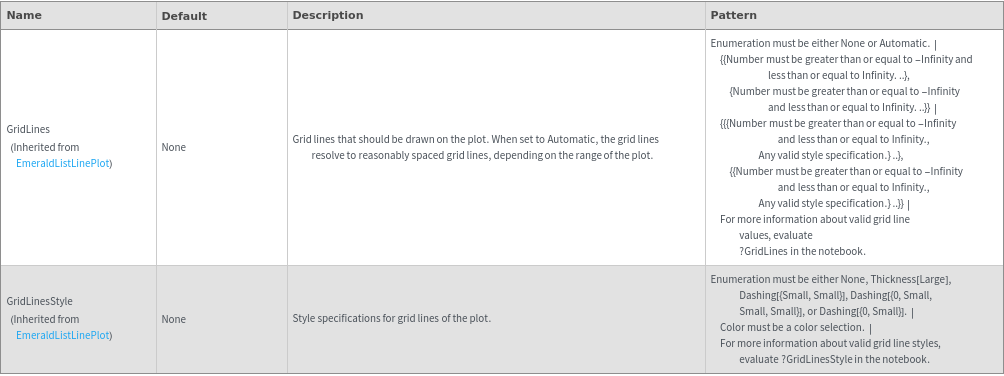
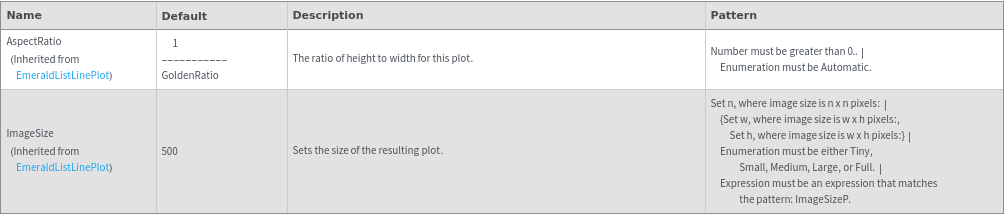
Image Format Options
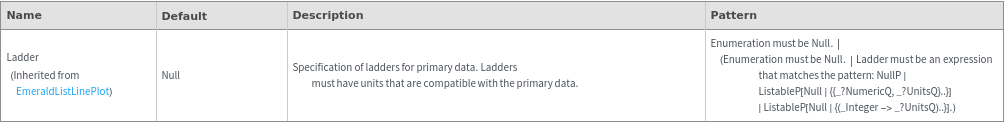
Ladder Options
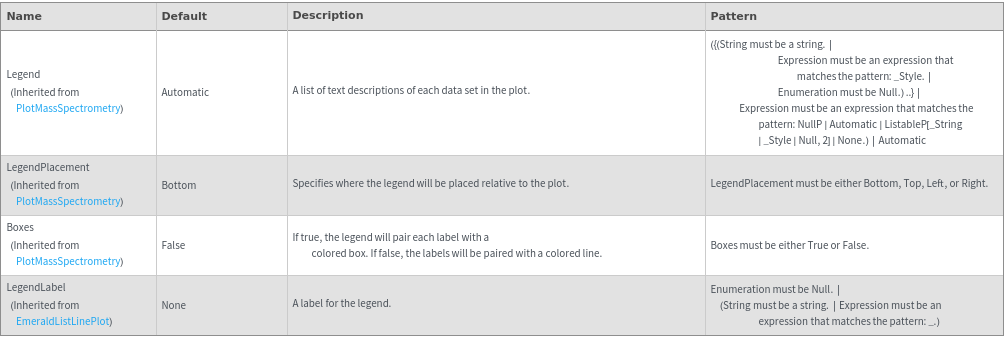
Legend Options
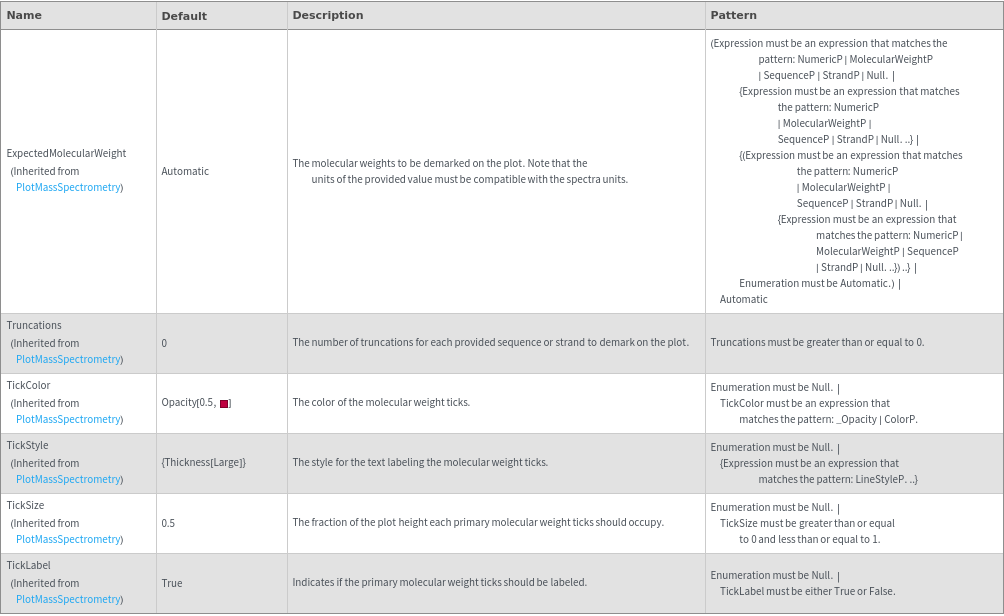
MolecularWeightEpilog Options
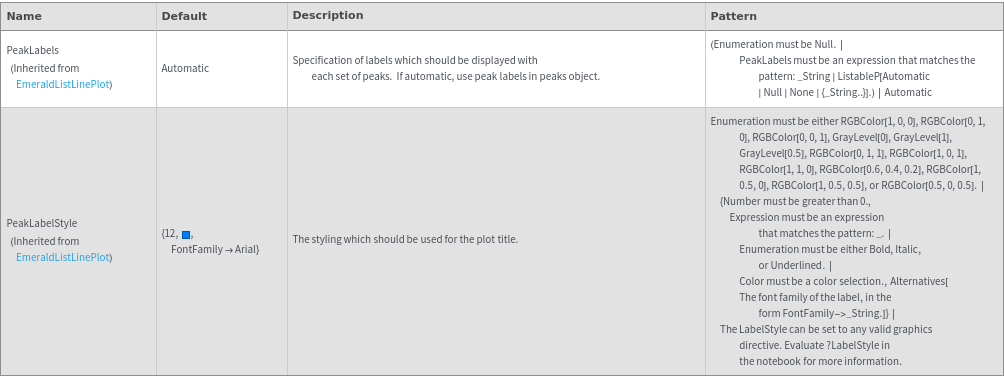
Peaks Options
Plot Labeling Options
Plot Range Options
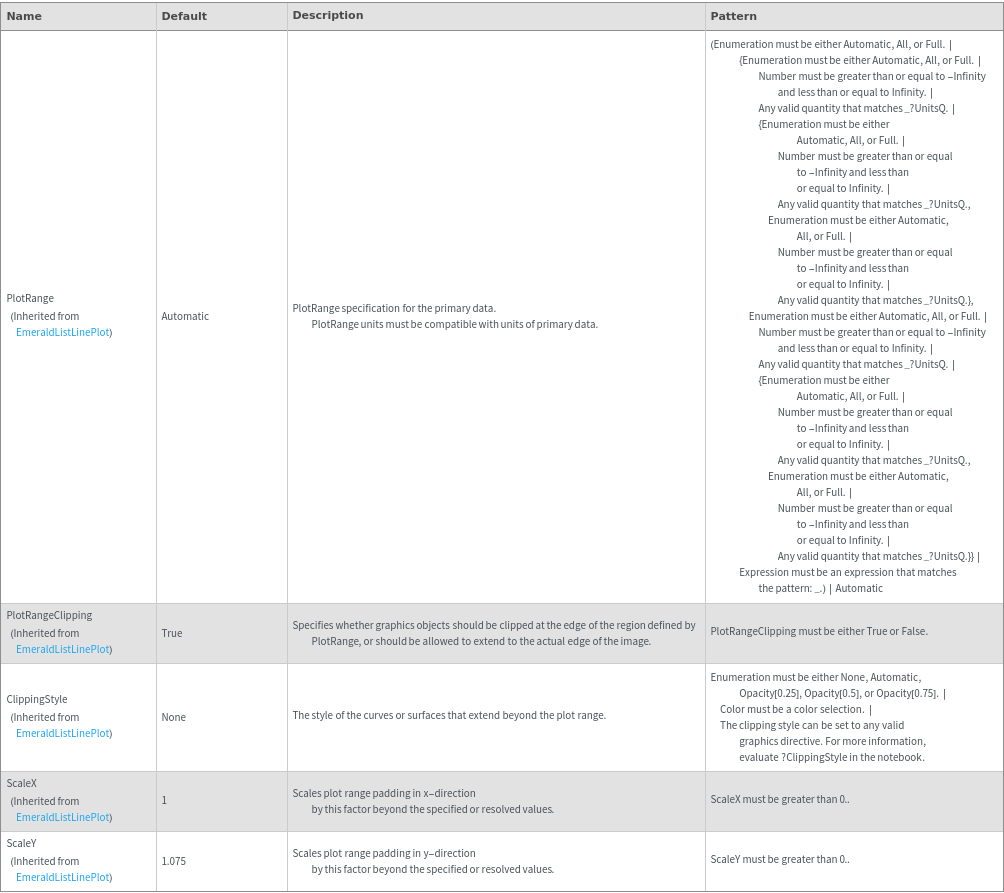
Plot Style Options
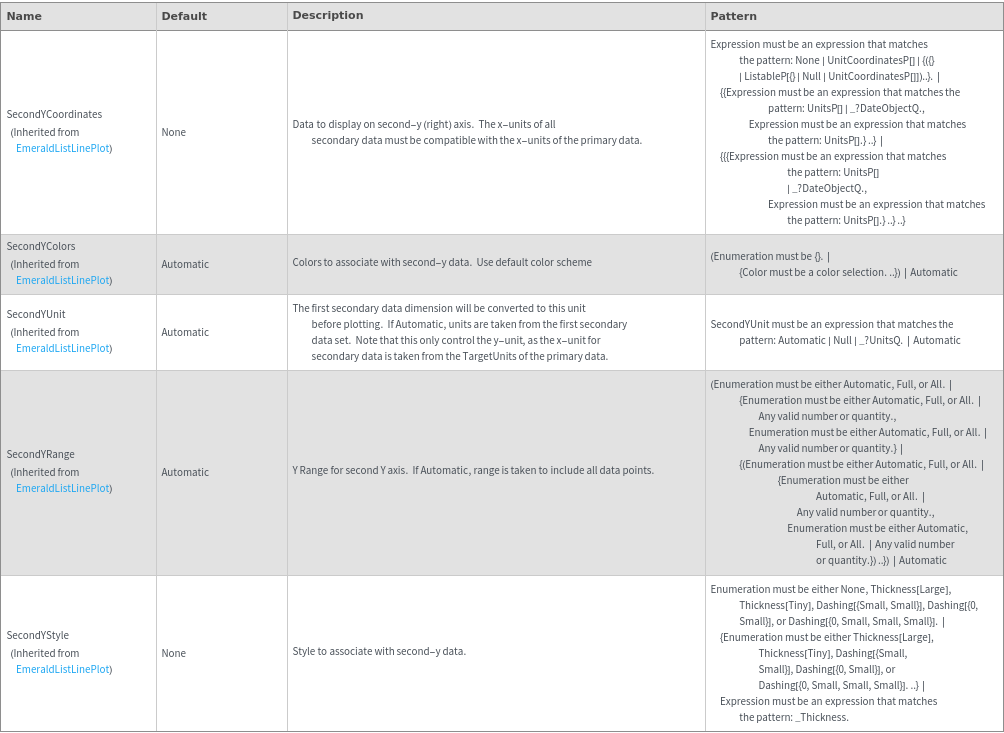
Secondary Data Options
General Options
Examples
Basic Examples (3)
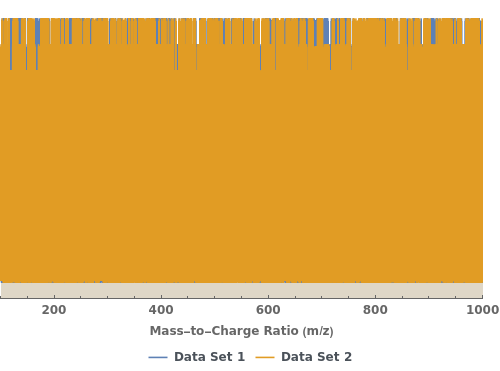
Plotting a couple time slices for an LCMS object creates a plot with multiple data groups:
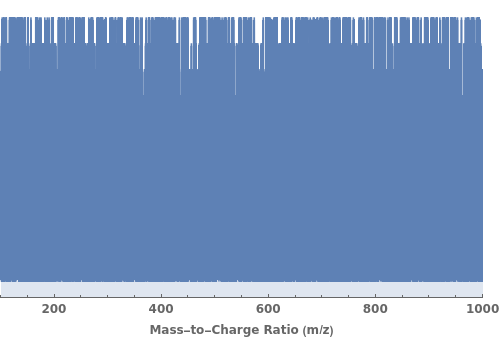
Plotting a time slice for an LCMS object creates a Mass Spectrometry graphics object:
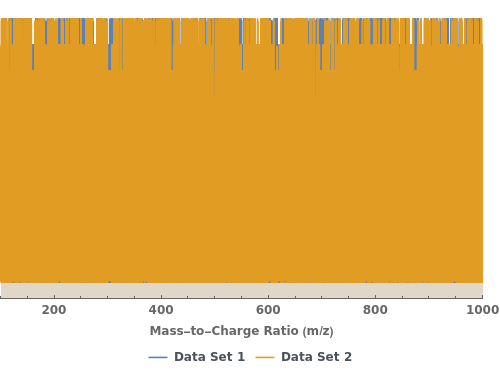
Plotting a time slice for multiple LCMS objects creates a plot with multiple data groups:
Options (3)
BigQuantityArrayByteLimit (1)
The BigQuantityArrayByteLimit option controls the maximum amount of data that is downloaded at any point in time:
ReferenceField (1)
The IonAbundance3D field can be sliced into plots by using the ReferenceField option:
TimeSliceSpans (1)
The TimeSliceSpans option allows the user to specify the time slice spans if previously calculated with TimeSliceSpans:
Messages (1)
InexactTime (1)
Choosing an input time that does not exactly match any of the data slices will result in a warning that the nearest time slice is used to make the plot:
Last modified on Tue 31 May 2022 09:27:18