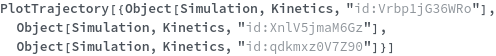
PlotTrajectory
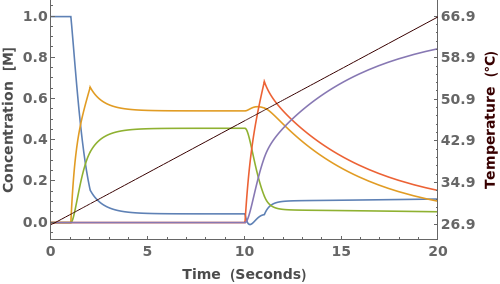
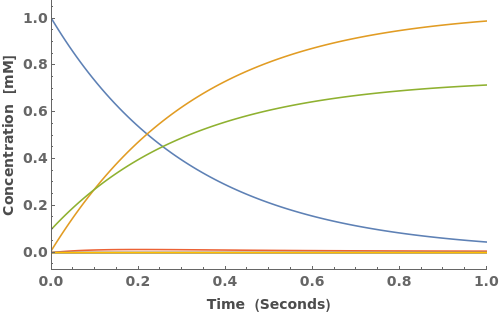
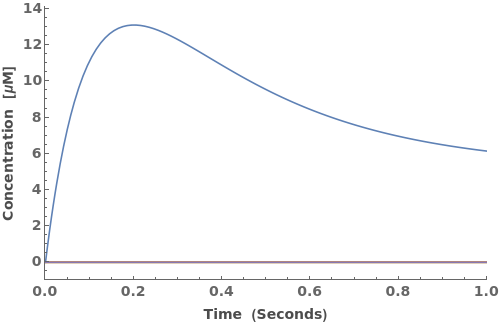
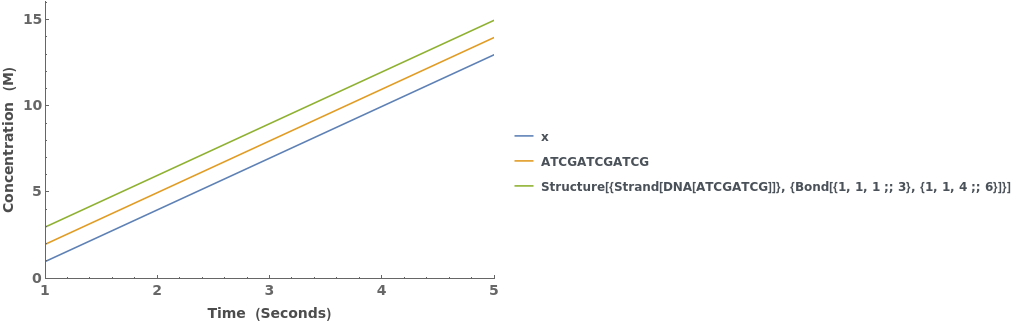
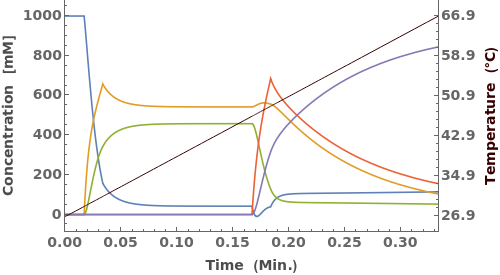
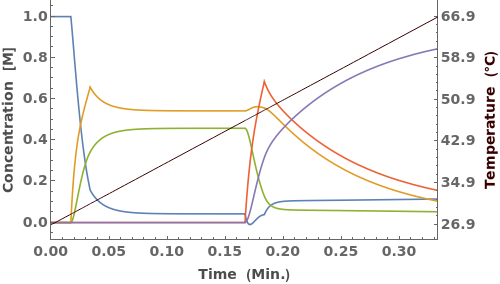
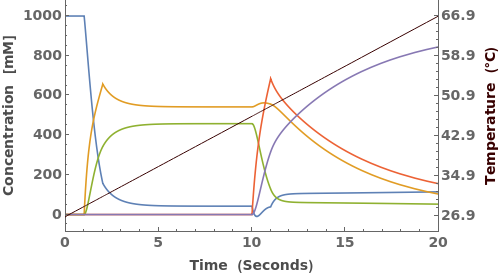
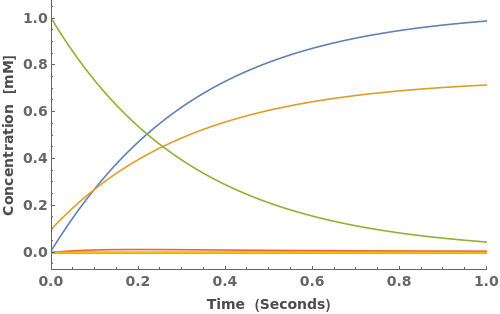
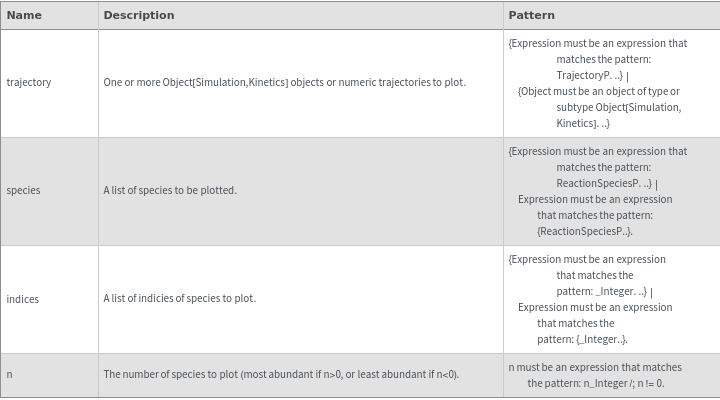
PlotTrajectory[trajectory]⟹plot
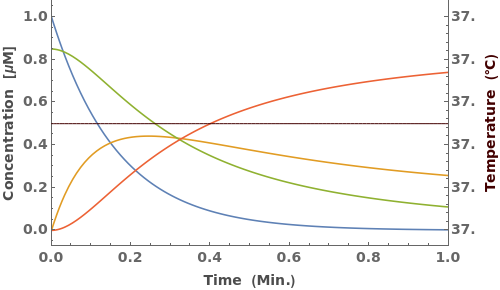
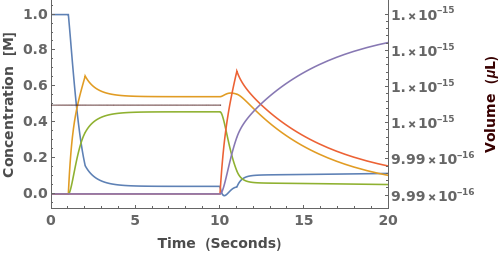
plots the concentration of all species in trajectory versus time.
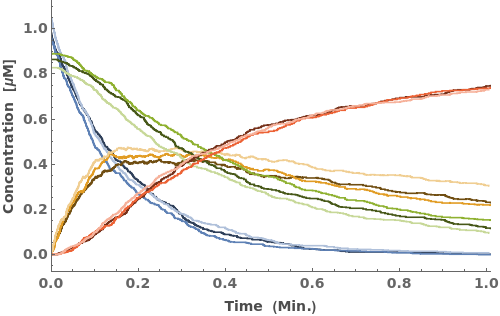
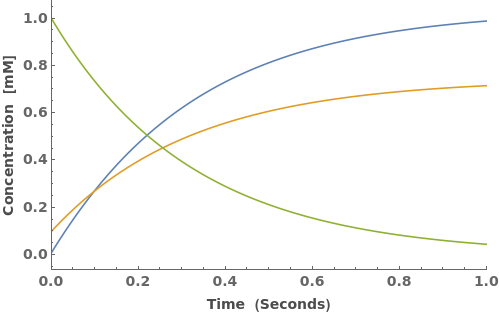
PlotTrajectory[trajectory,species]⟹plot
plots only the concentrations of species.
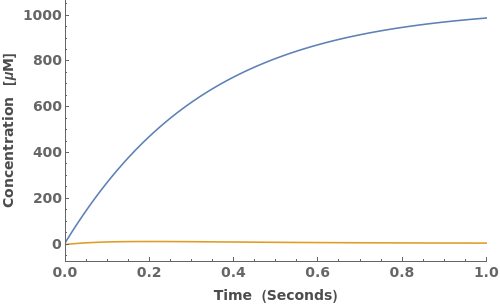
PlotTrajectory[trajectory,indices]⟹plot
plots only the species in trajectory whose positions match the indices.
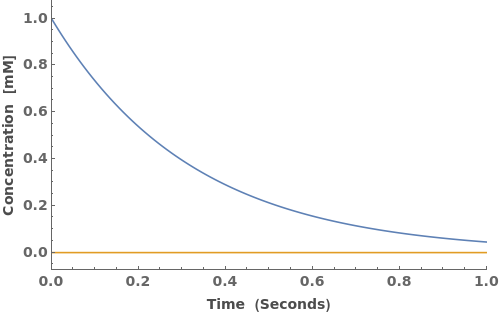
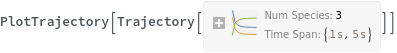
PlotTrajectory[trajectory,n]⟹plot
plots only the n most abundant species. If n<0, plots the n least abundant species.
Details
-
BadSpecies The following species are not present in the Trajectory: `1` NoSpecies There are no valid species to plot
Input
Output

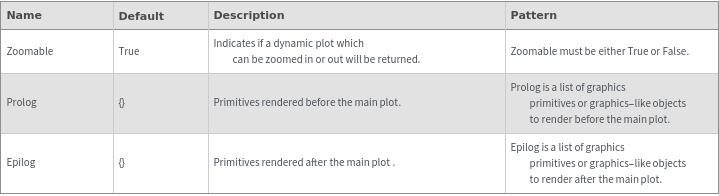
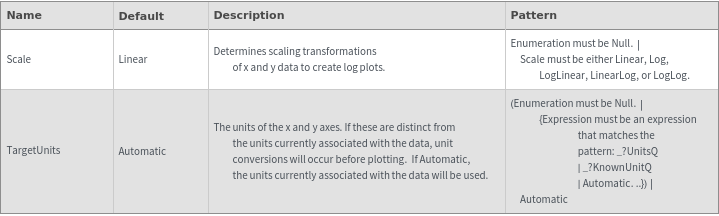
Data Specifications Options
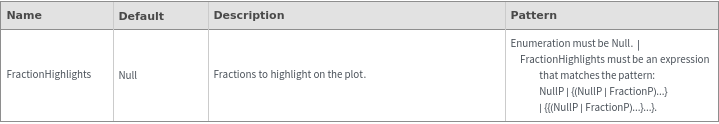
Fractions Options
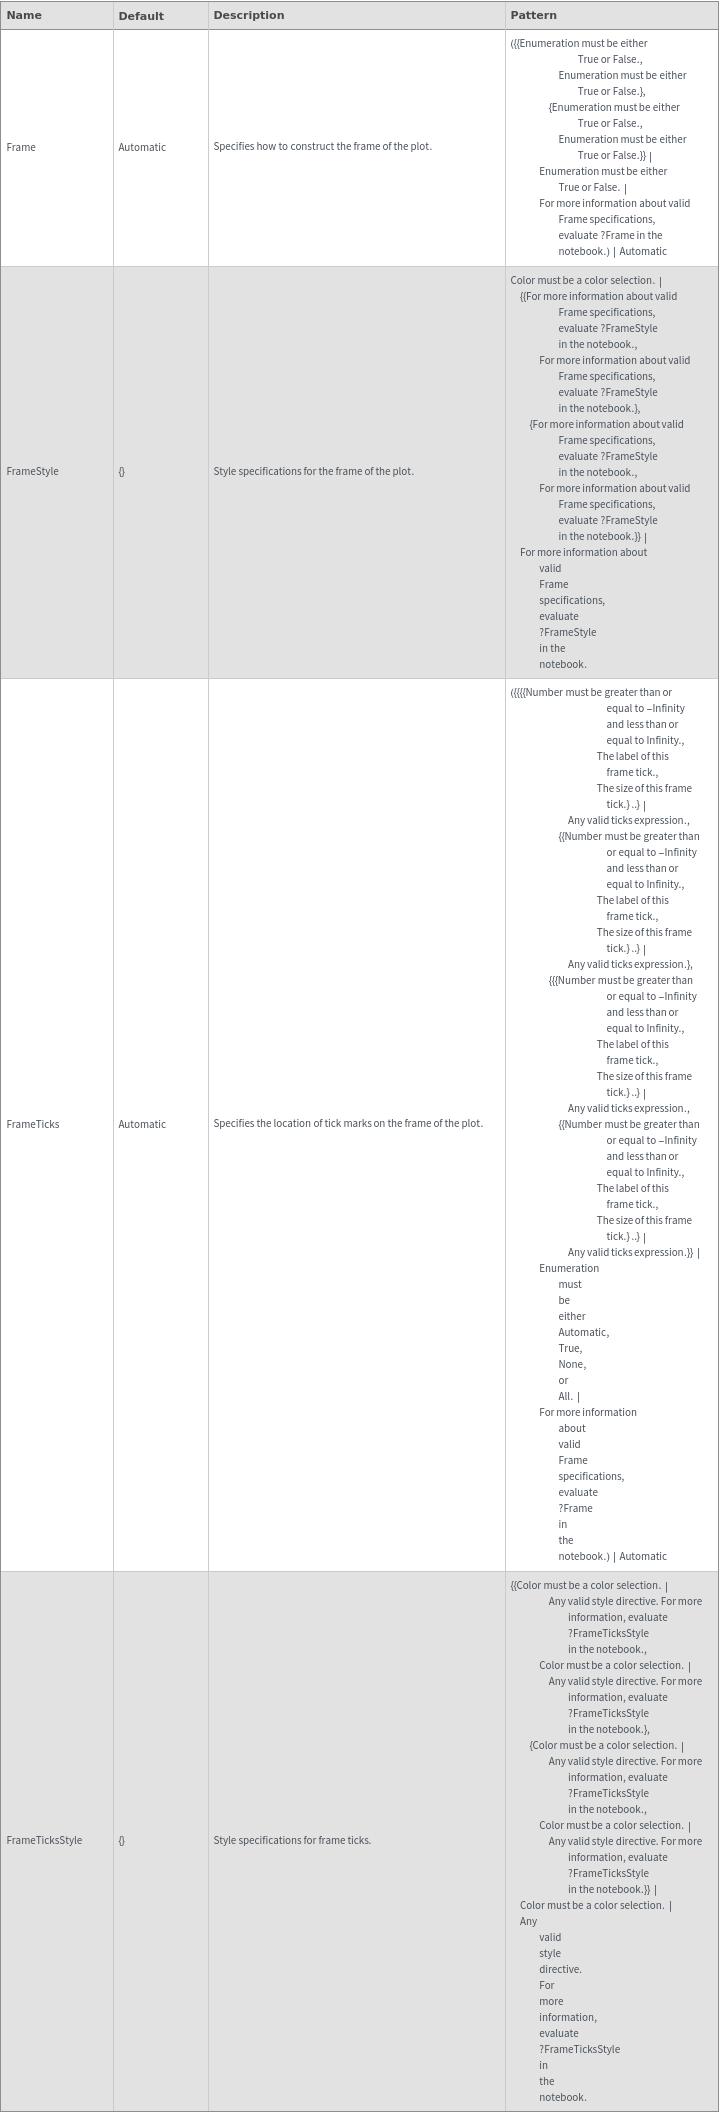
Frame Options
Grid Options
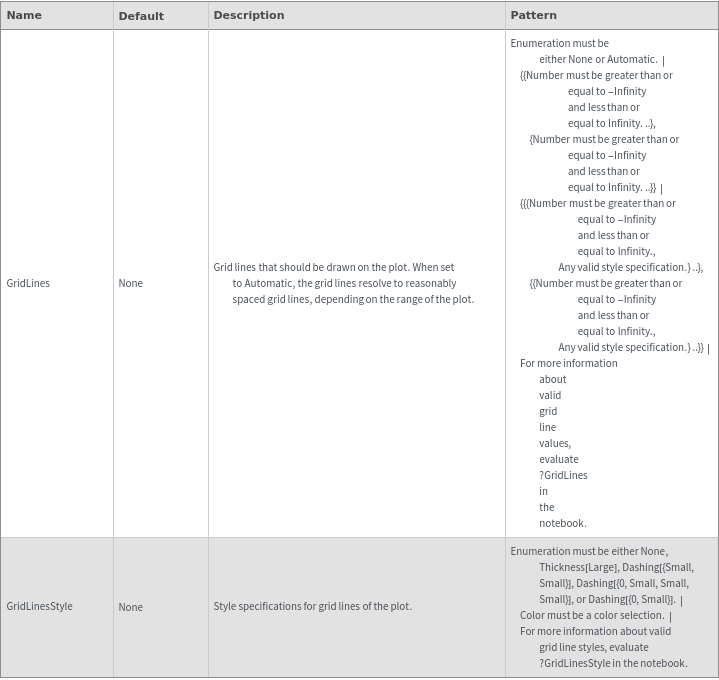
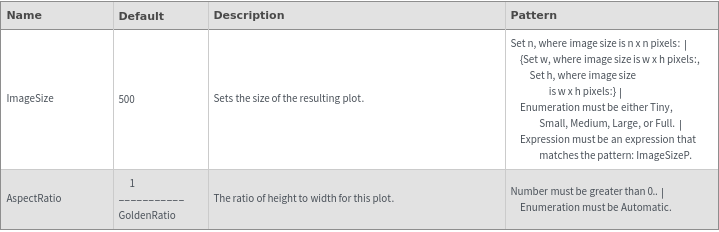
Image Format Options
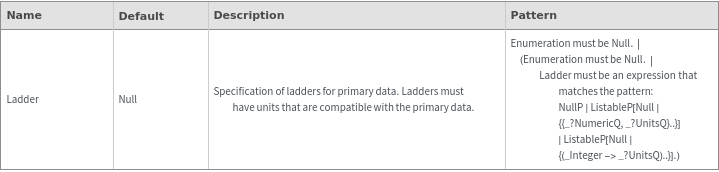
Ladder Options
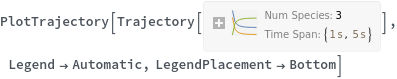
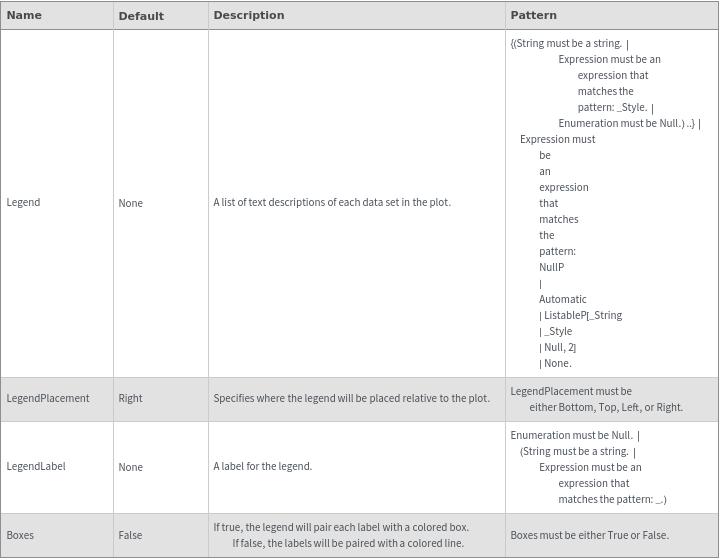
Legend Options
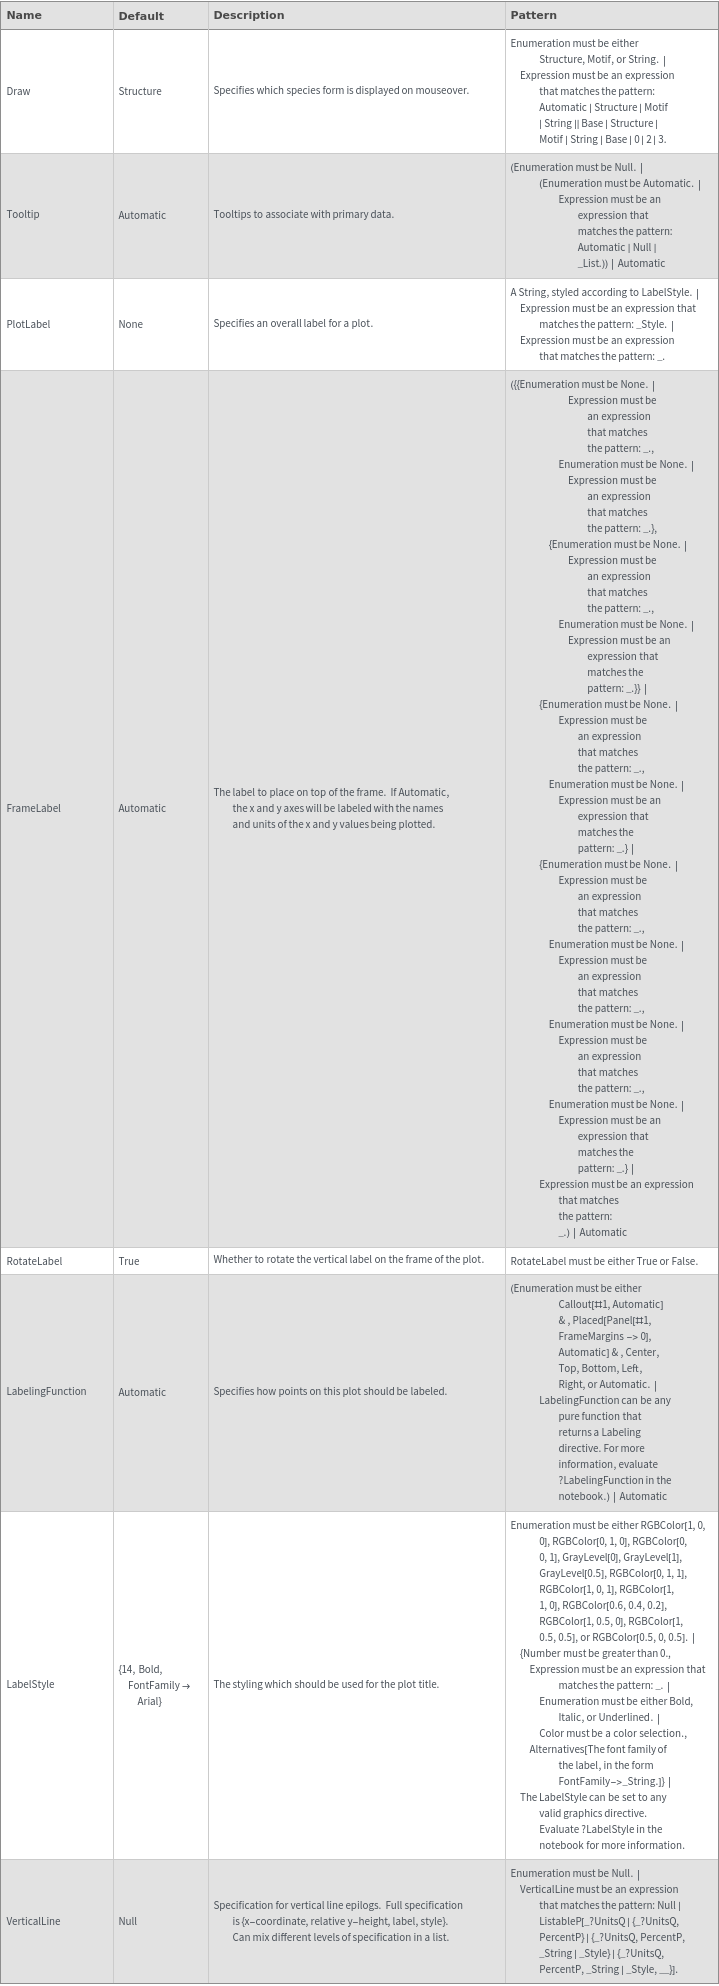
Plot Labeling Options
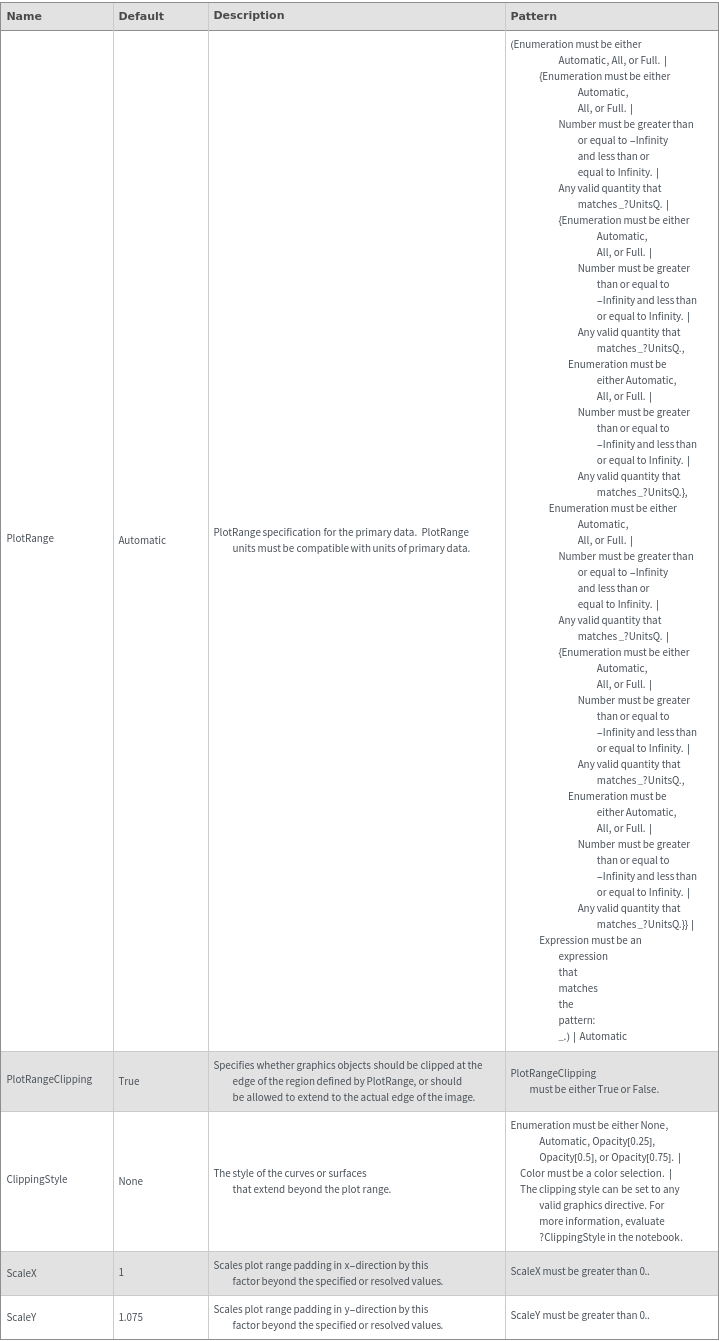
Plot Range Options
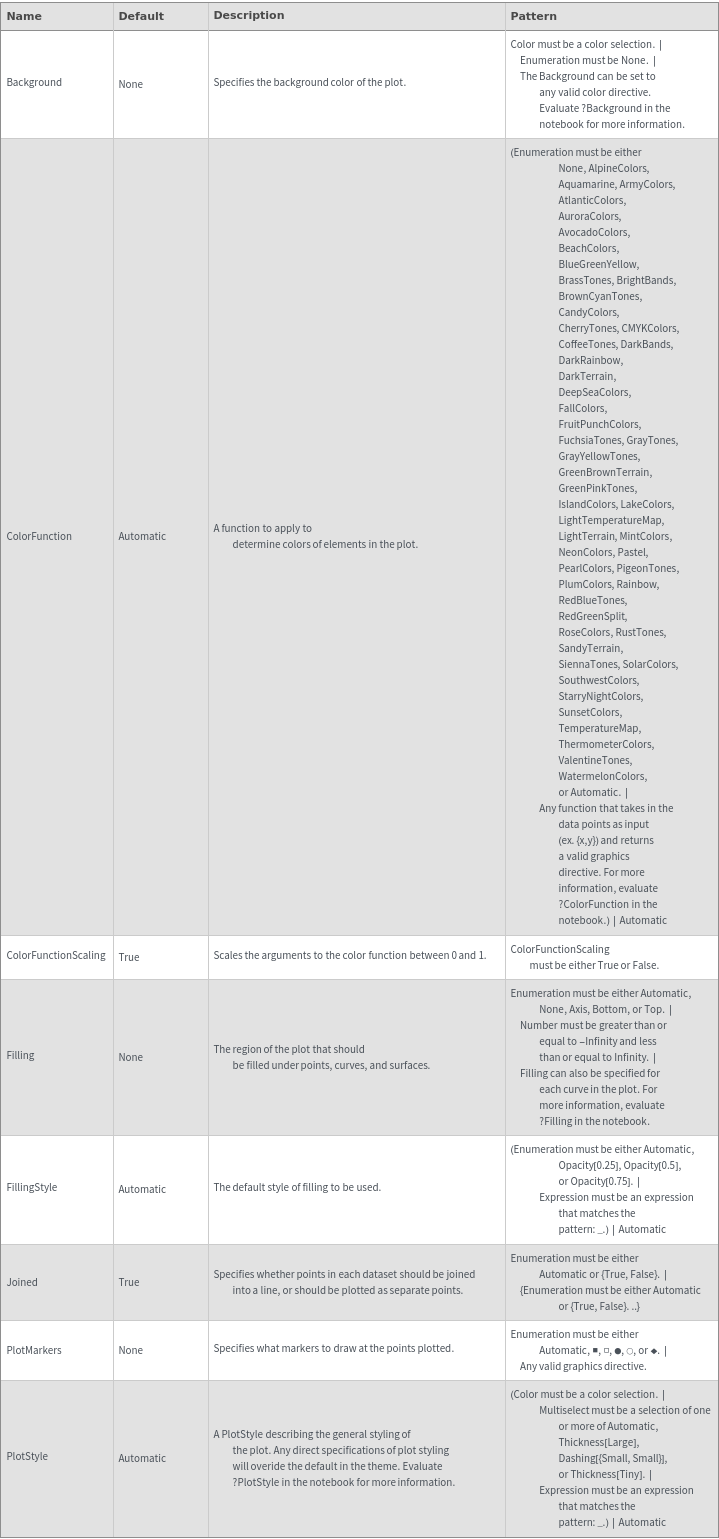
Plot Style Options
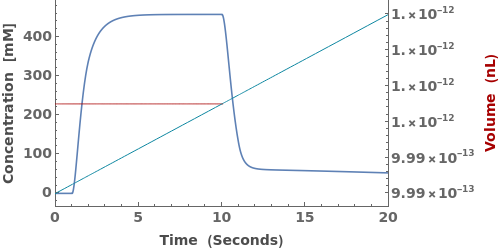
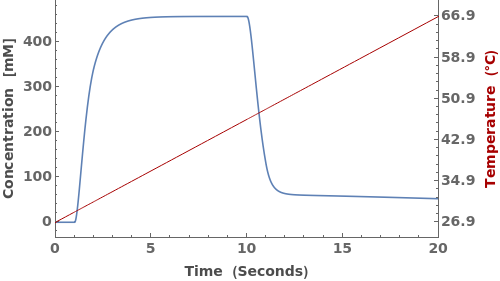
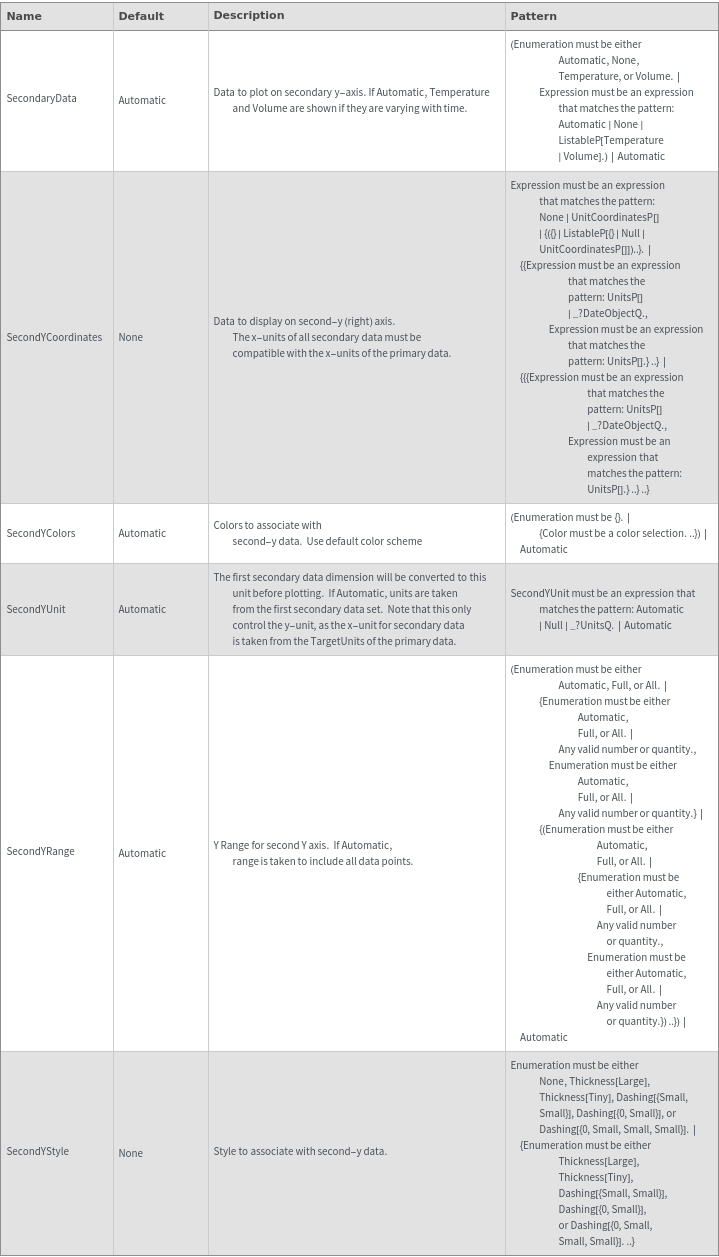
Secondary Data Options
General Options