TransfersInGraph
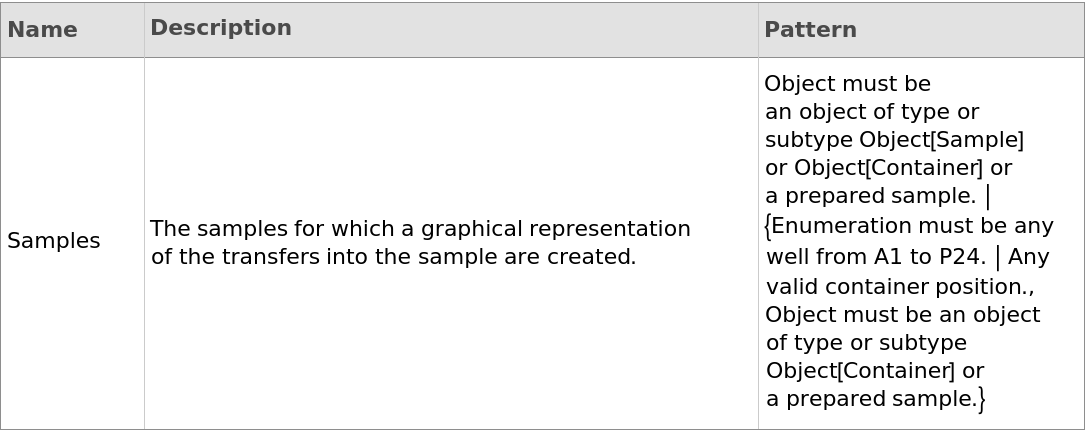
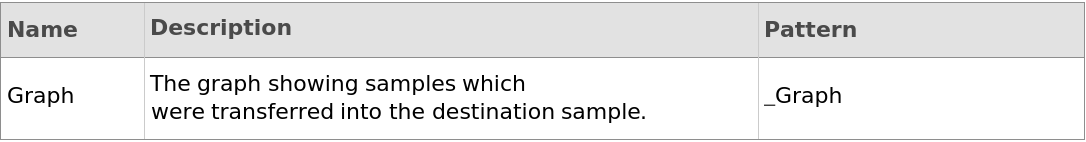
TransfersInGraph[Samples]⟹Graph
generates visual maps that show the transfers of source samples into destination Samples through multiple transfer levels. The vertices (nodes or points) represent individual samples, while the edges (links) illustrate transfers into those samples. Hovering over a vertex displays a brief table with sample information, while hovering over an edge reveals details about the transfer from the source to the destination. These graphs provide insight into a sample's history and origins, tracing it back to the original sample received from the supplier. This information is particularly valuable when investigating issues related to sample preparation.
Details
Input
Output
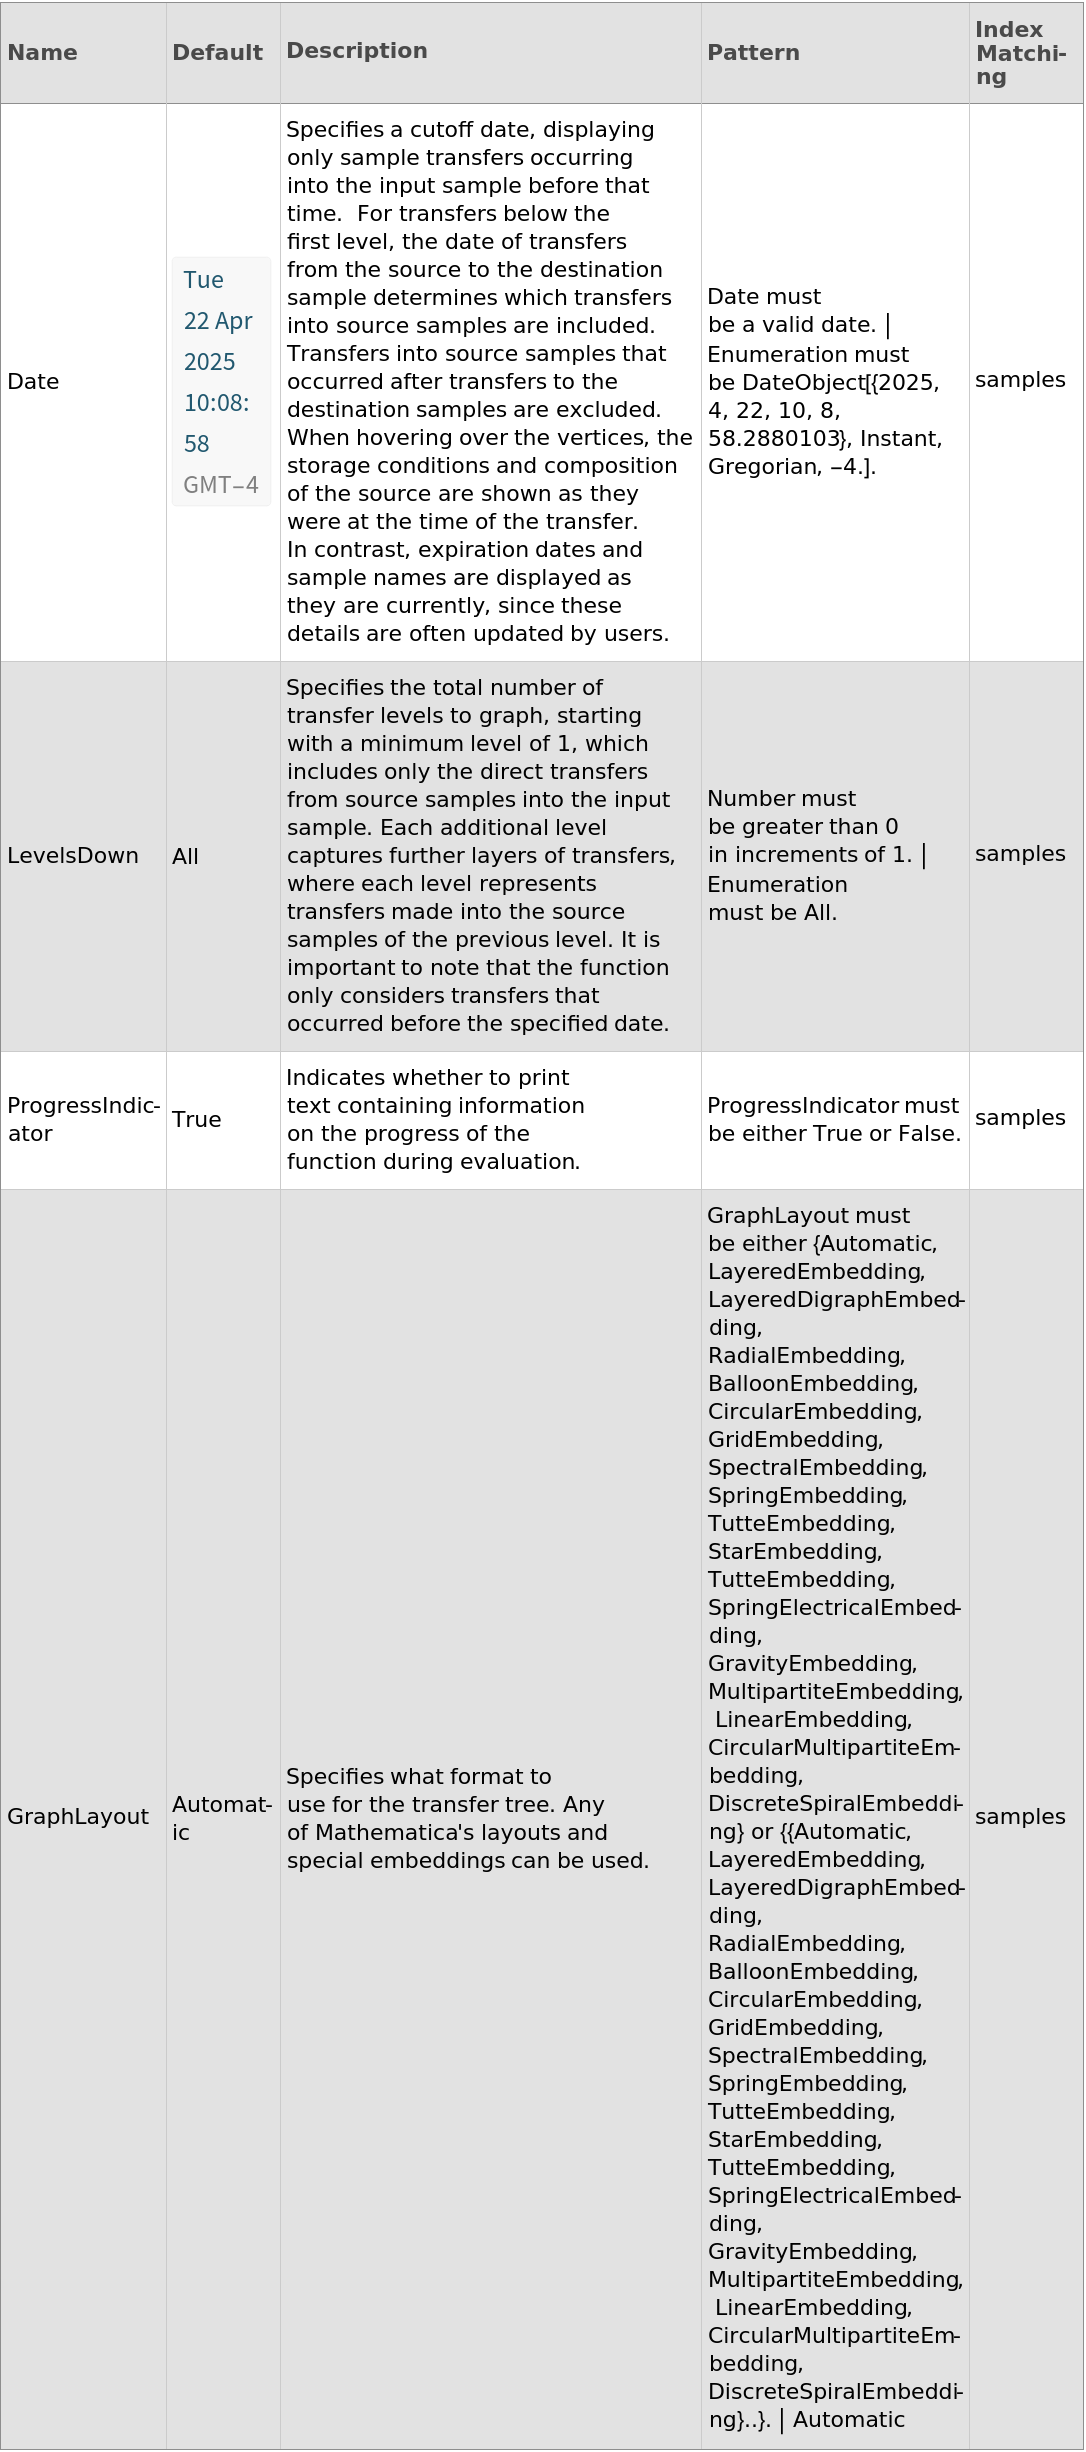
General Options
Examples
open allclose allBasic Examples (4)
Generates a graph displaying the product if the SamplesIn field of the input sample is empty:

Generates visual maps that show the transfers of source samples into a destination Sample through multiple transfer levels:
Generates visual maps that show the transfers of source samples into destination Samples listed under Contents in the input container:
Generates visual maps that show the transfers of source samples into destination Samples through multiple transfer levels:
Options (28)
Date (6)
Generates two graphs that shows the effect of selecting different dates for the transfers of source samples into a Sample:
Generates visual maps that show the transfers of source samples into a Sample before the given date:
Generates visual maps that show the transfers of source samples into a Sample before the given date in the past:
Generates visual maps that show the transfers of source samples into a Sample before the given day specification:
give an warning if the specified date is before the object creation date, and Generates visual maps that show the transfers of source samples into a Sample using Now for the date:
give an warning if the specified date is in the future, and Generates visual maps that show the transfers of source samples into a Sample using Now for the date:
GraphLayout (18)
Generates a graph using Automatic for the GraphLayout option:
Generates a graph using BalloonEmbedding for the GraphLayout option:
Generates a graph using CircularEmbedding for the GraphLayout option:
Generates a graph using CircularMultipartiteEmbedding for the GraphLayout option:
Generates a graph using DiscreteSpiralEmbedding for the GraphLayout option:
Generates a graph using GravityEmbedding for the GraphLayout option:
Generates a graph using GridEmbedding for the GraphLayout option:
Generates a graph using LayeredDigraphEmbedding for the GraphLayout option:
Generates a graph using LayeredEmbedding and Automatic for the layout:
Generates a graph using LayeredEmbedding for the GraphLayout option:
Generates a graph using LinearEmbedding for the GraphLayout option:
Generates a graph using MultipartiteEmbedding for the GraphLayout option:
Generates a graph using RadialEmbedding for the GraphLayout option:
Generates a graph using SpectralEmbedding for the GraphLayout option:
Generates a graph using SpringElectricalEmbedding for the GraphLayout option:
Generates a graph using SpringEmbedding for the GraphLayout option:
Generates a graph using StarEmbedding for the GraphLayout option:
Generates a graph using TutteEmbedding for the GraphLayout option:
LevelsDown (3)
Generates a graph showing a single level of transfers:
Generates a graph showing a tree of all transfers into a sample. Each additional level captures further layers of transfers, where each level represents transfers made into the source samples of the previous level:
Generates a graph showing a tree of up to 10 levels. The function runs until no more TransfersIn are recorded or 10 levels are reached: