ecl-logo Documentation

PlotAgarose

PlotAgarose[agaroseDataObject]plot

plots the agaroseDataObject SampleElectropherogram as a list line plot.

Details

    Input
    Output
    Data Specifications Options
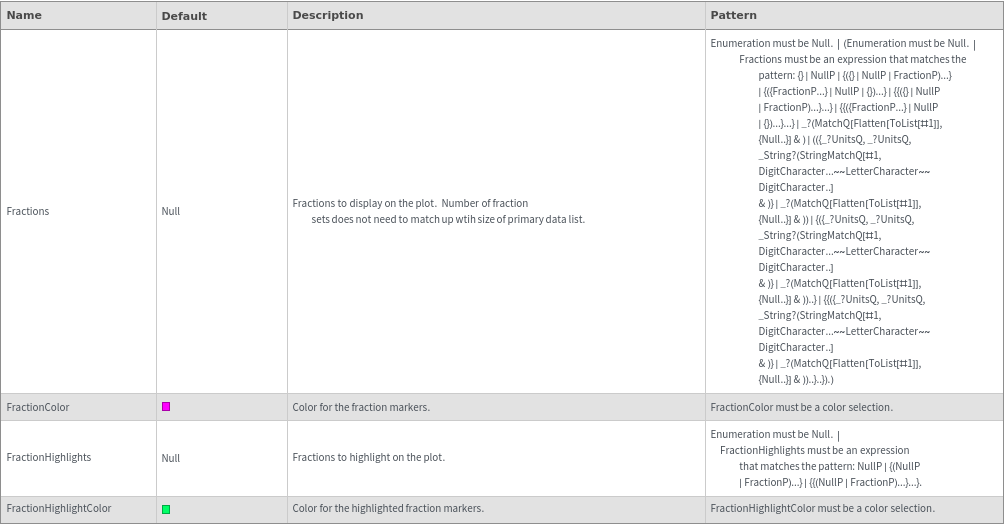
    Fractions Options
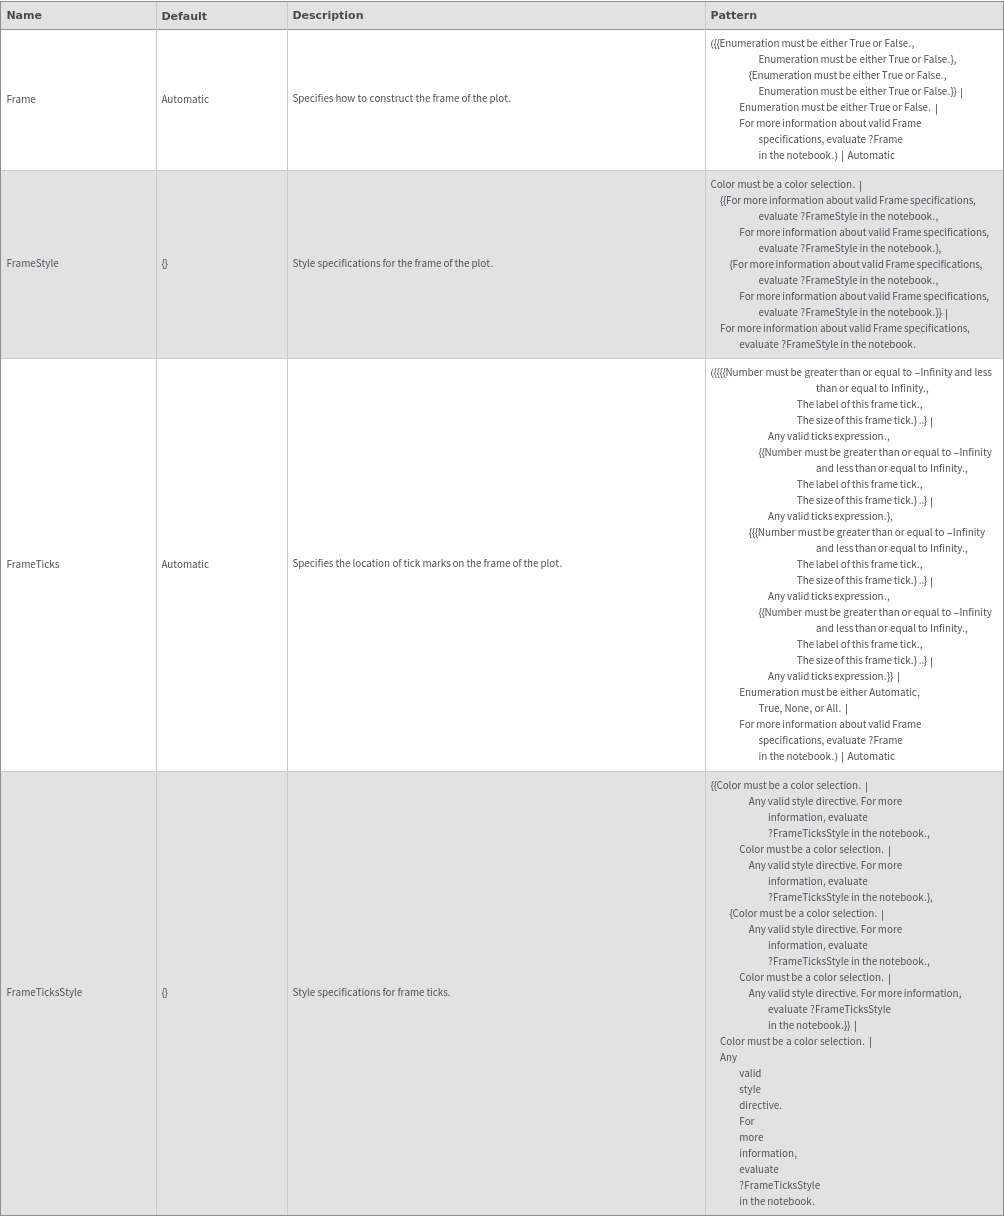
    Frame Options
    Grid Options
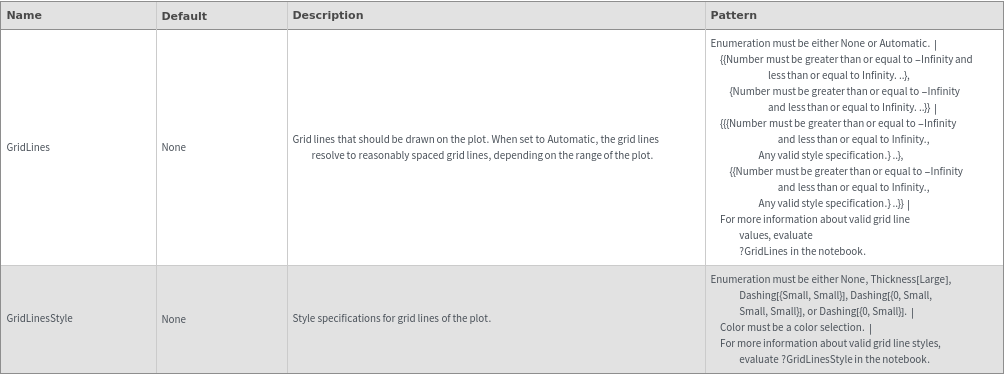
    Image Format Options
    Ladder Options
    Legend Options
    Peaks Options
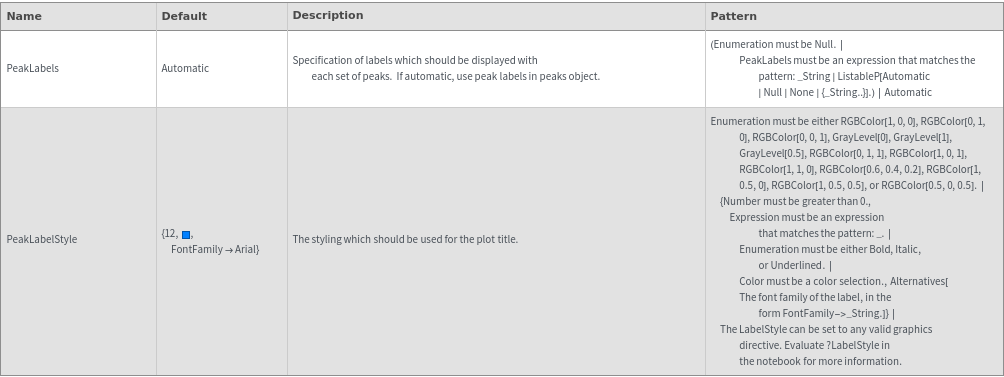
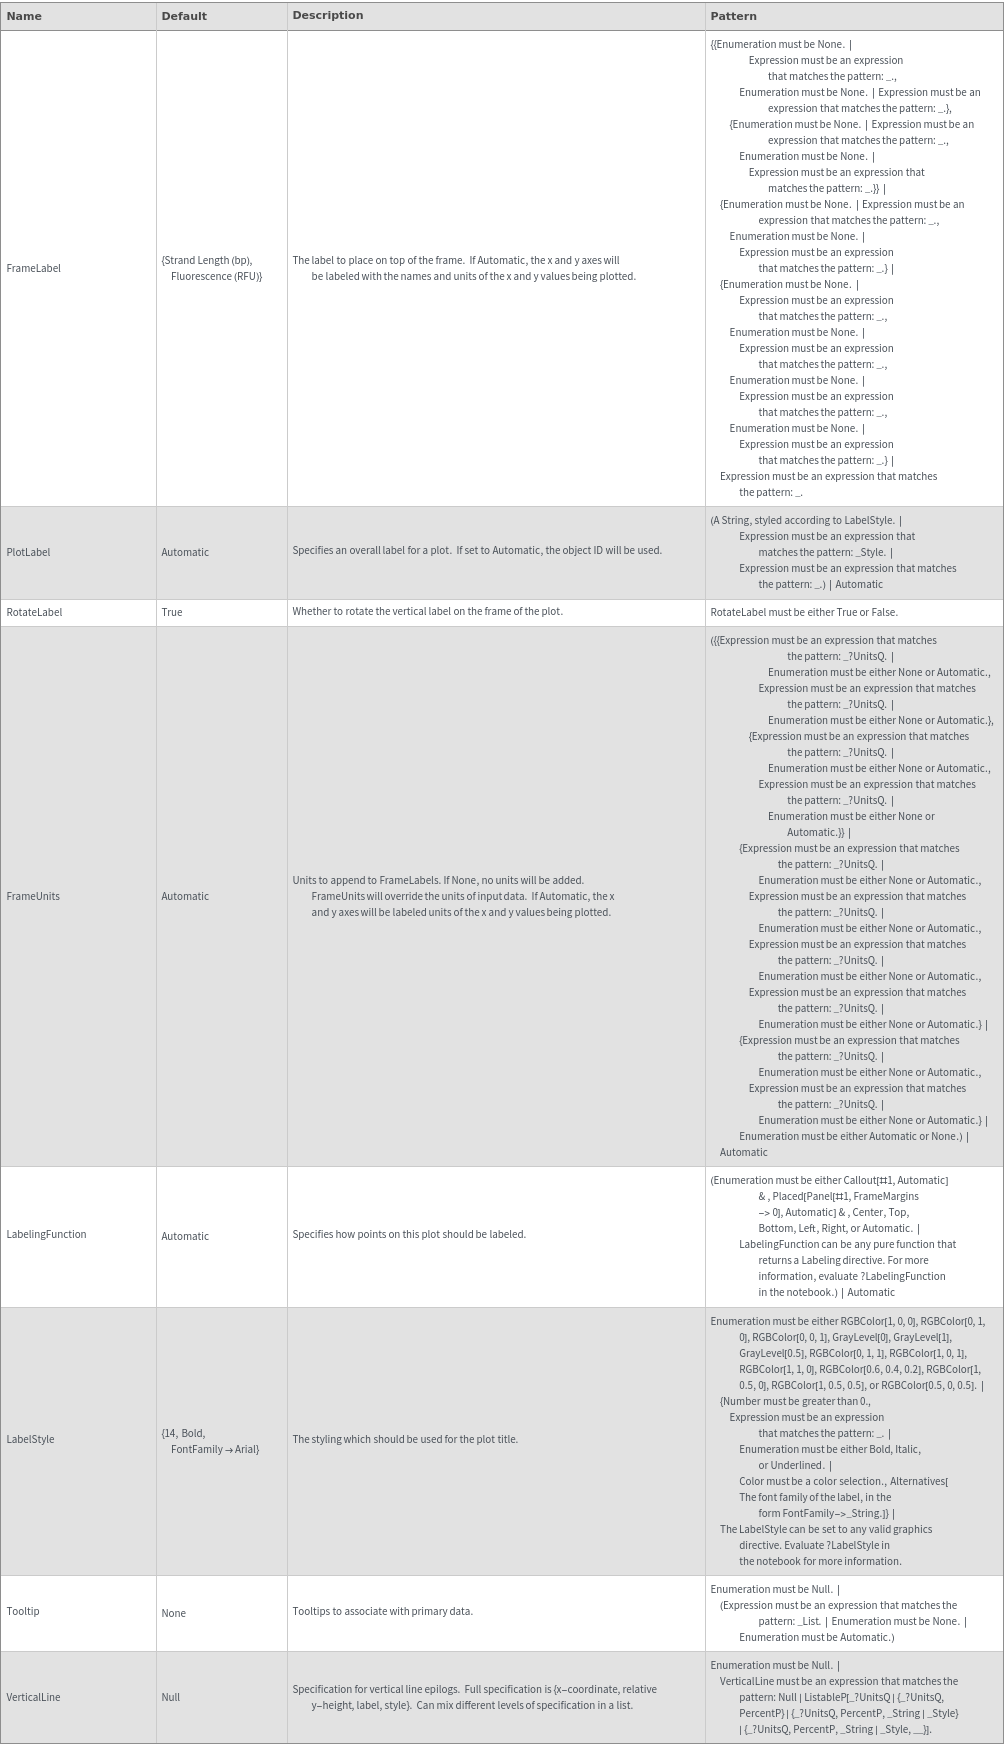
    Plot Labeling Options
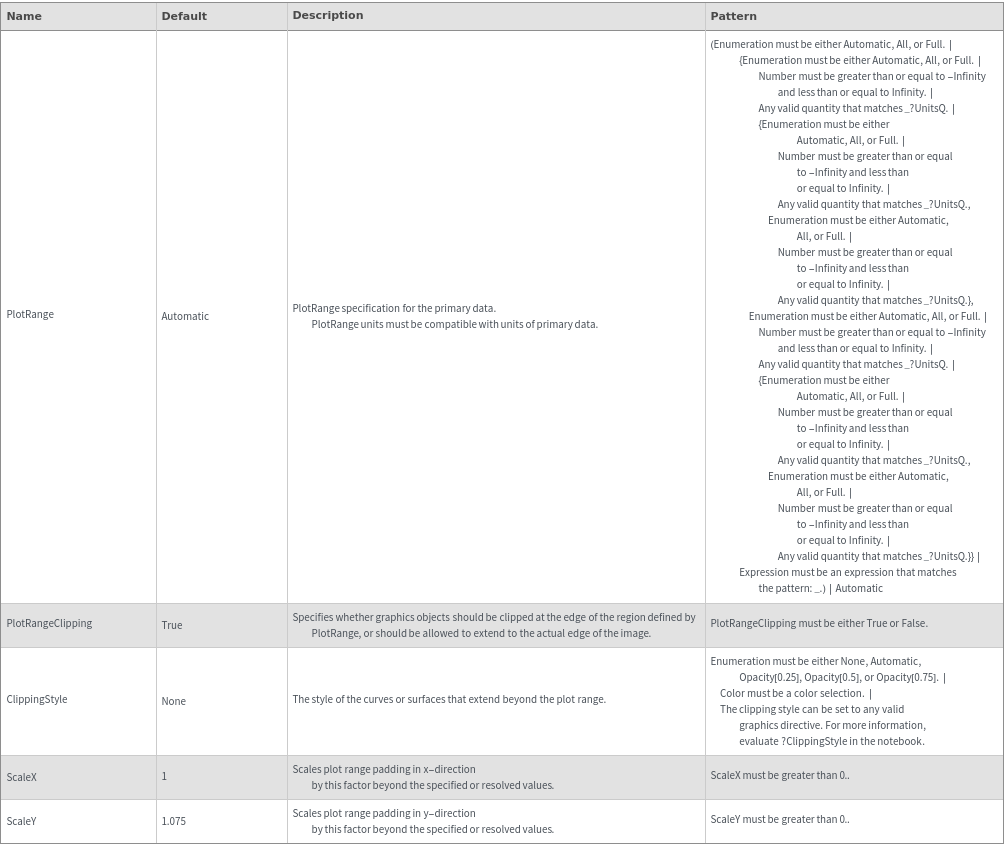
    Plot Range Options
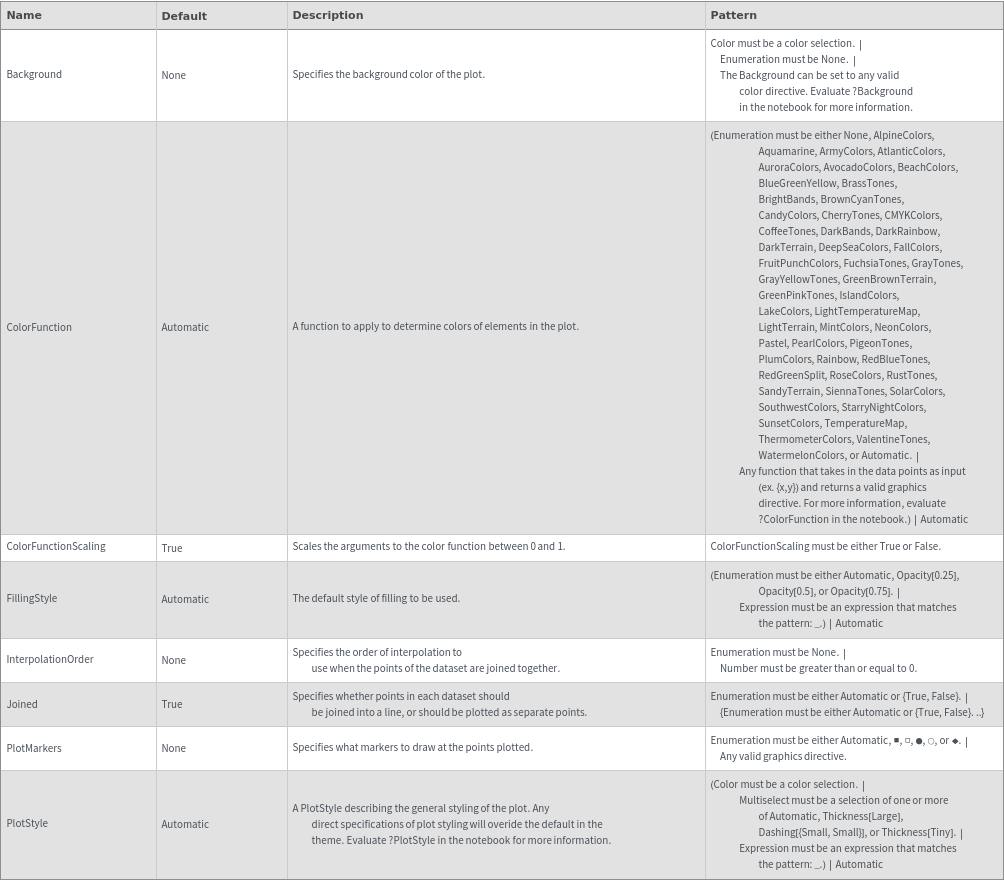
    Plot Style Options
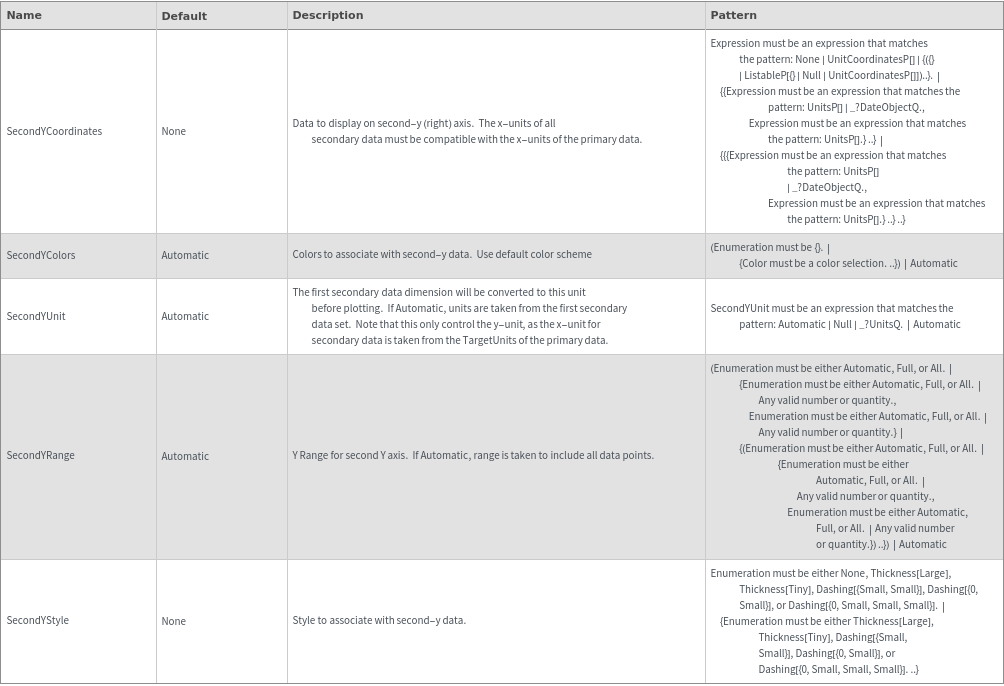
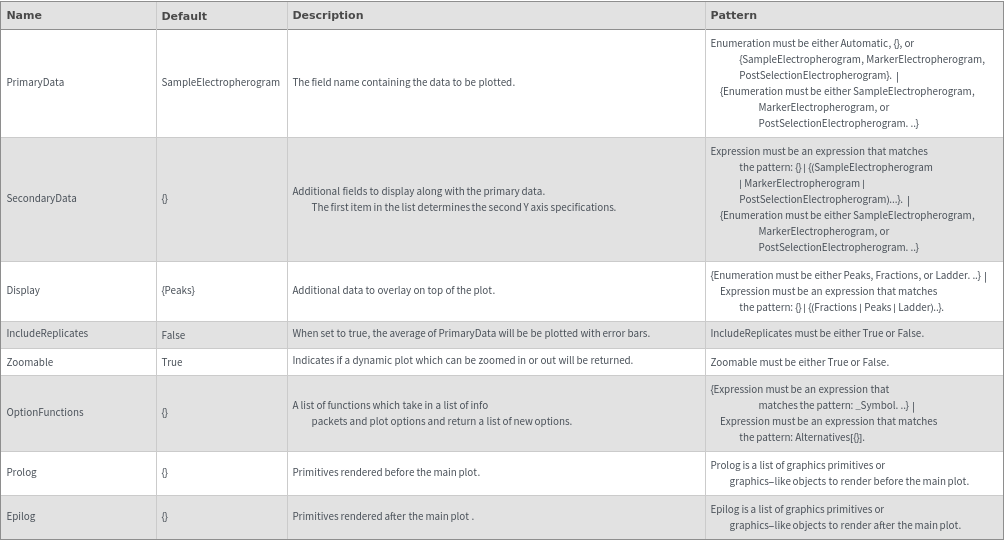
    Secondary Data Options
    General Options
Examples

Basic Examples  (2)

Given an AgaroseGelElectrophoresis data object, creates a plot for the SampleElectropherogram:

Plot a AgaroseGelElectrophoresis data in a link:

Options  (17)

Boxes  (1)

If true, the legend will pair each label with a colored box. If false, the labels will be paired with a colored line:

Display  (1)

Additional data to overlay on top of the plot:

FrameLabel  (1)

The label to place on top of the frame:

ImageSize  (1)

Set the image size for the output plots:

IncludeReplicates  (1)

When set to true, the average of PrimaryData will be be plotted with error bars:

Legend  (1)

A list of text descriptions of each data set in the plot:

LegendPlacement  (1)

Specifies where the legend will be placed relative to the plot:

MarkerElectropherogram  (1)

The sample electropherogram trace to display on the plot:

OptionFunctions  (1)

A list of functions which take in a list of info packets and plot options and return a list of new options:

Peaks  (1)

Specification of peaks for primary data:

PlotLabel  (1)

Specifies an overall label for a plot:

PostSelectionElectropherogram  (1)

The post selection electropherogram trace to display on the plot:

PrimaryData  (1)

The field name containing the data to be plotted:

SampleElectropherogram  (1)

The sample electropherogram trace to display on the plot:

SecondaryData  (1)

Additional fields to display along with the primary data:

TargetUnits  (1)

The units of the x and y axes. If these are distinct from the units currently associated with the data, unit conversions will occur before plotting:

Zoomable  (1)

Indicates if a dynamic plot which can be zoomed in or out will be returned: