PlotBioLayerInterferometry
PlotBioLayerInterferometry[data]⟹figure
plots the data contained in data as appropriate for the type of assay the data was generated from.
PlotBioLayerInterferometry[protocol]⟹figure
plots the data contained in protocol as appropriate for the type of assay the data was generated from.
Details
Input
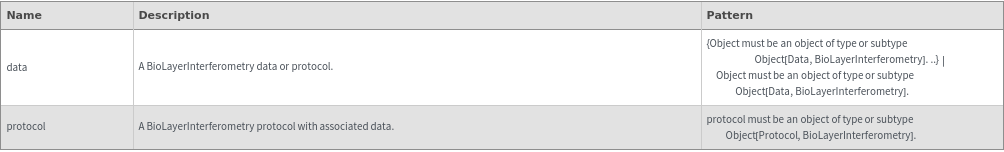
Output

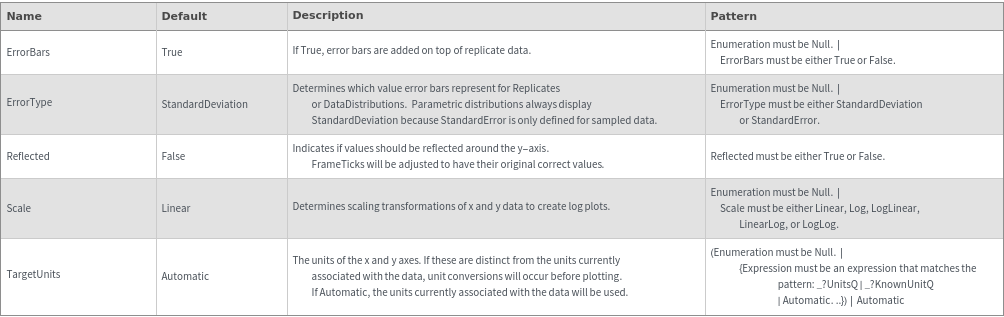
Data Specifications Options
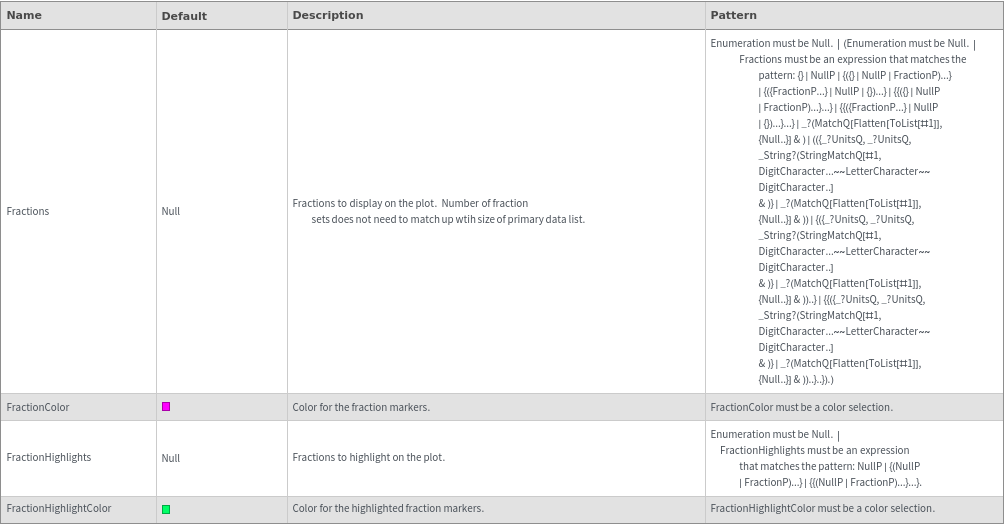
Fractions Options
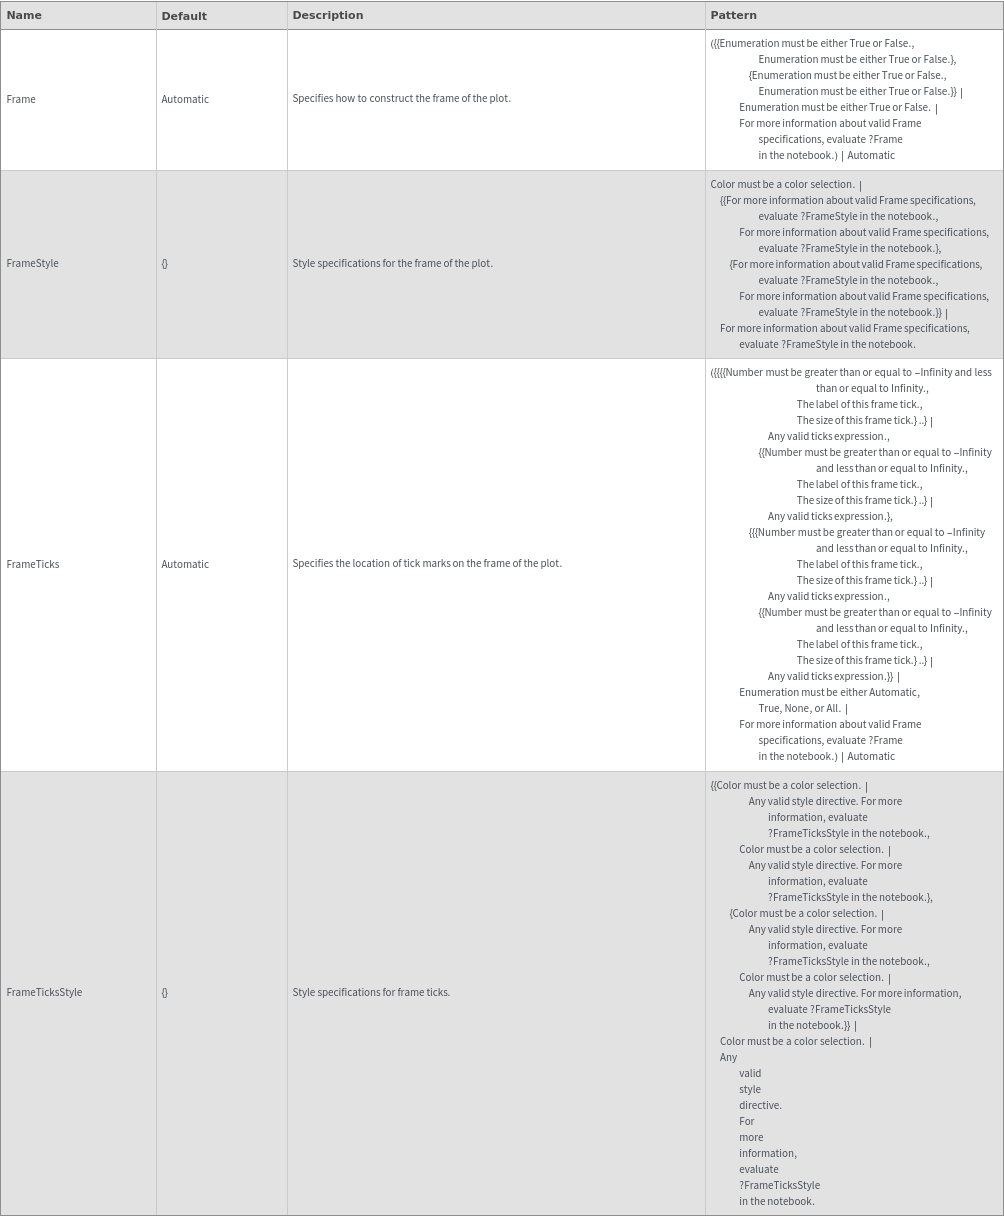
Frame Options
Grid Options
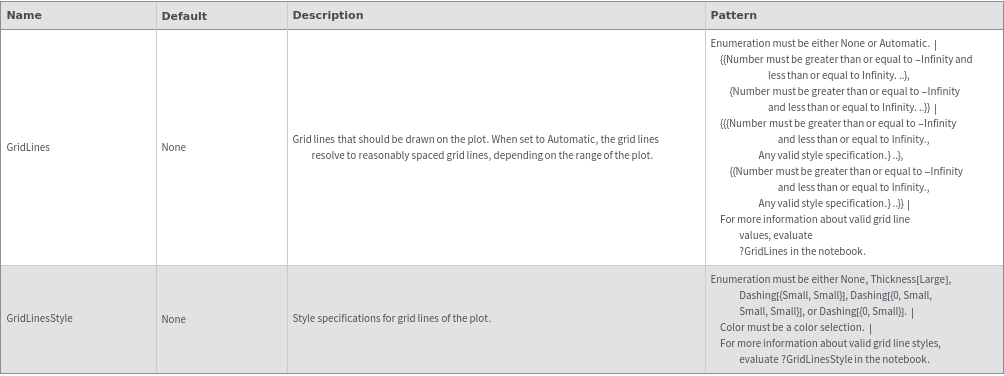
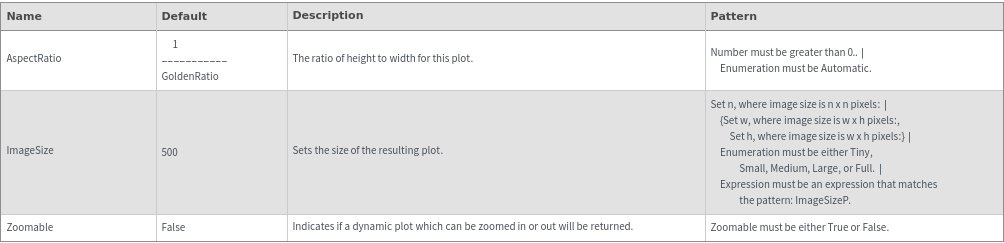
Image Format Options
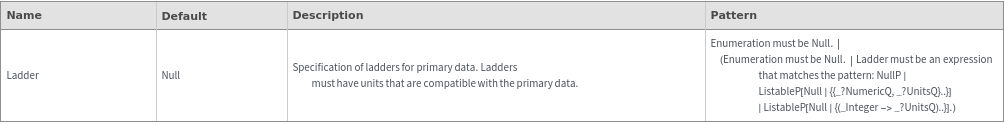
Ladder Options
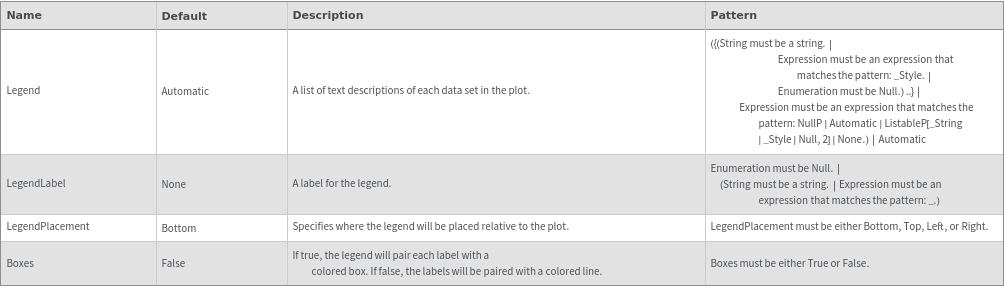
Legend Options
Peaks Options
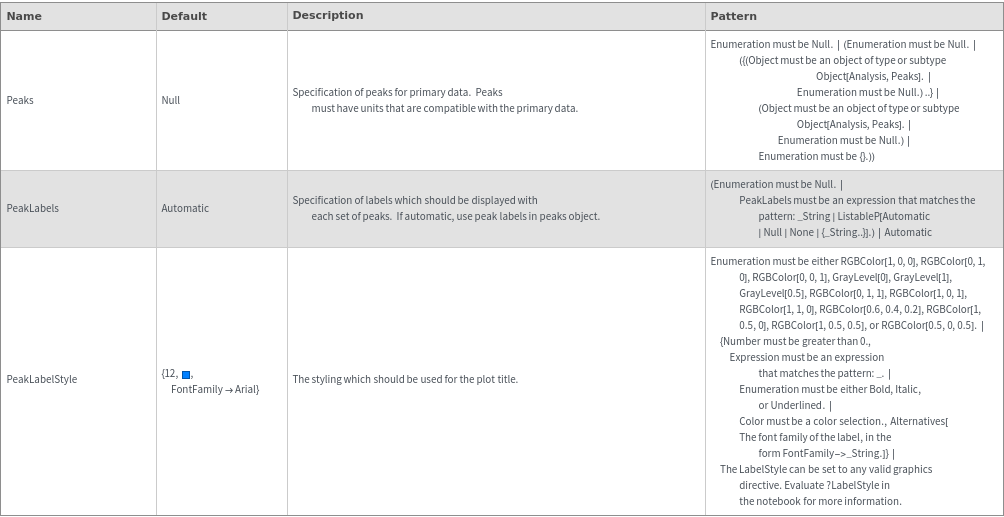
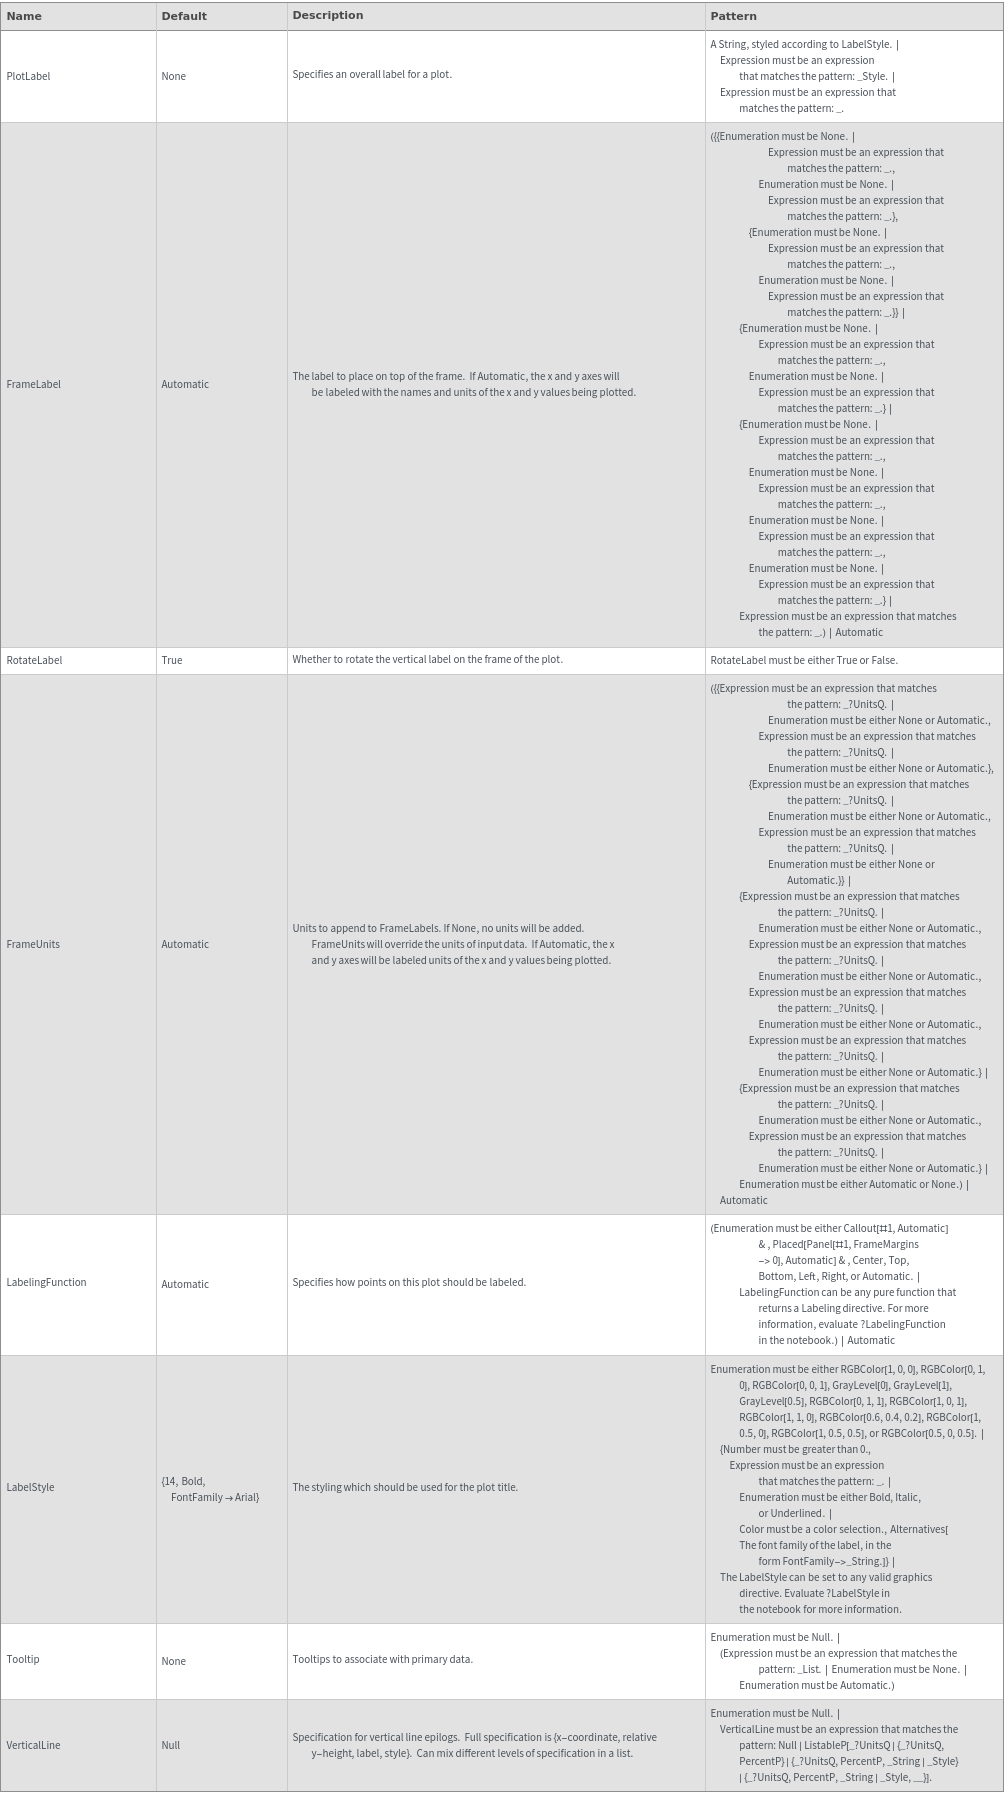
Plot Labeling Options
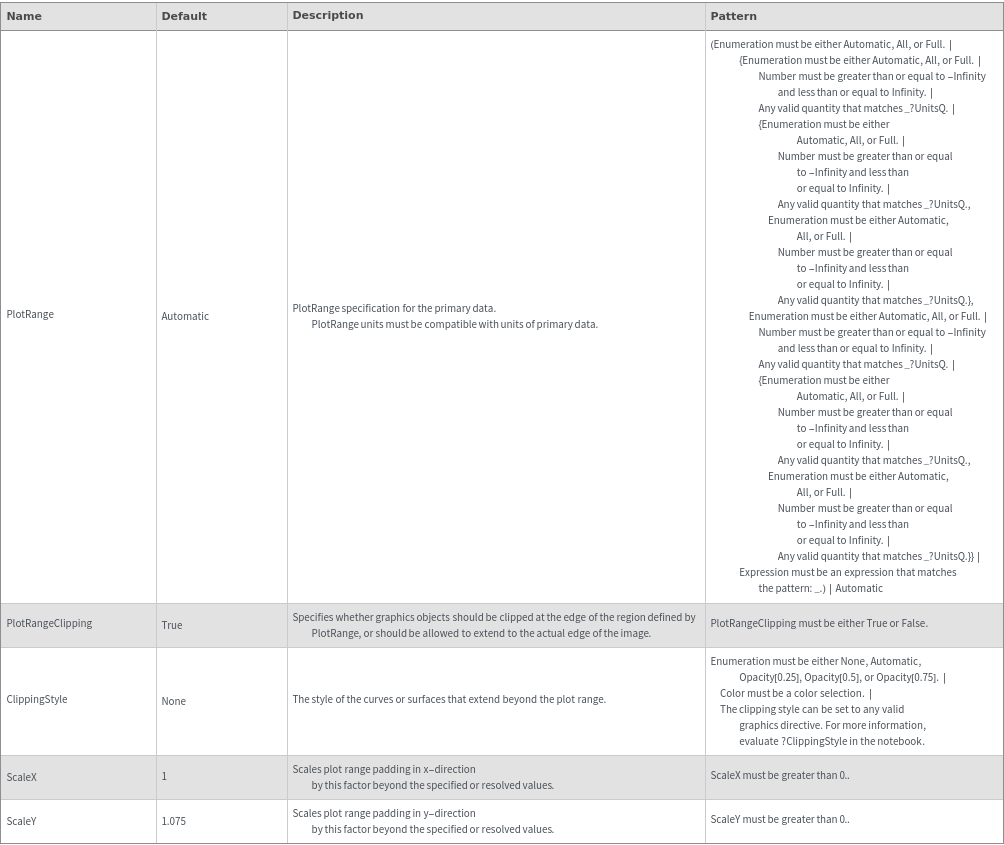
Plot Range Options
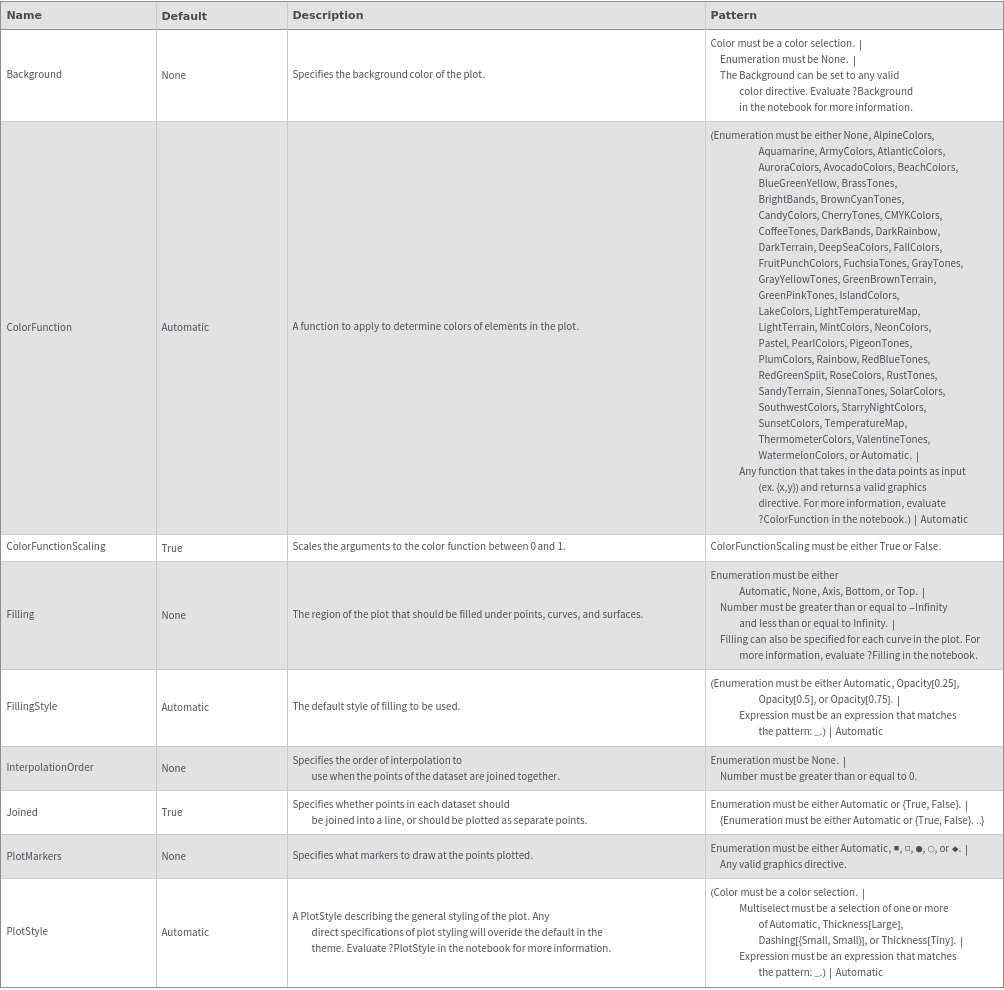
Plot Style Options
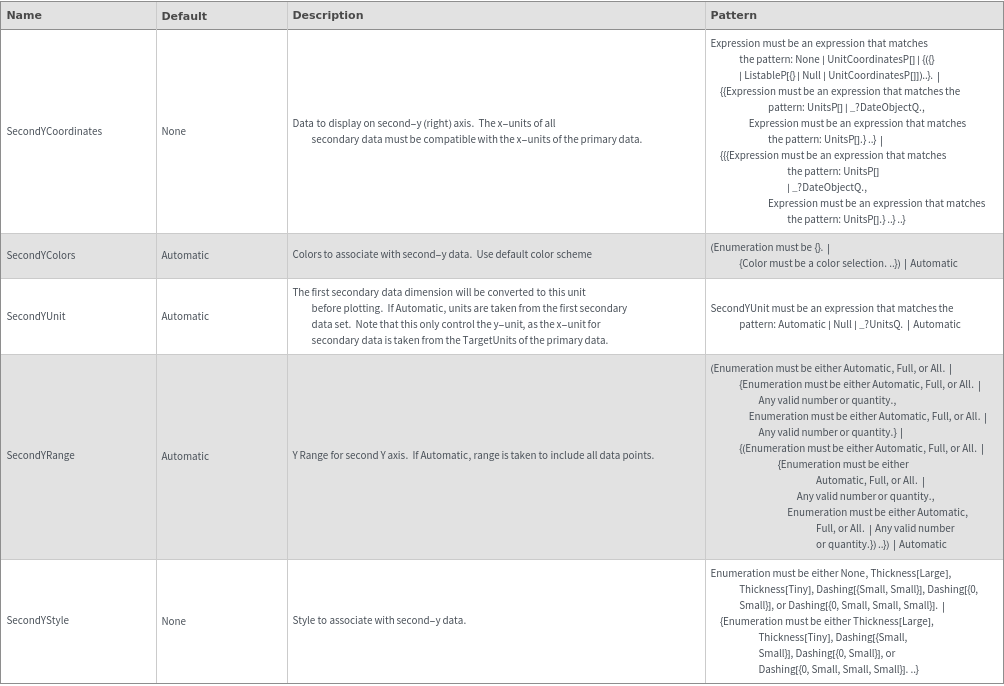
Secondary Data Options
General Options
Examples
Basic Examples (3)
Given an unanalyzed Object[Data,BioLayerInterferometry] with kinetics data, PlotBioLayerInterferometry returns an plot:

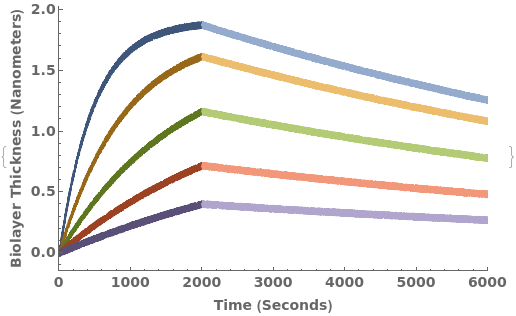
Given an analyzed Object[Data,BioLayerInterferometry] with kinetics data, PlotBioLayerInterferometry returns an plot:
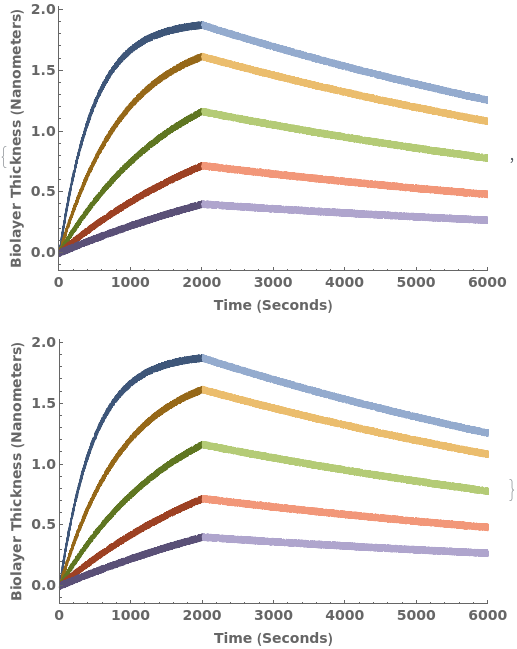
Given an Object[Protocol,BioLayerInterferometry] with associated kinetics data, PlotBioLayerInterferometry returns plot for all associated data objects:

Options (3)
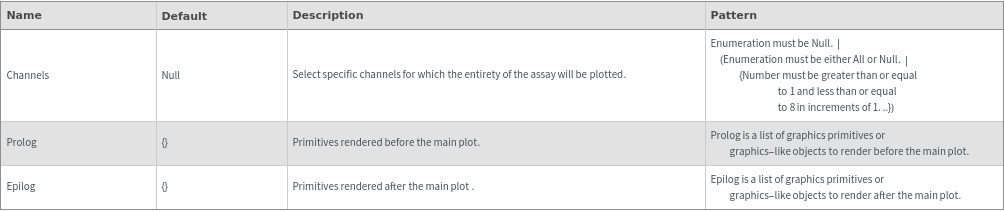
Channels (3)
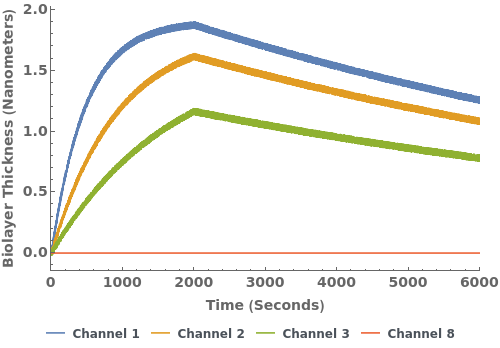
Given a Object[Data,BioLayerInterferometry] with any data, PlotBioLayerInterferometry returns an plot showing the binding for the specified channels:

Given a Object[Data,BioLayerInterferometry] with any data, PlotBioLayerInterferometry returns an plot showing the binding for all channels:

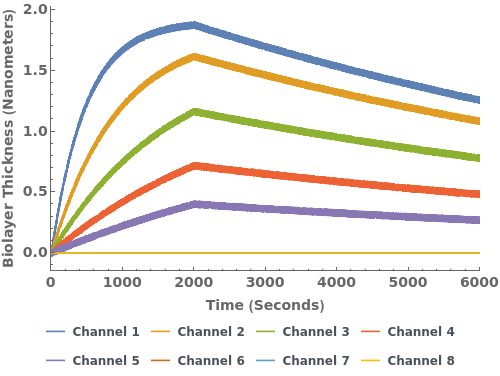
Given a Object[Data,BioLayerInterferometry] with any data, PlotBioLayerInterferometry returns an plot showing the binding for all channels:


