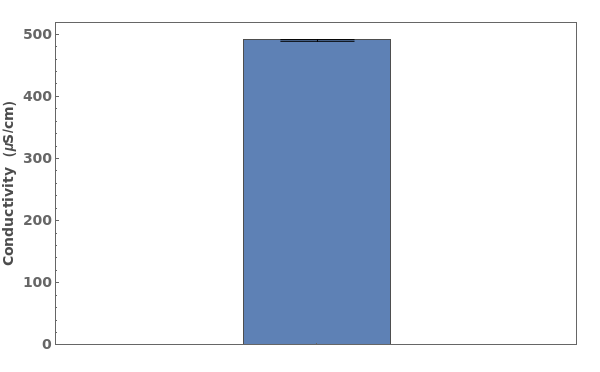
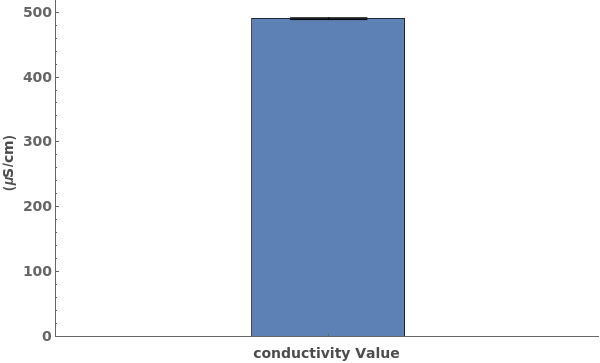
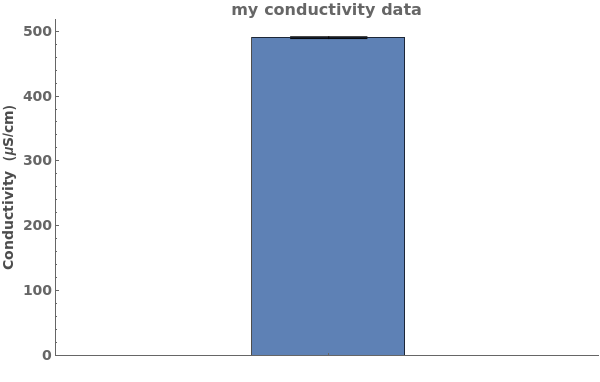
PlotConductivity
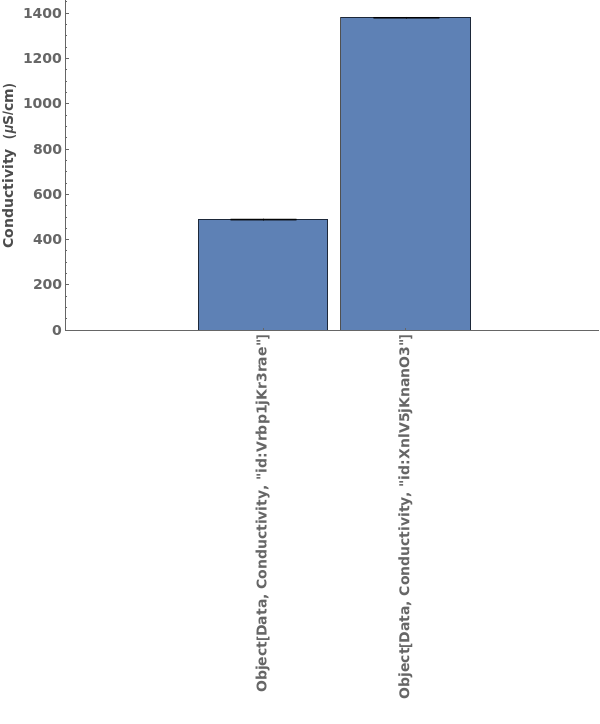
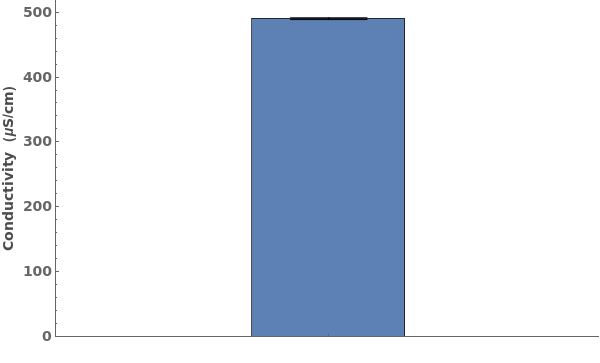
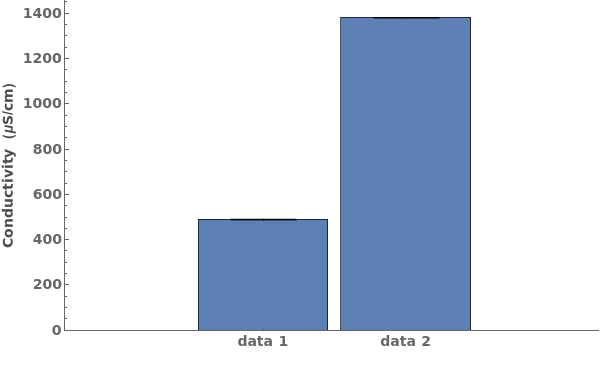
PlotConductivity[conductivityData]⟹plot
generates a graphical plot of the data stored in the pH data object.
Details
Input

Output

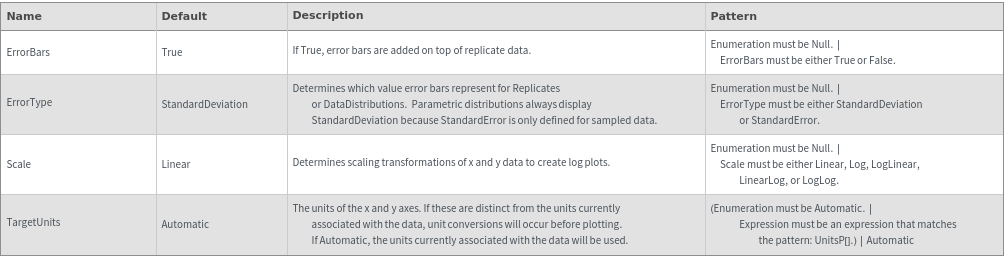
Data Specifications Options
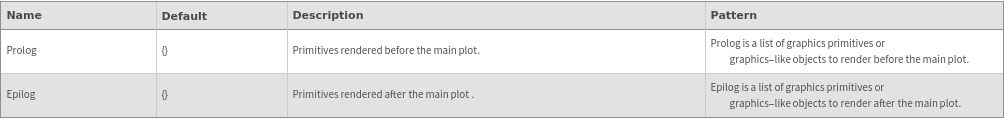
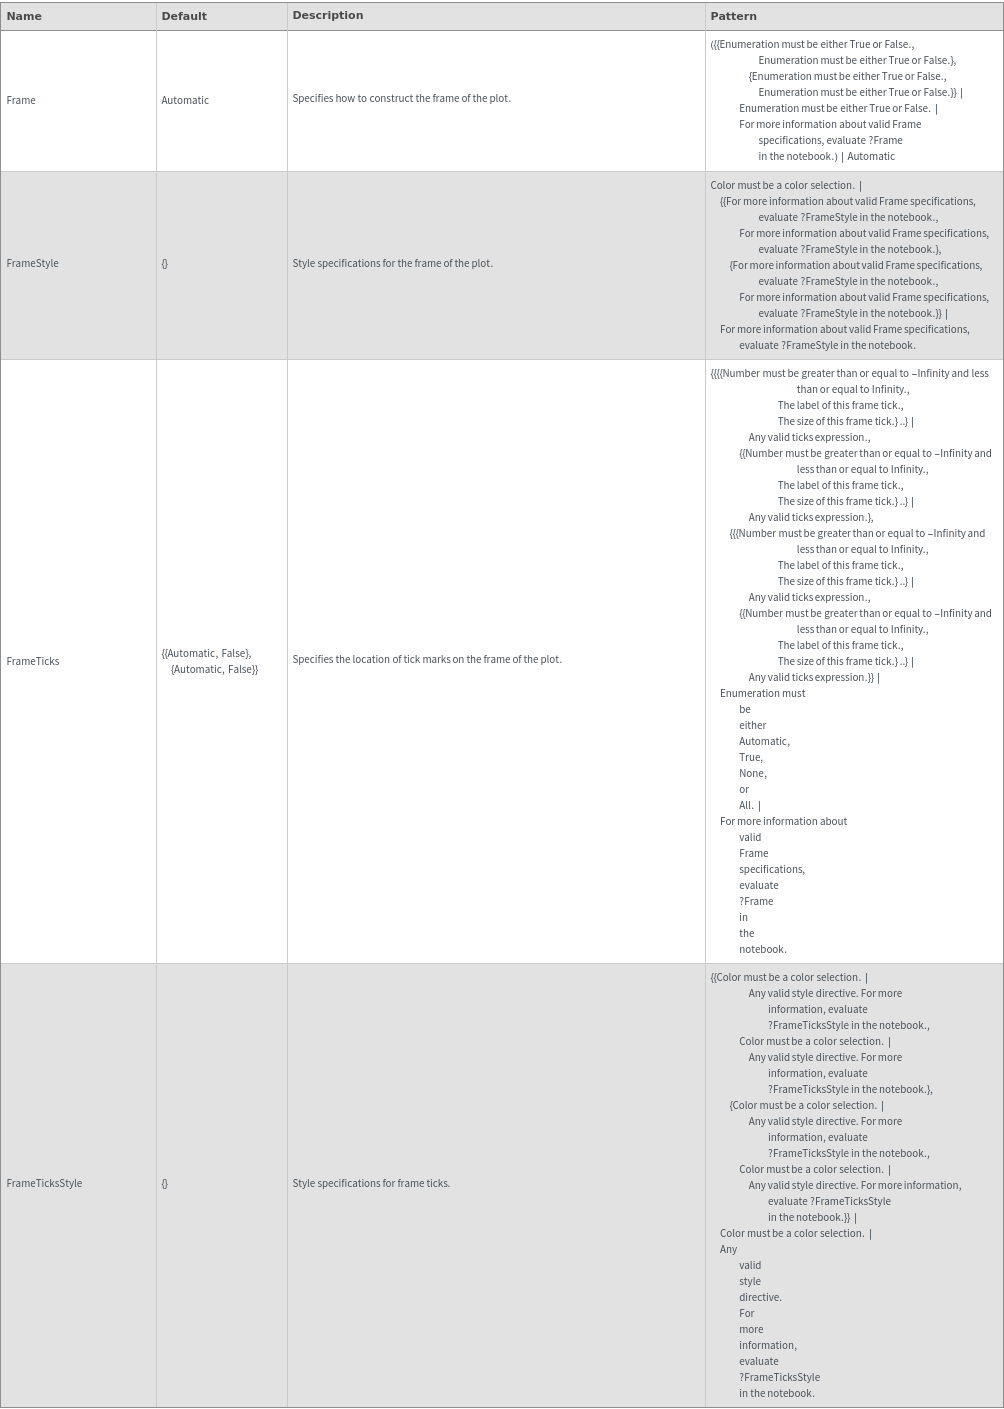
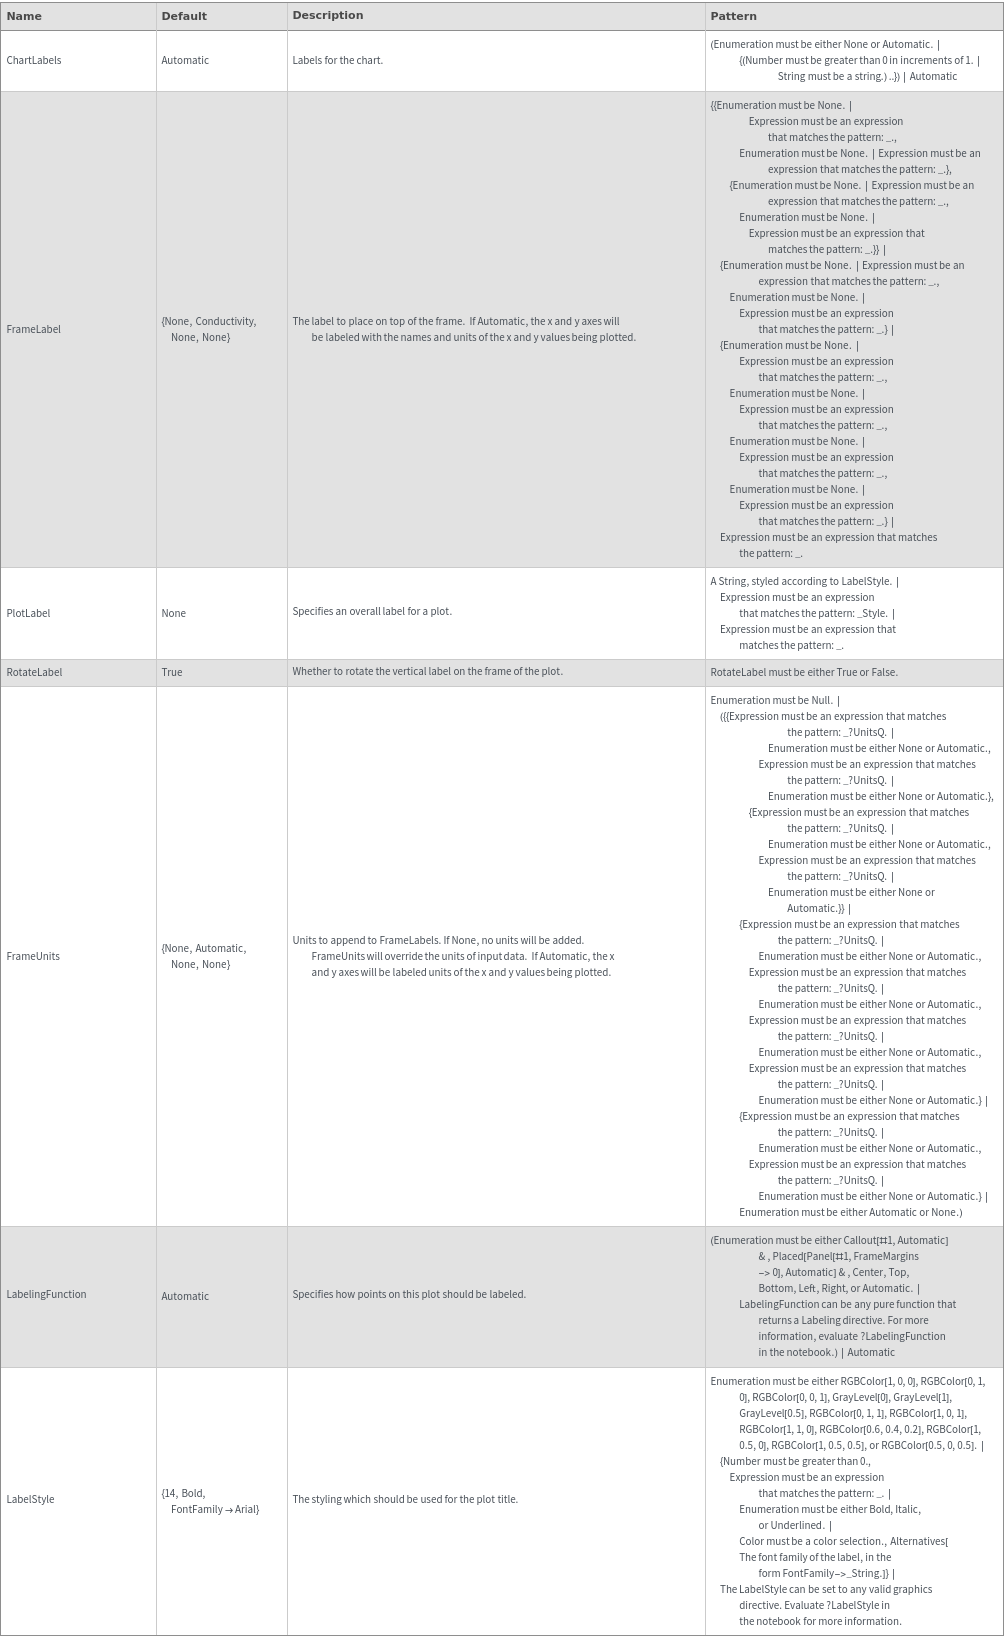
Frame Options
Grid Options
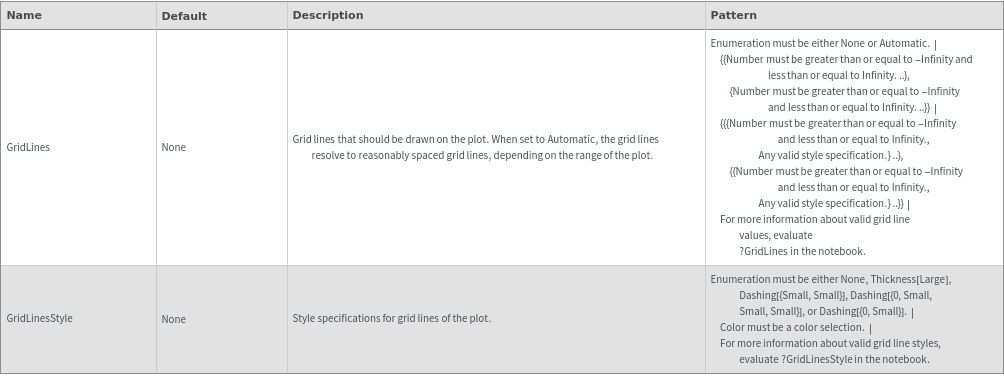
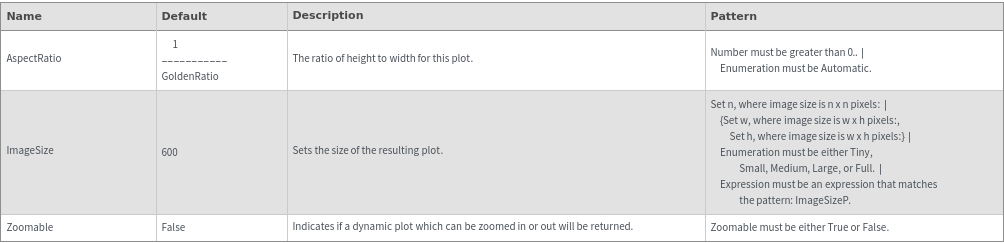
Image Format Options
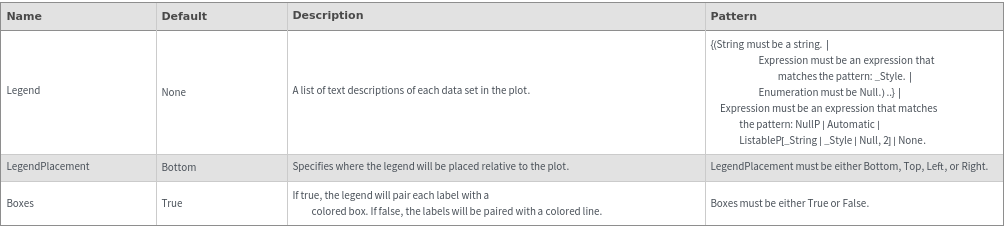
Legend Options
Plot Labeling Options
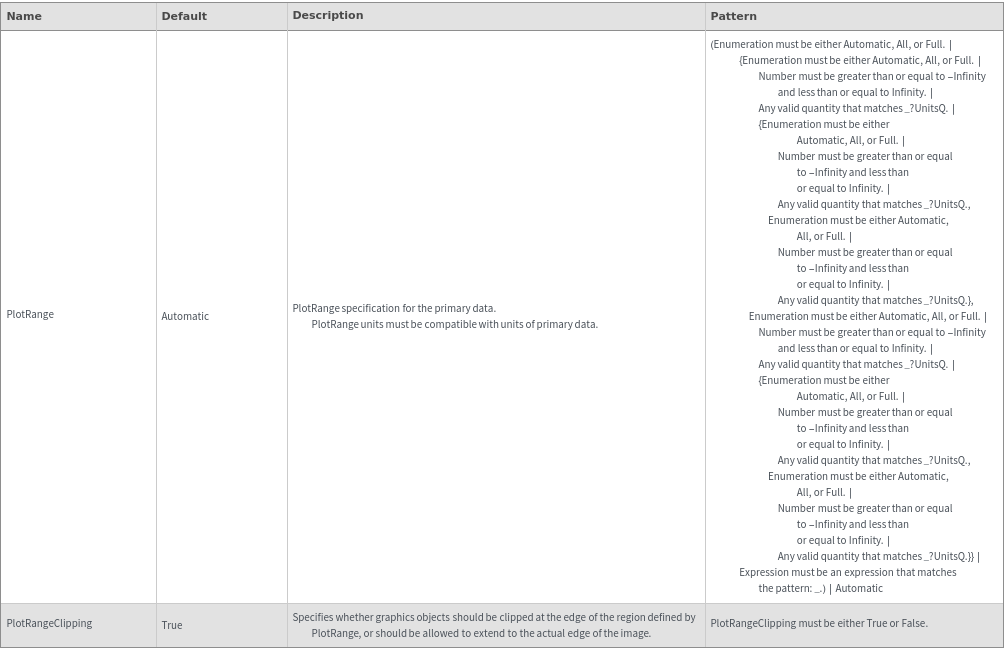
Plot Range Options
Plot Style Options
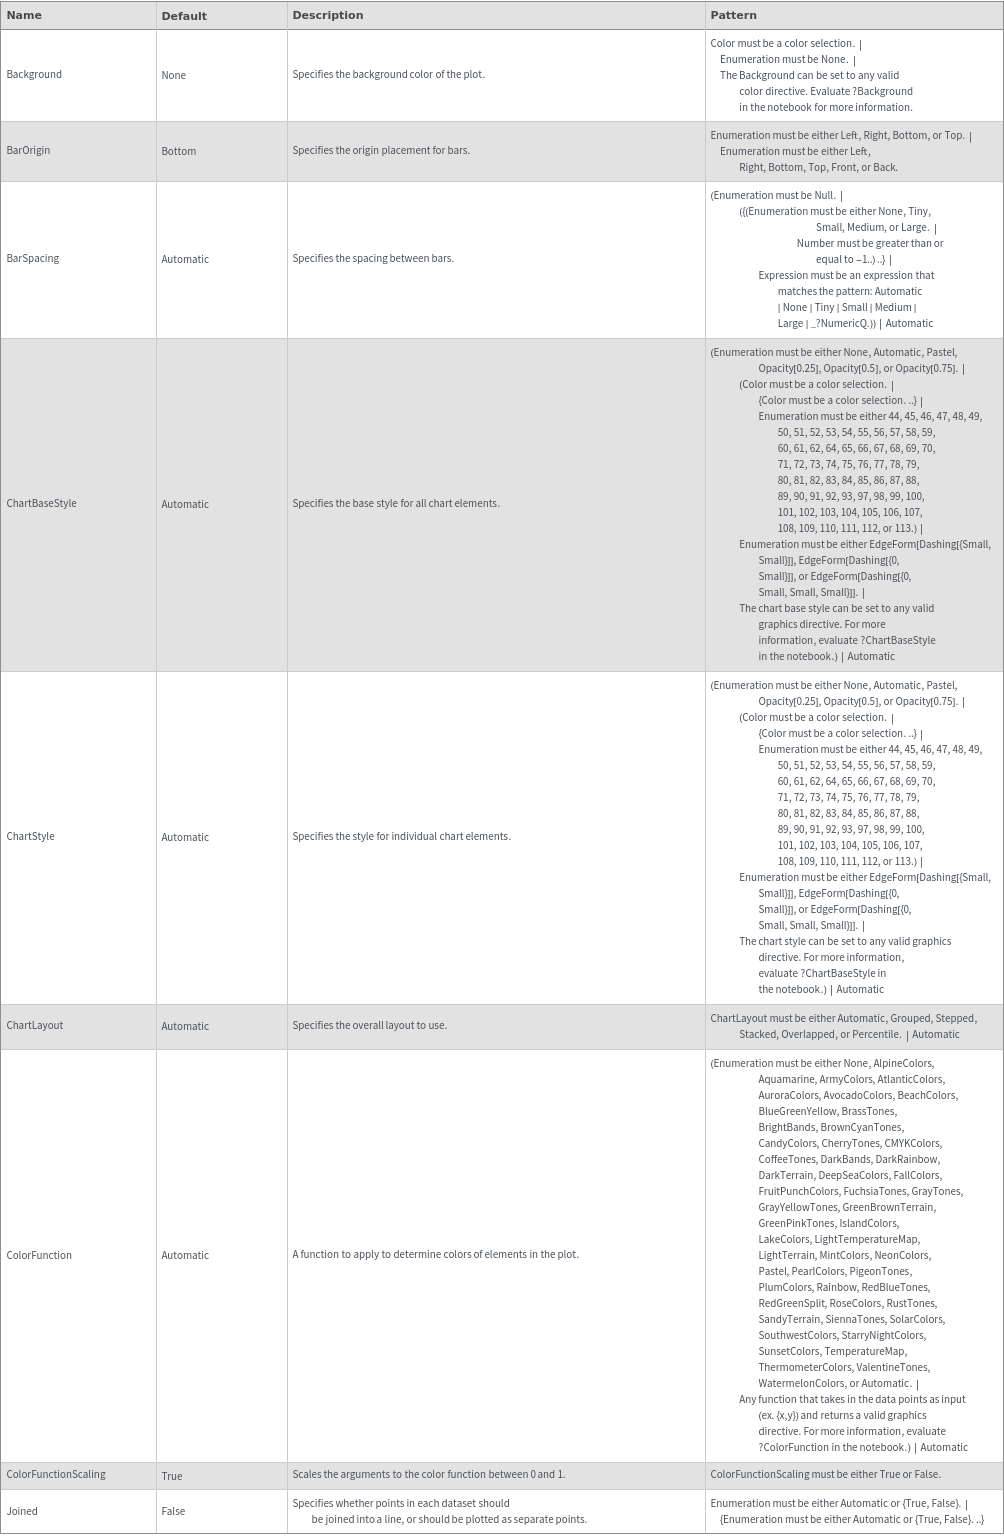
General Options