PlotDigitalPCR
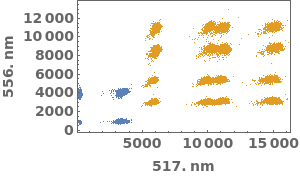
PlotDigitalPCR[data]⟹plot
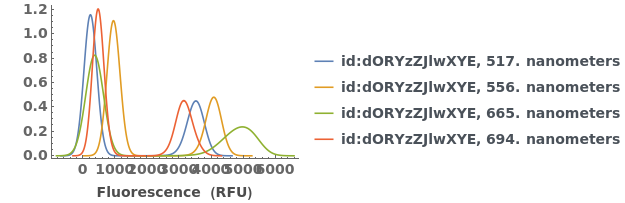
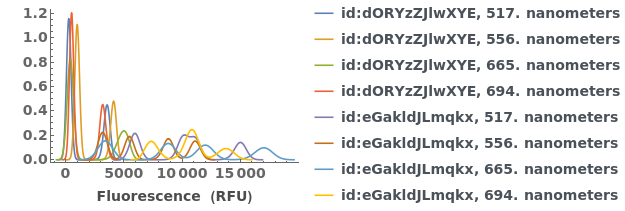
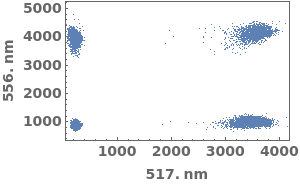
creates a plot using fluorescence signal amplitude values for droplets in data.
Details
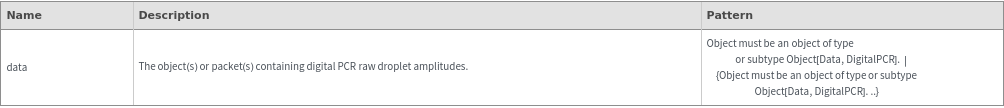
Input
Output

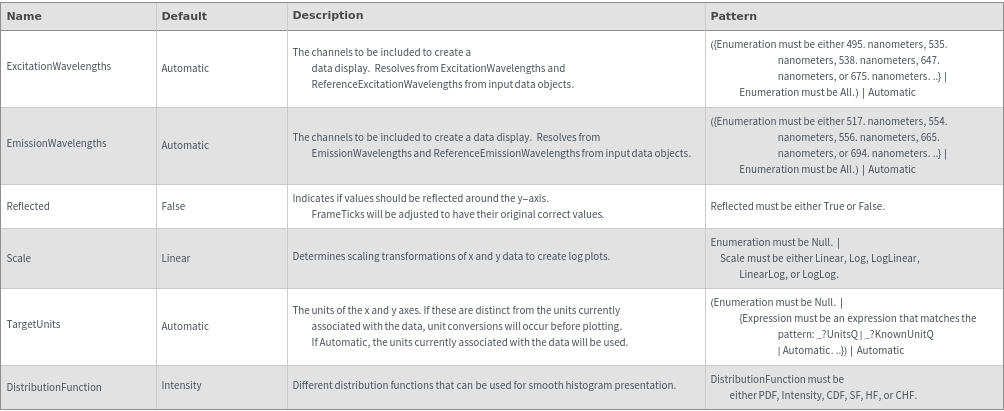
Data Specifications Options
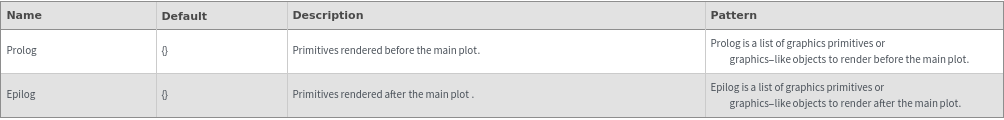
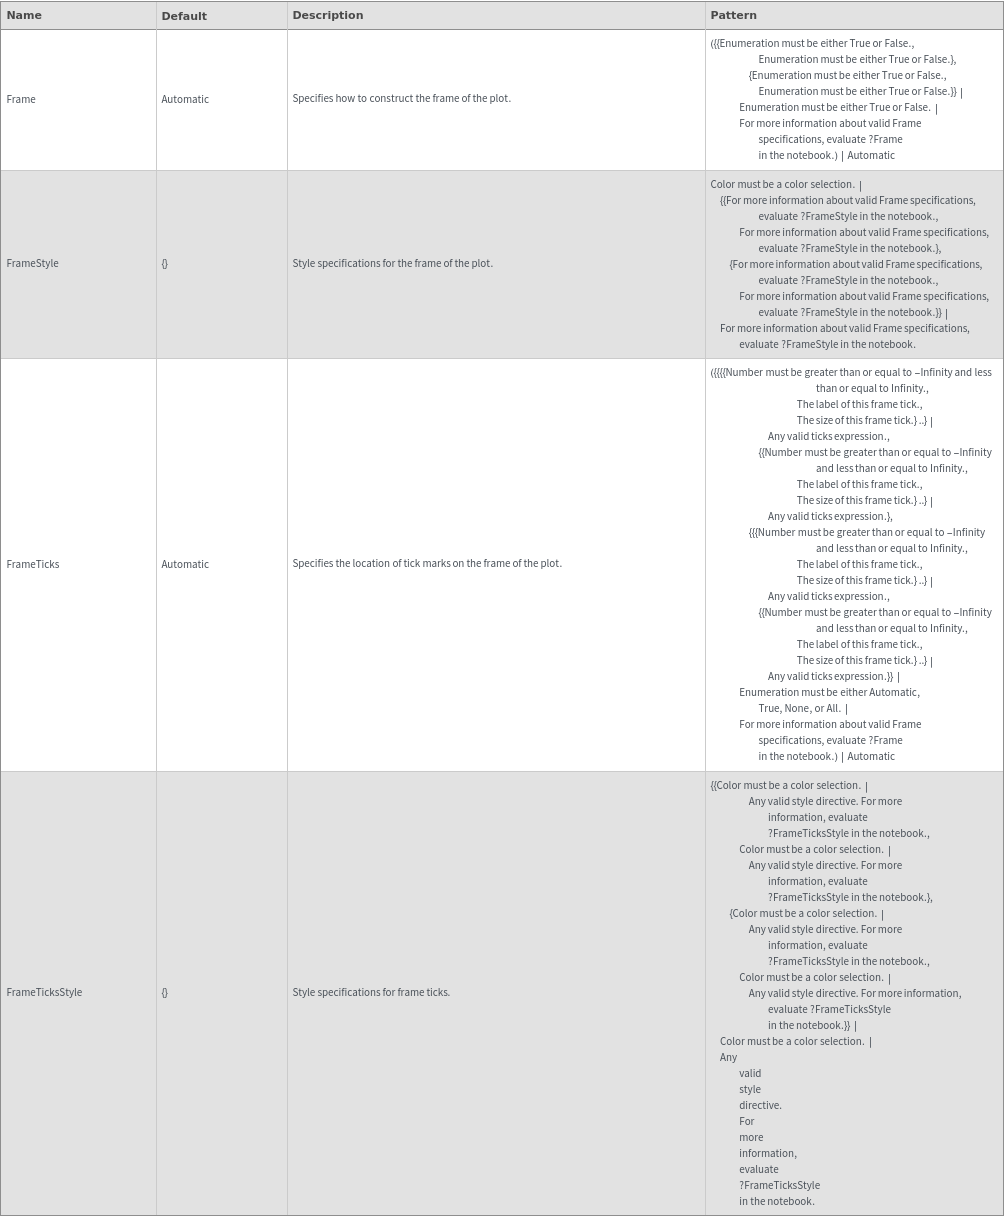
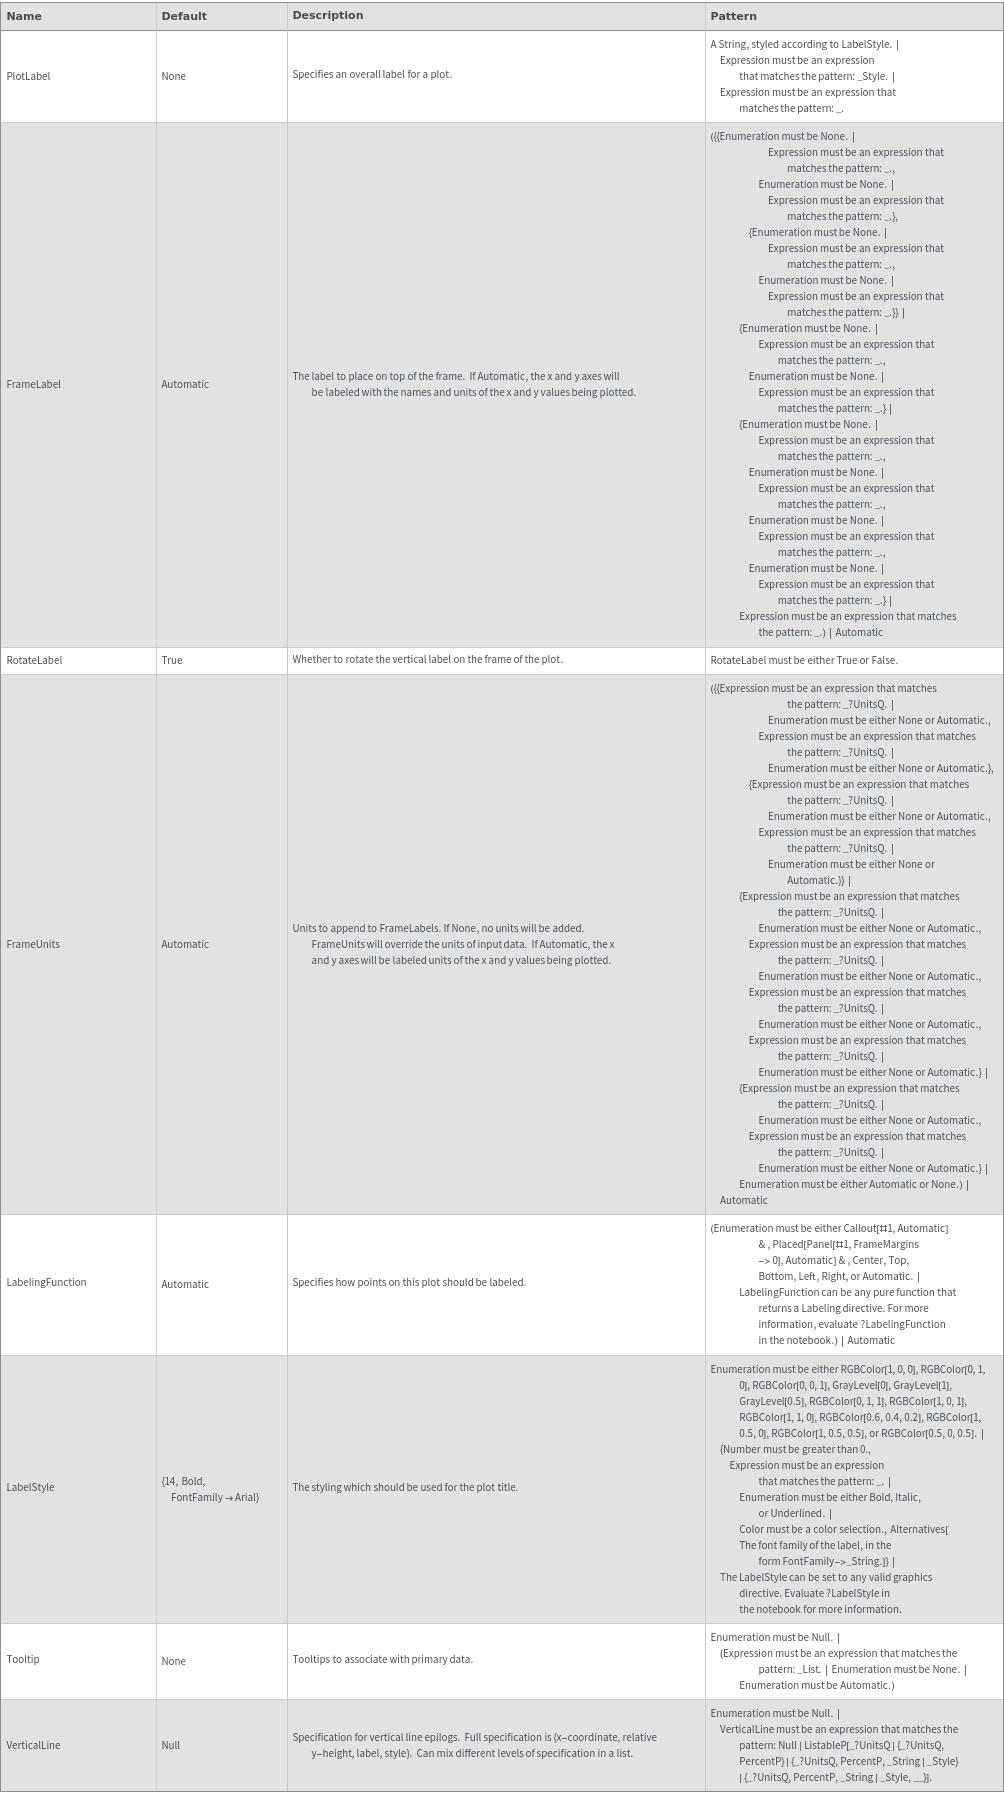
Frame Options
Grid Options
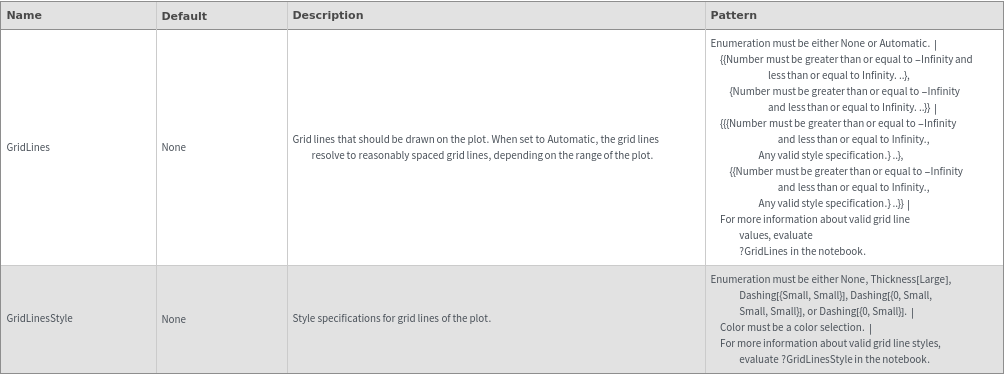
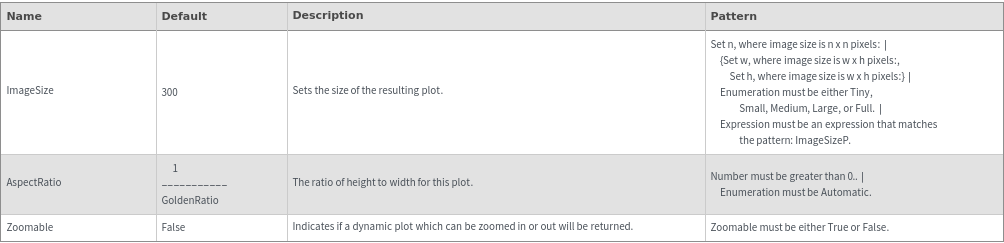
Image Format Options
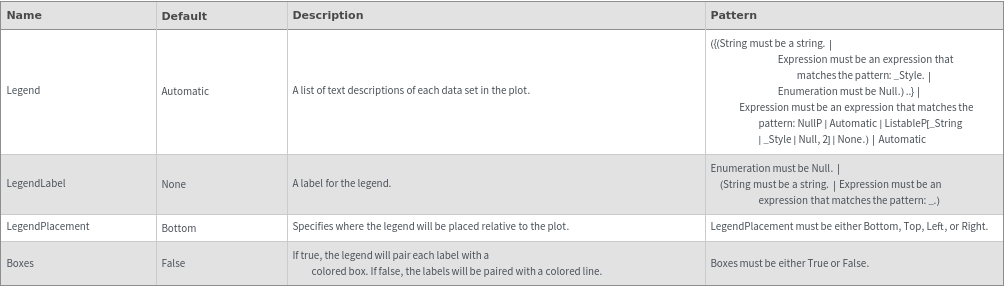
Legend Options
Plot Labeling Options
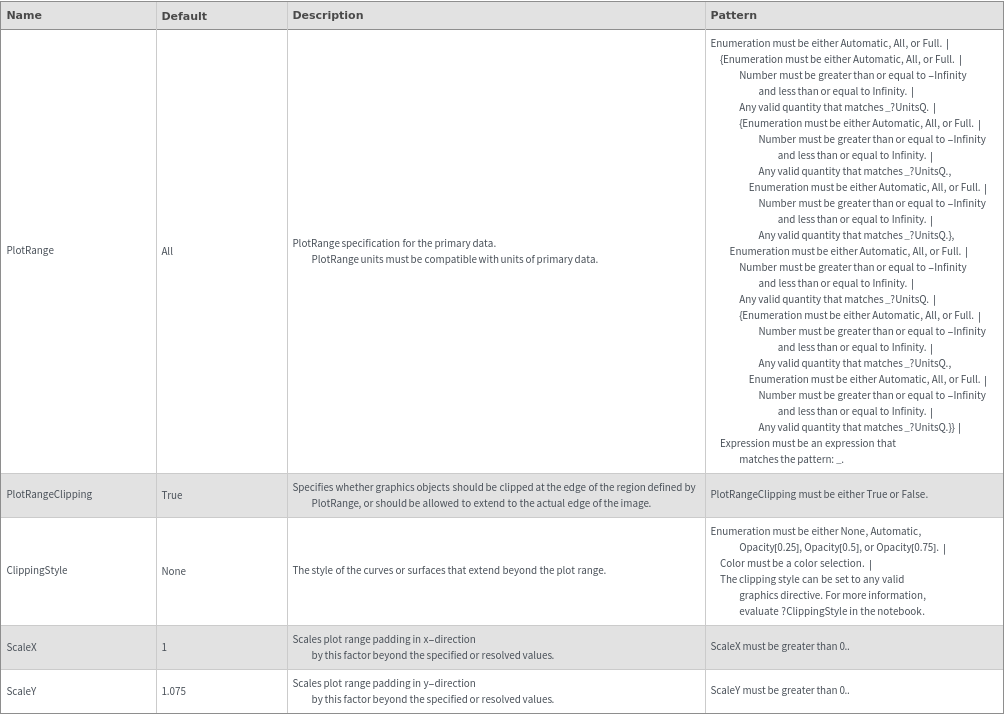
Plot Range Options
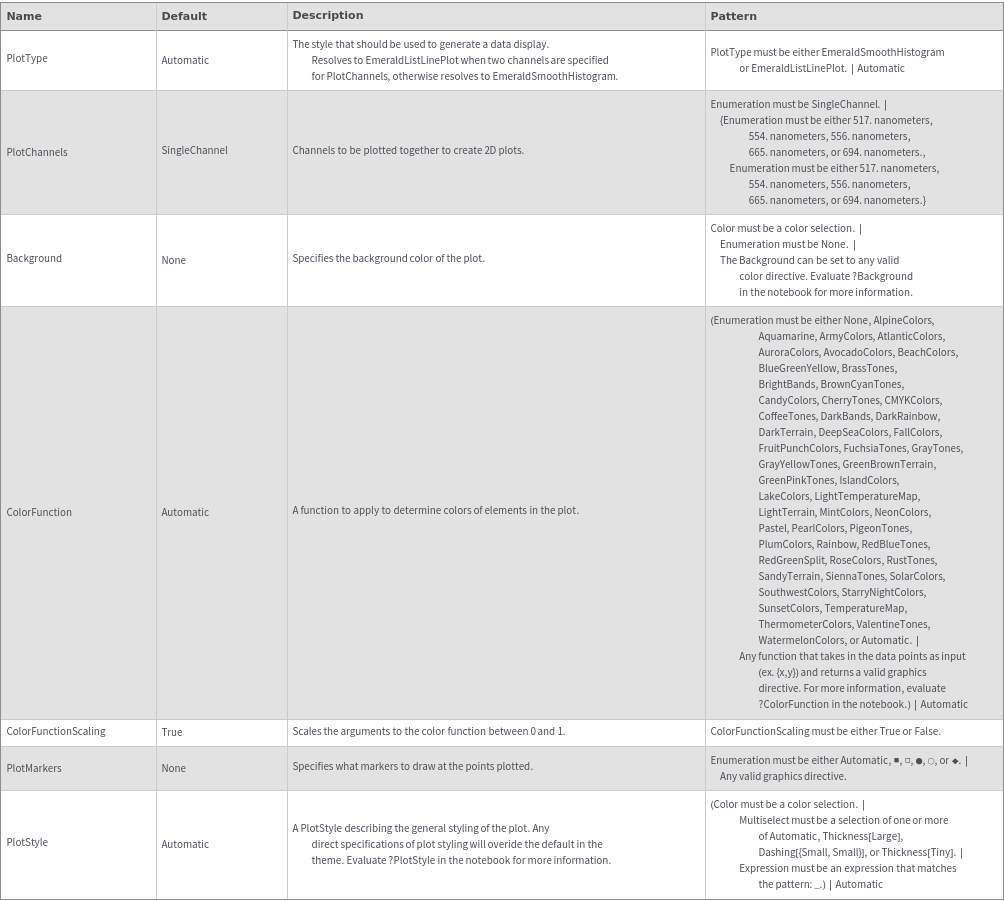
Plot Style Options
General Options