PlotFluorescenceSpectroscopy
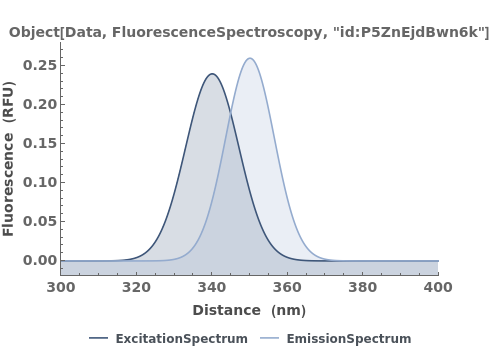
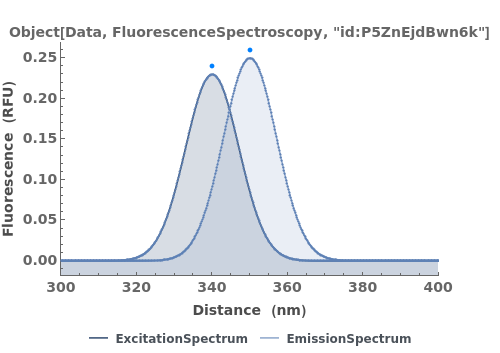
PlotFluorescenceSpectroscopy[fluorescenceSpectroscopyData]⟹plot
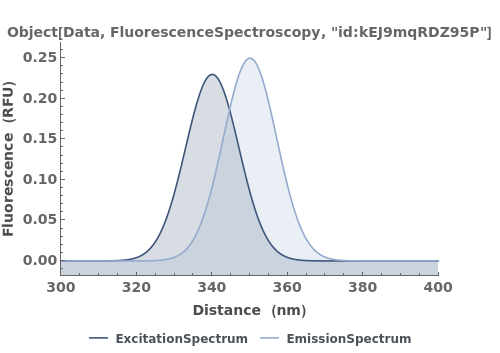
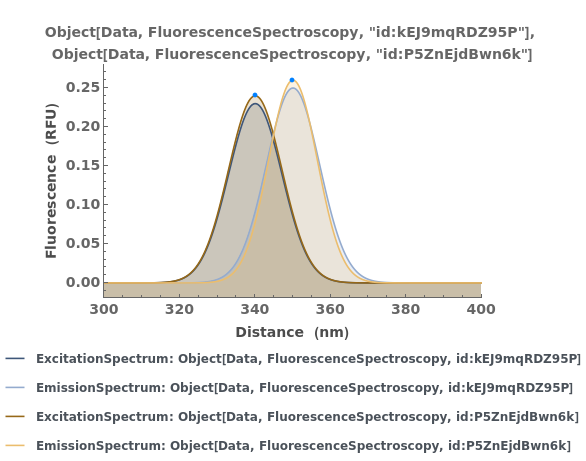
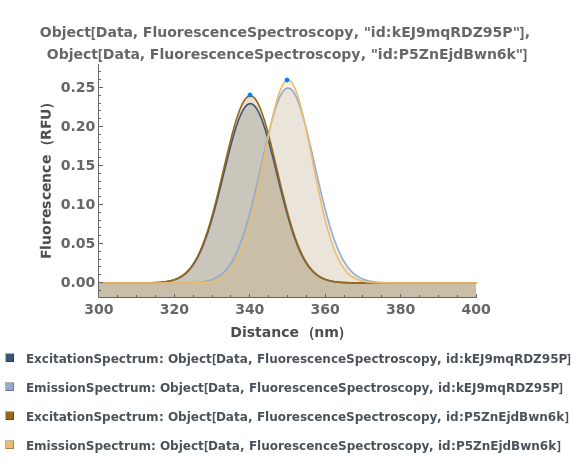
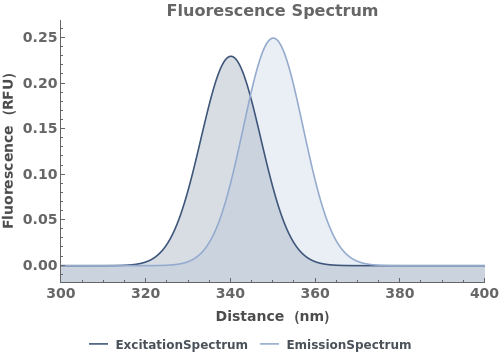
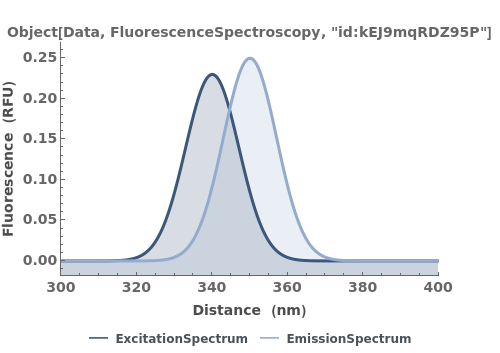
displays fluorescence intensity vs wavelength plot for the supplied fluorescenceSpectroscopyData.
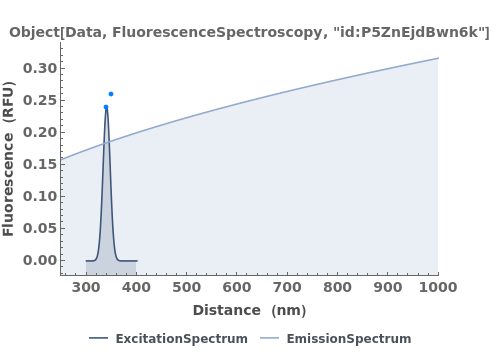
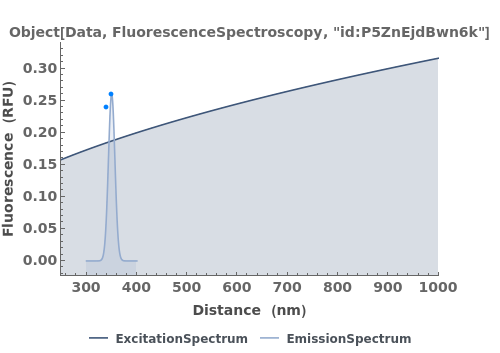
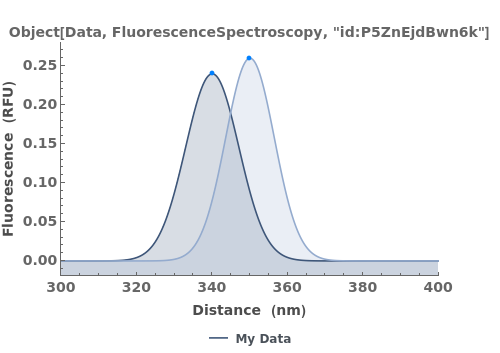
PlotFluorescenceSpectroscopy[spectra]⟹plot
displays fluorescence intensity vs wavelength plot when given a spectra as a raw data trace.
Details
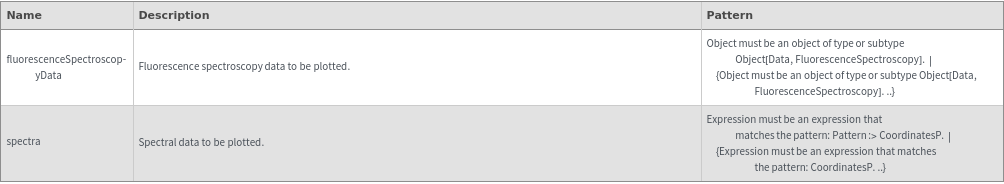
Input
Output

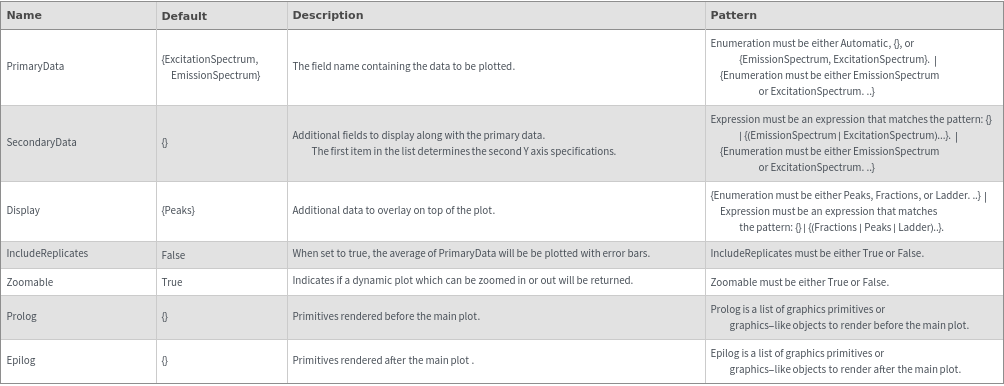
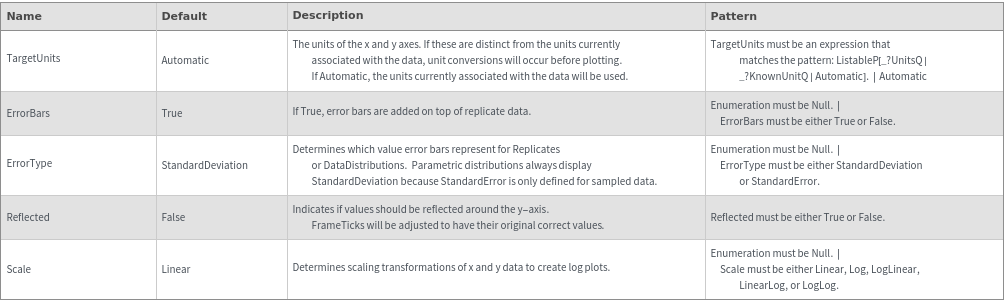
Data Specifications Options
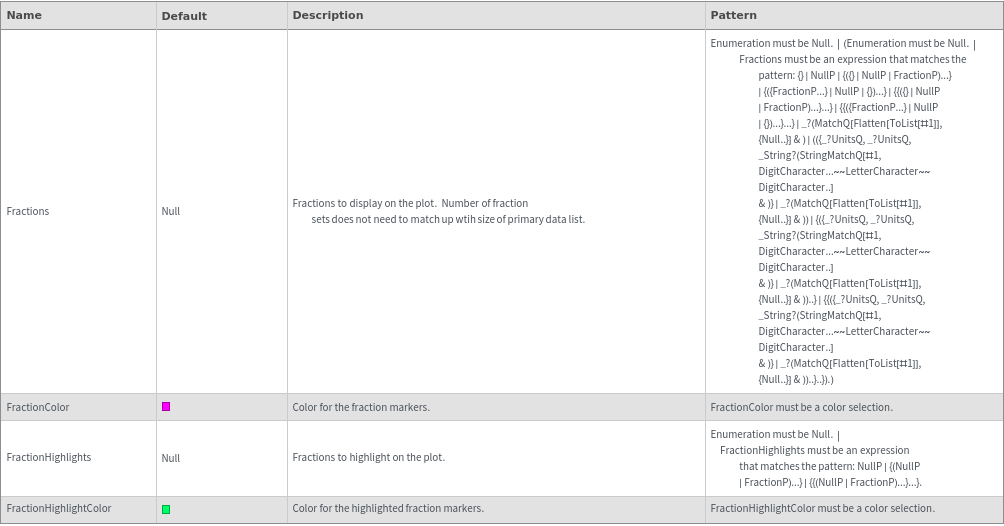
Fractions Options
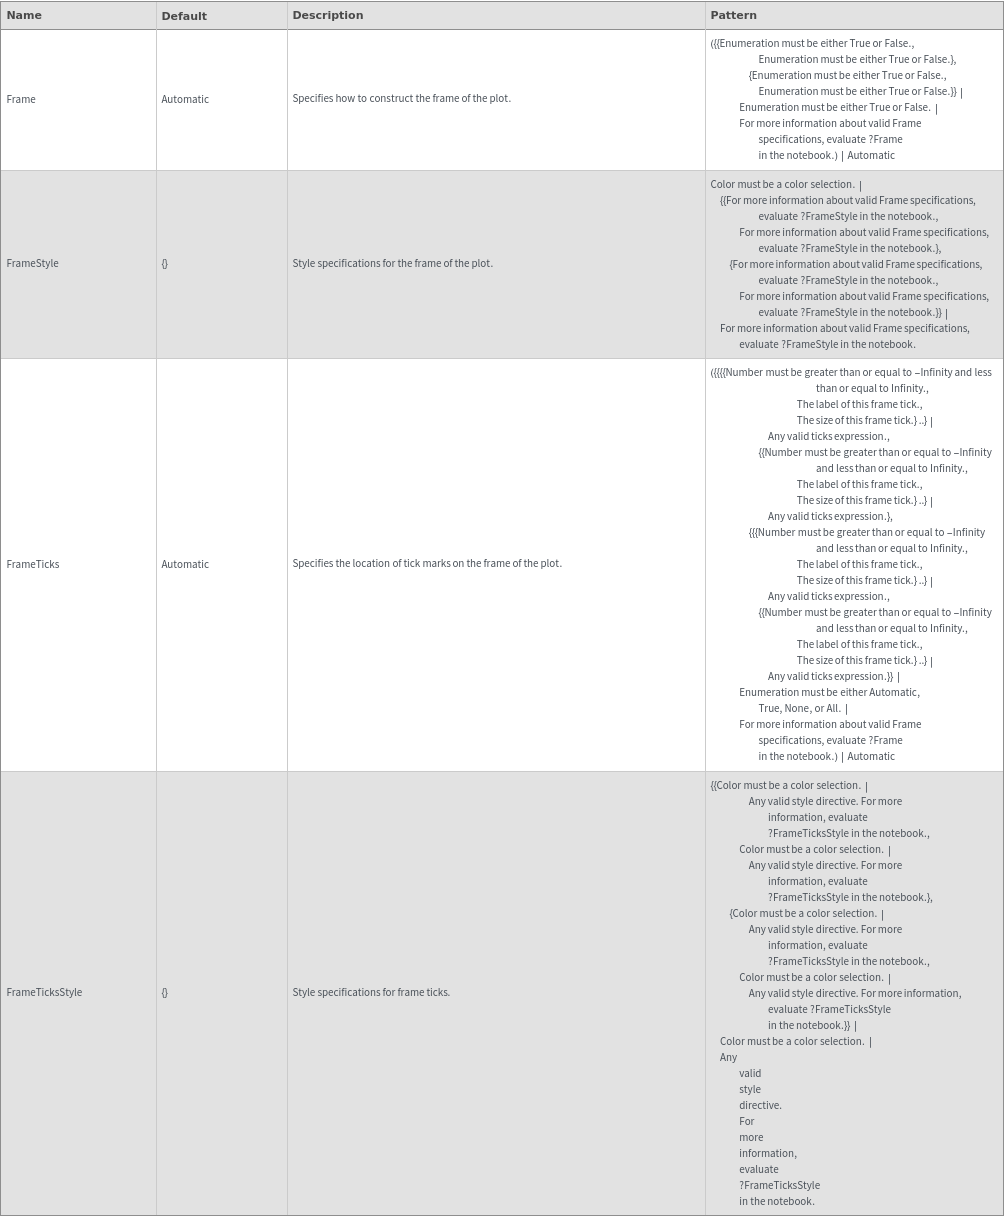
Frame Options
Grid Options
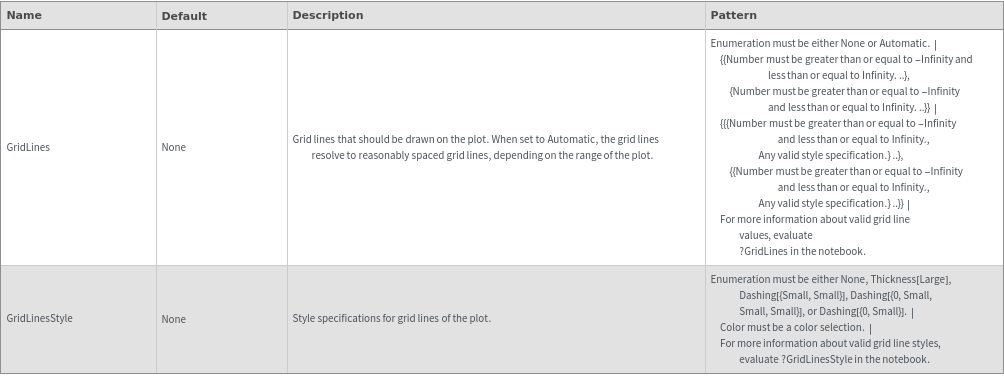
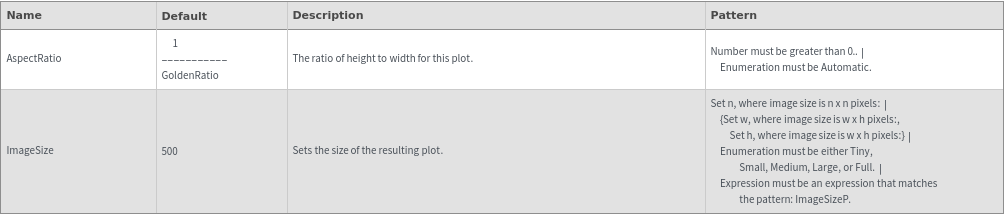
Image Format Options
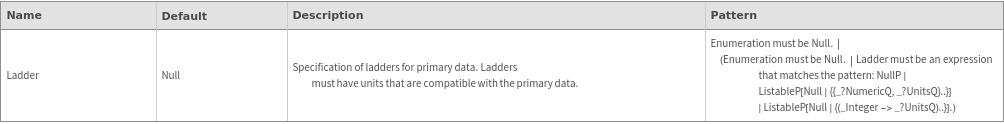
Ladder Options
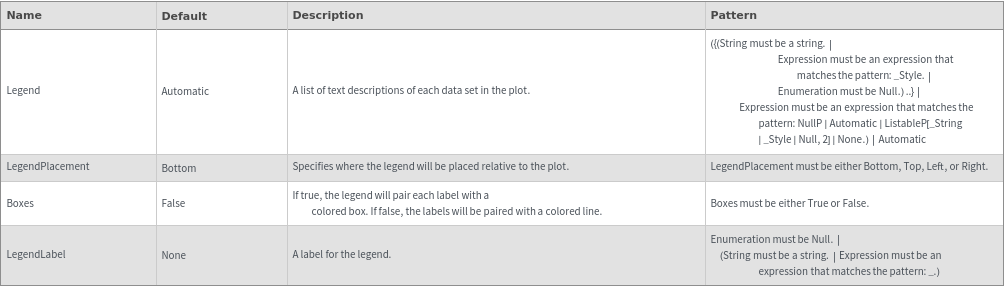
Legend Options
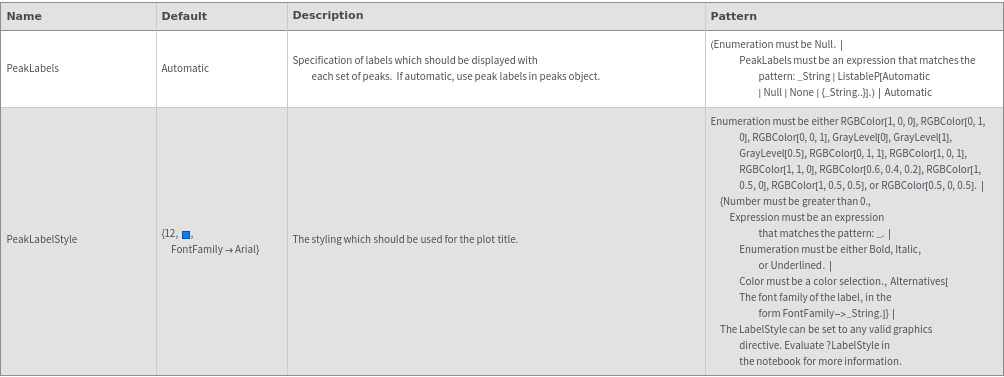
Peaks Options
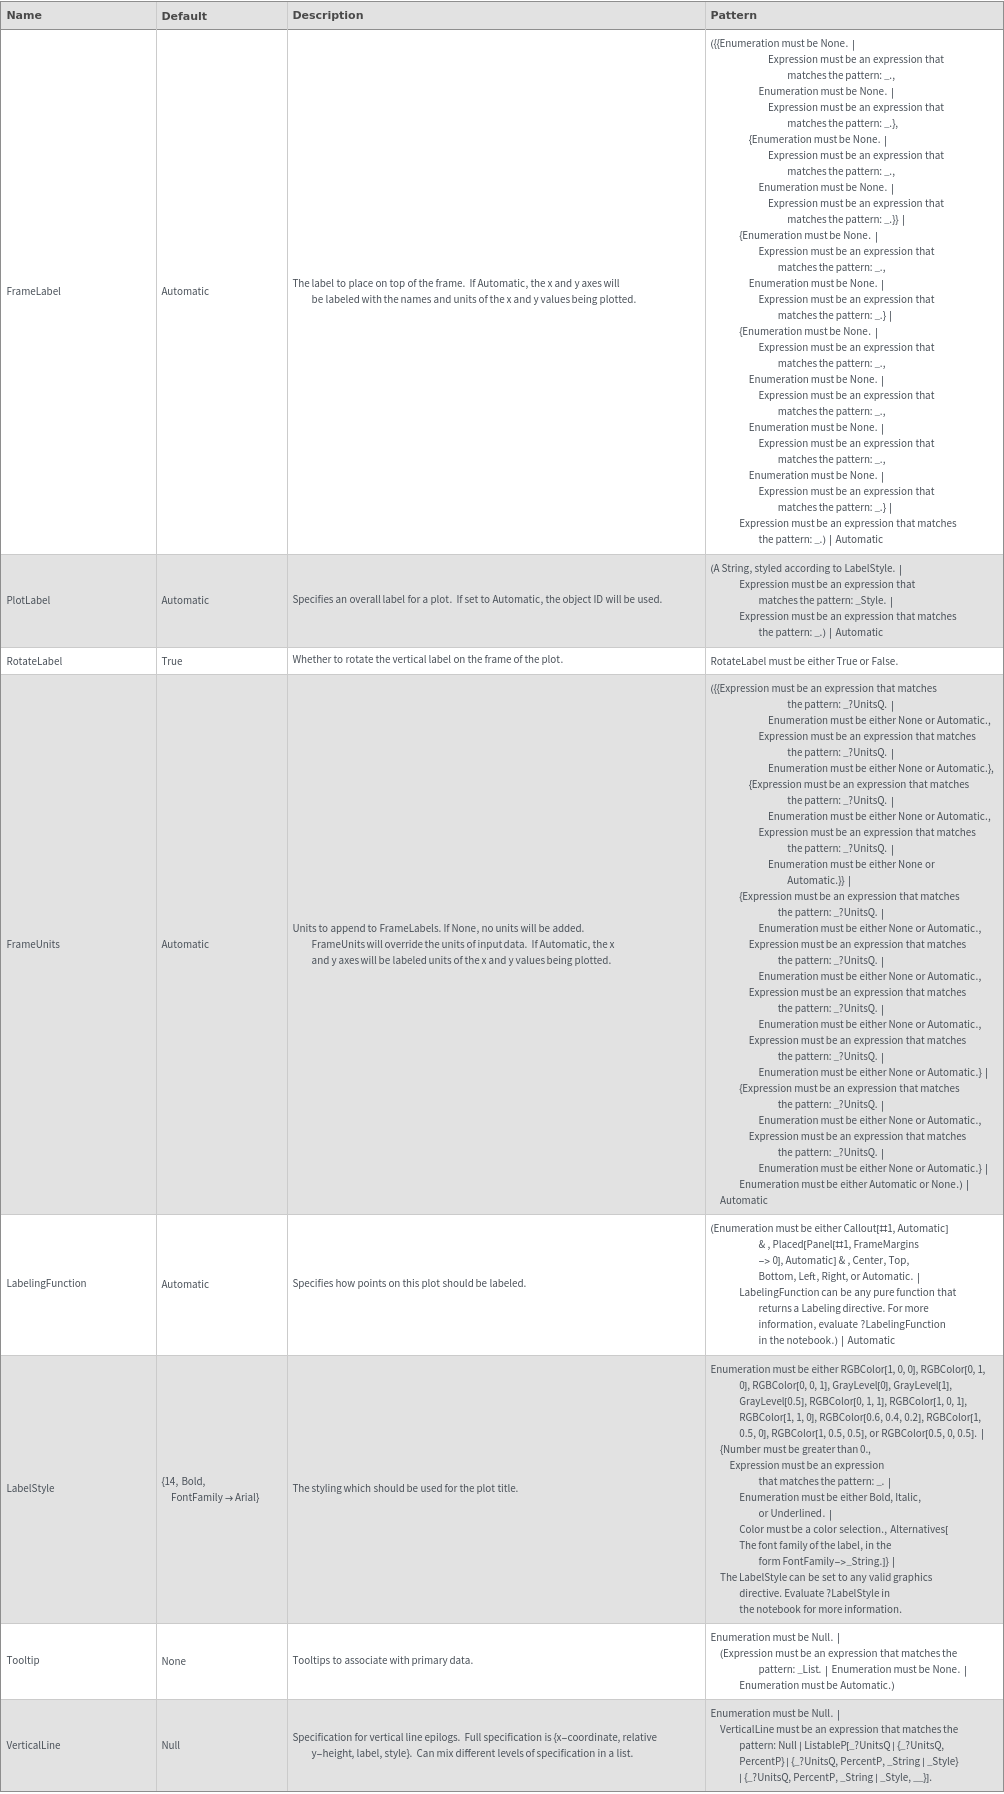
Plot Labeling Options
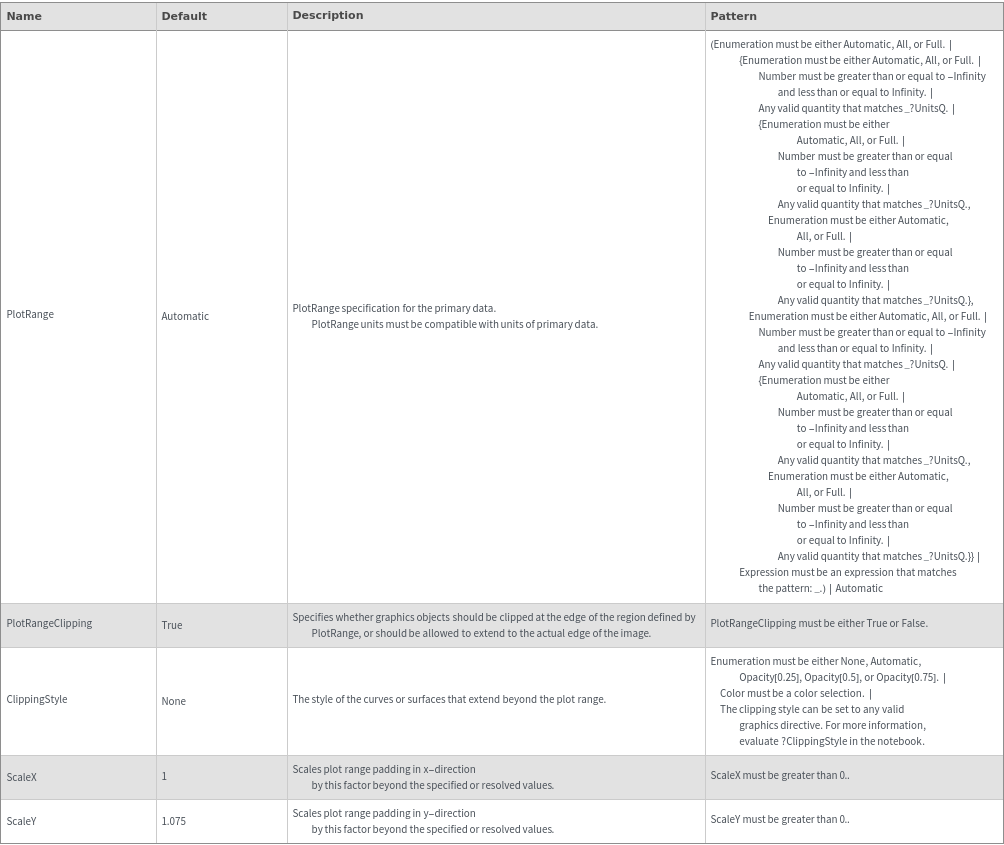
Plot Range Options
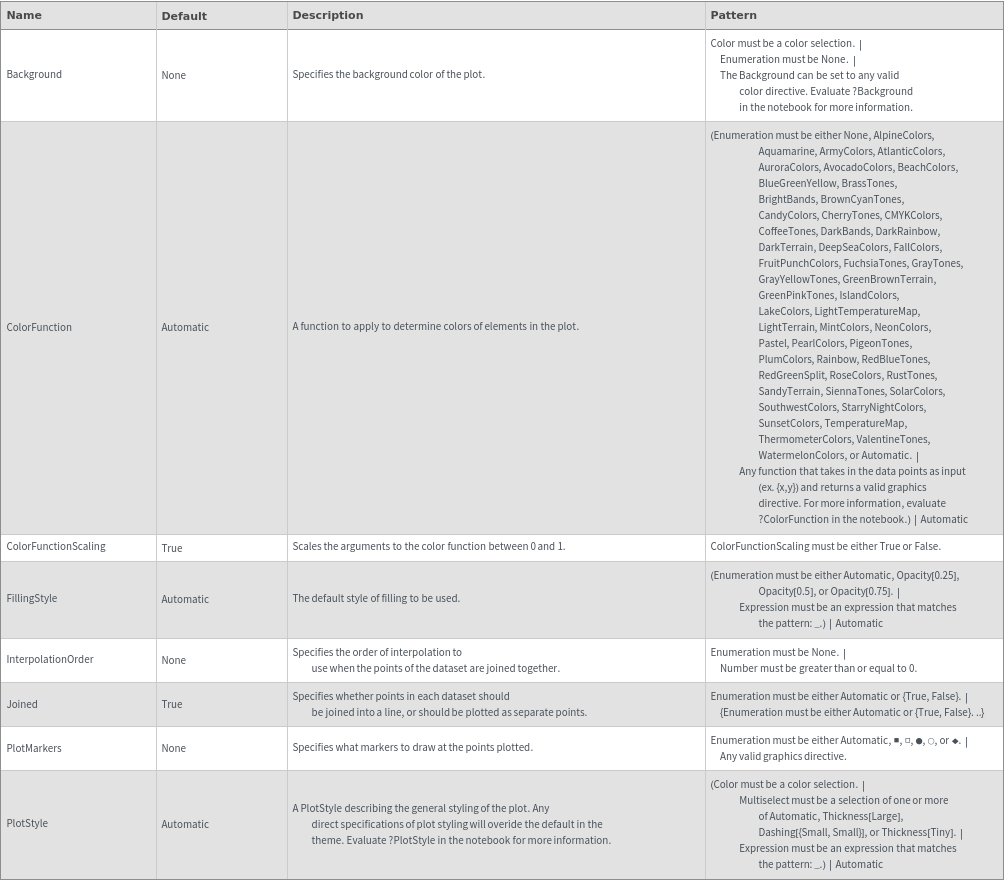
Plot Style Options
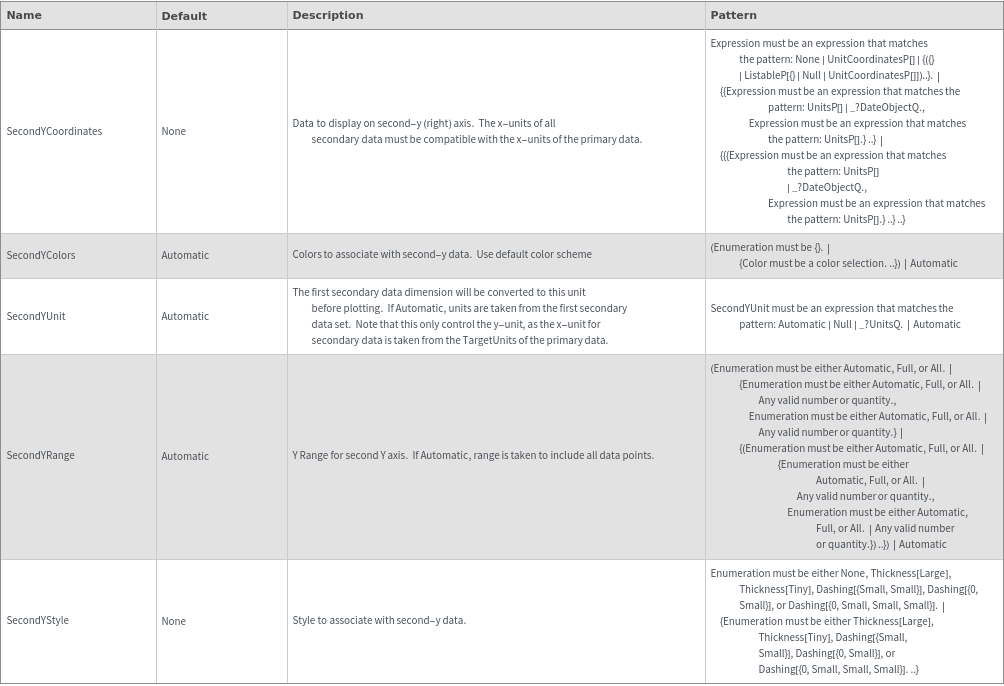
Secondary Data Options
General Options