PlotGating
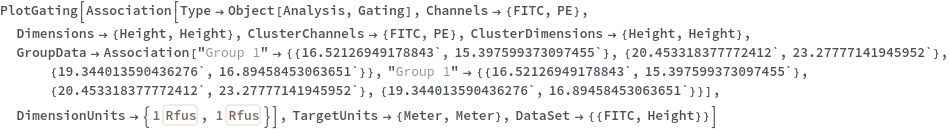
PlotGating[gateObject]⟹plot
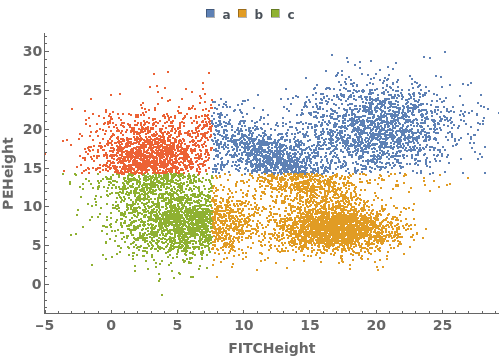
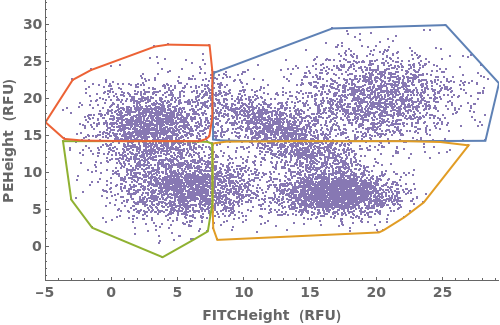
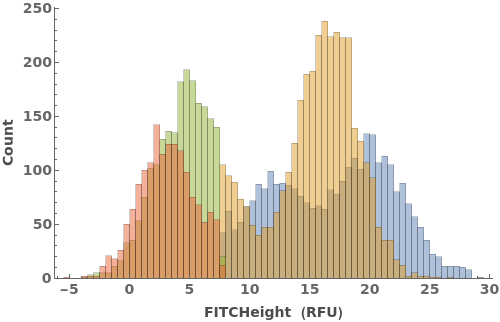
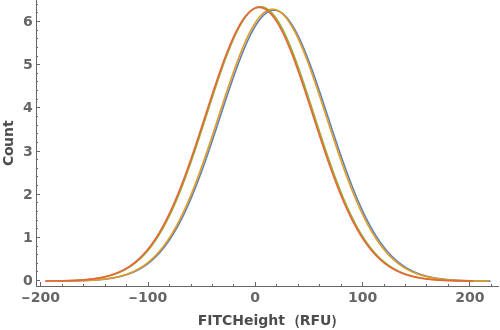
generates a plot from the clustered data in the provided gateObject.
Details
-
badTargetUnits The length of TargetUnits does not match the length of DataSet. noSuchDataSet The DataSet `1` does not exist in `2`.
Input

Output

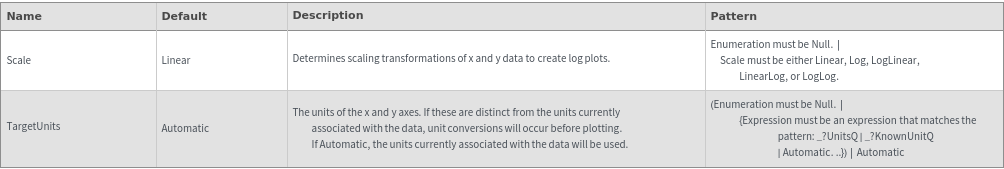
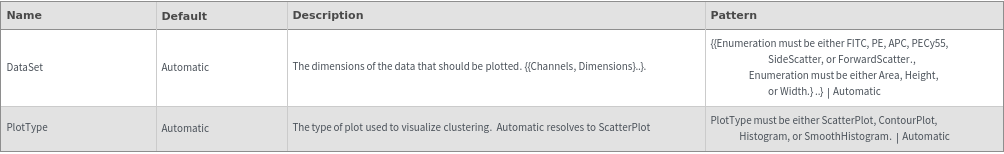
Data Specifications Options
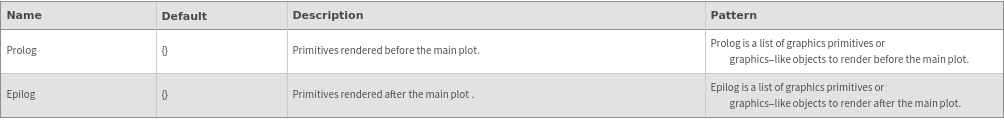
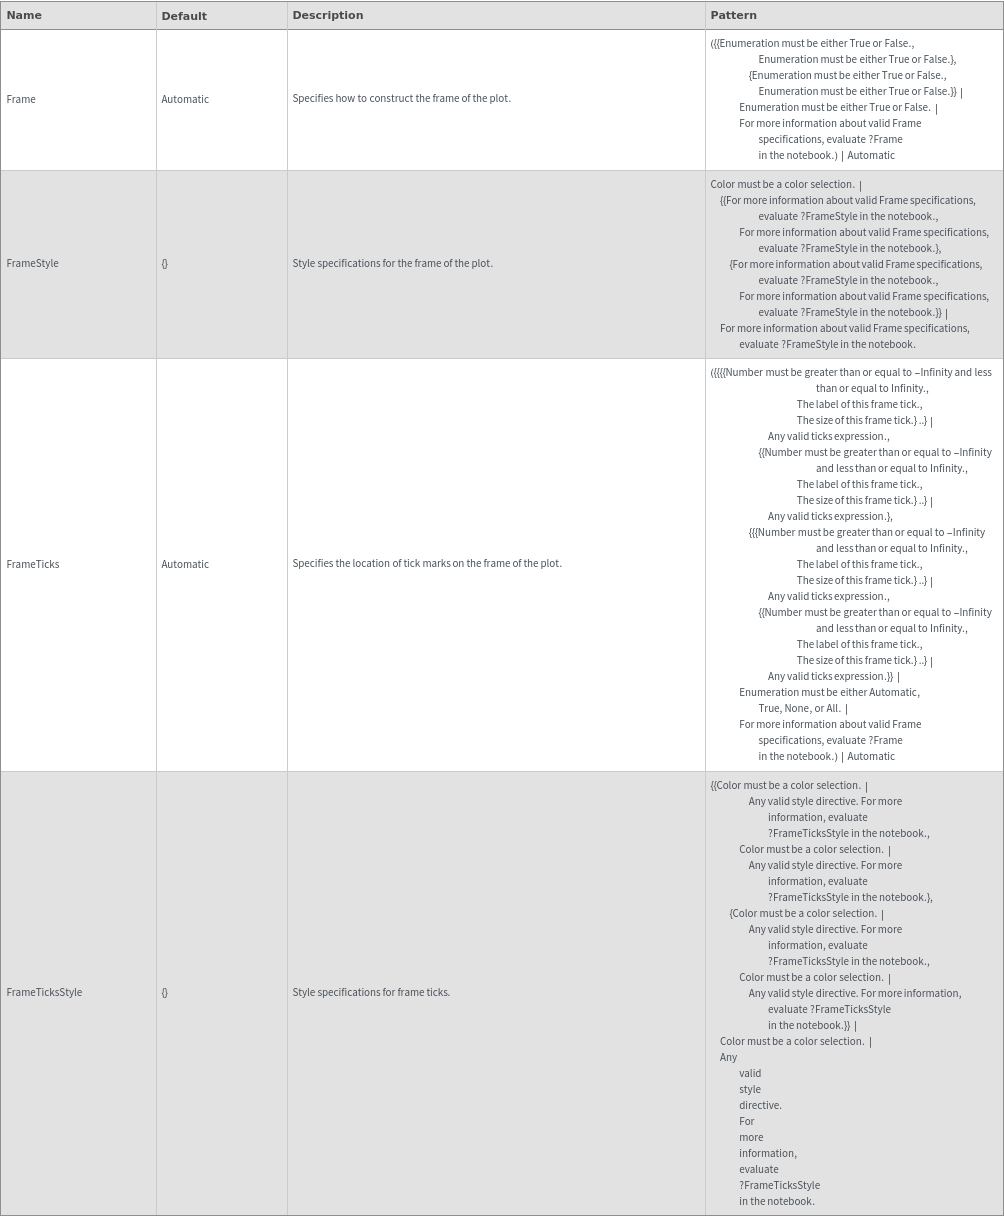
Frame Options
Gating Options
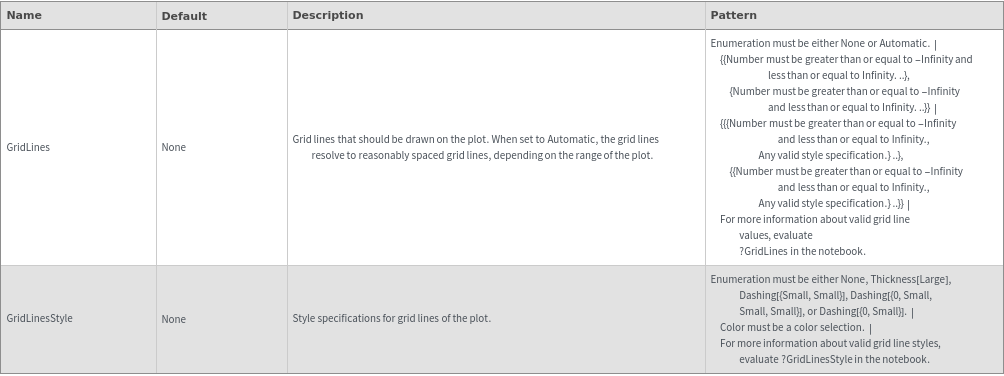
Grid Options
Histogram Options
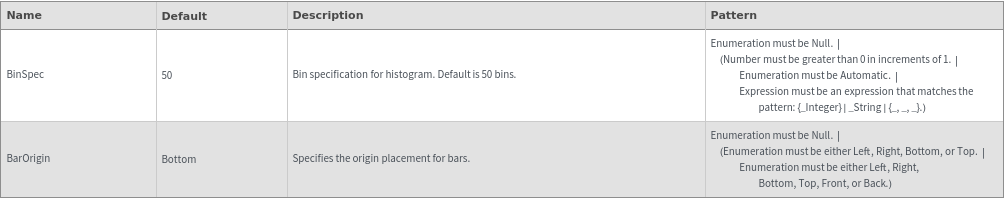
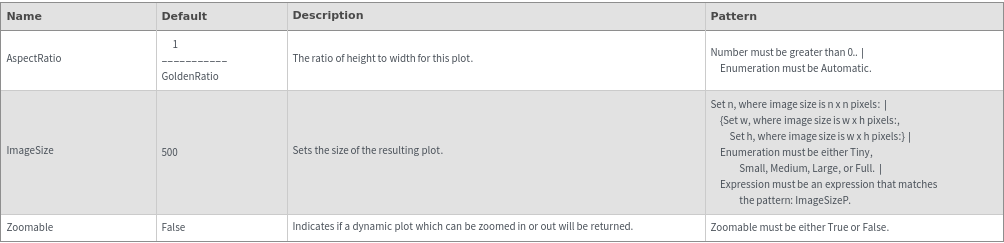
Image Format Options
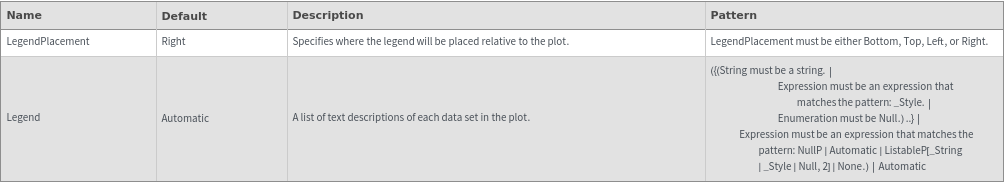
Legend Options
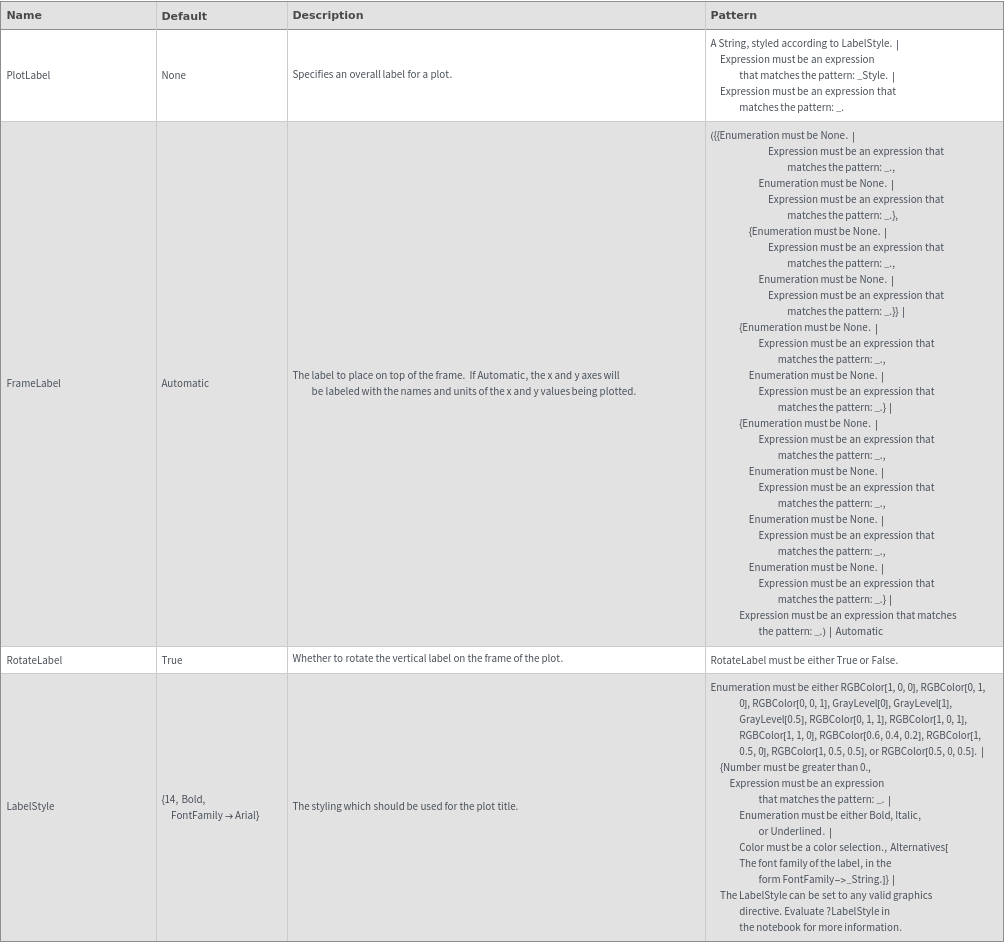
Plot Labeling Options
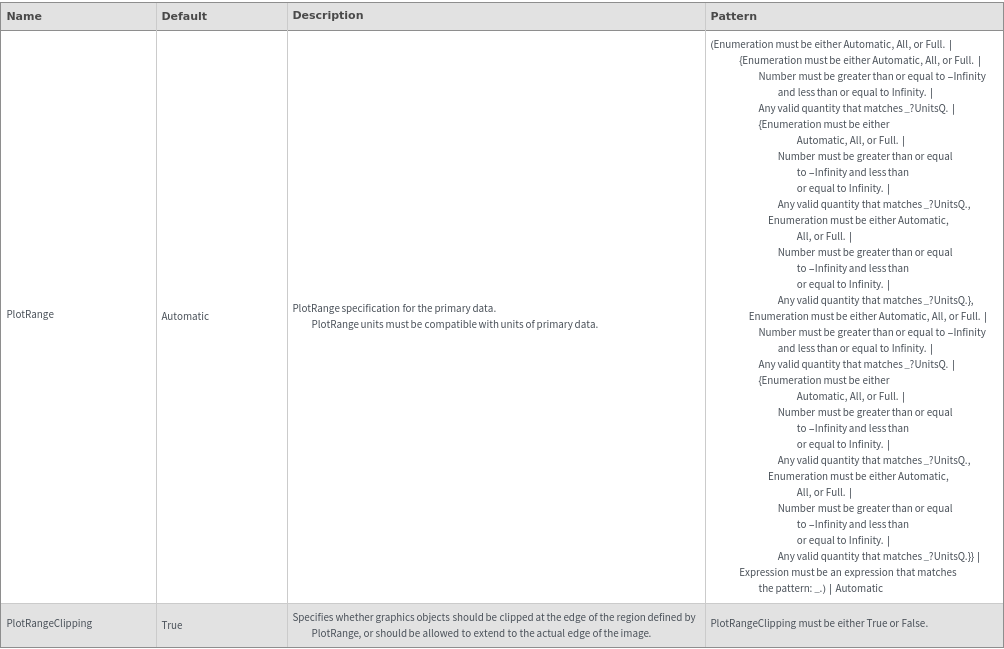
Plot Range Options
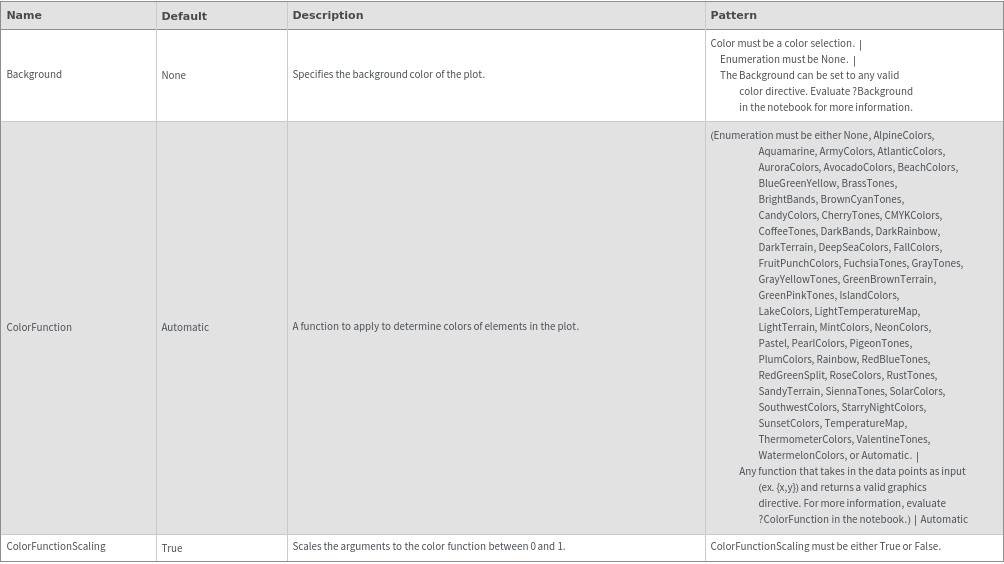
Plot Style Options
General Options