PlotKineticRates
PlotKineticRates[kineticsObject]⟹plot
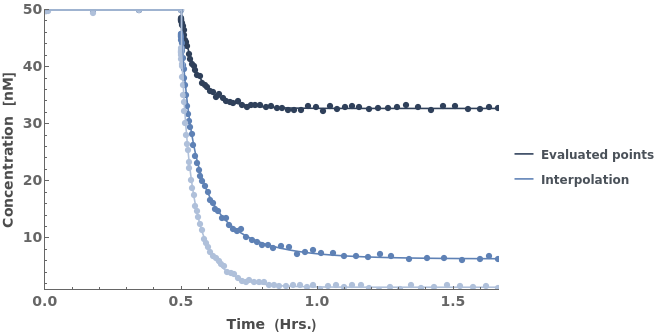
plots the rate fitting analysis found in the kinetics analysis kineticsObject.
Details
Input

Output

Data Specifications Options
Fractions Options
Frame Options
Grid Options
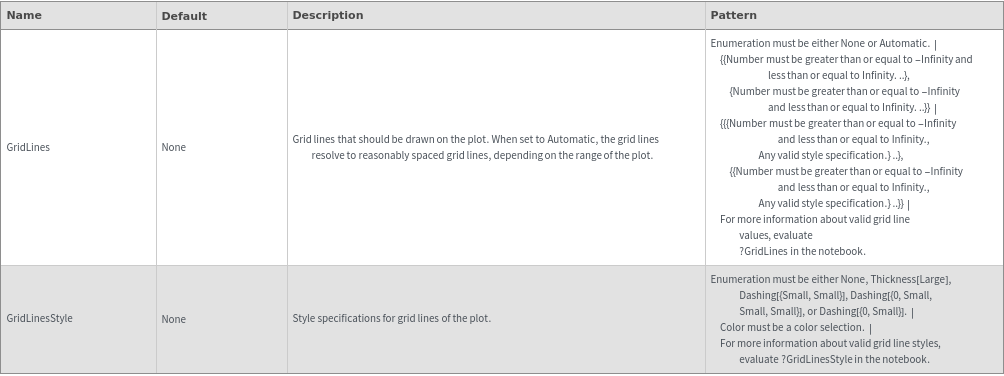
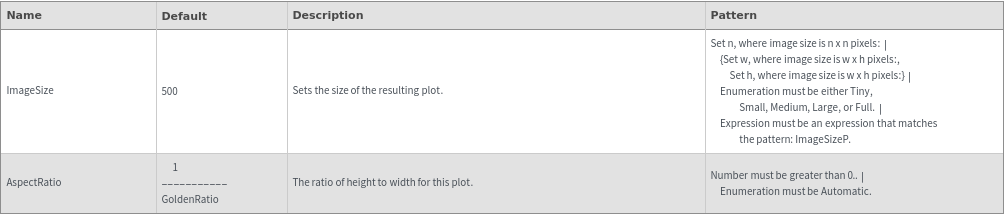
Image Format Options
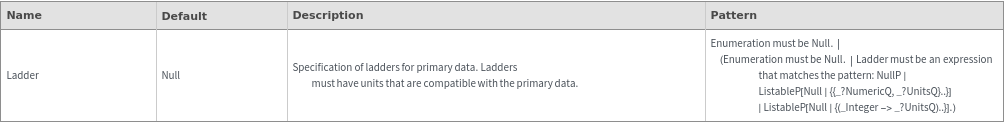
Ladder Options
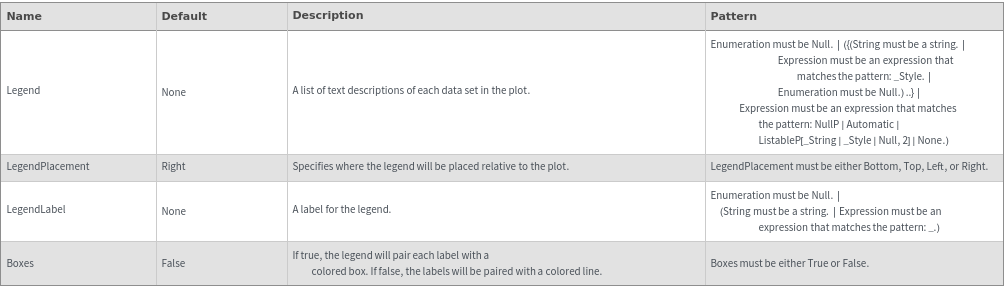
Legend Options
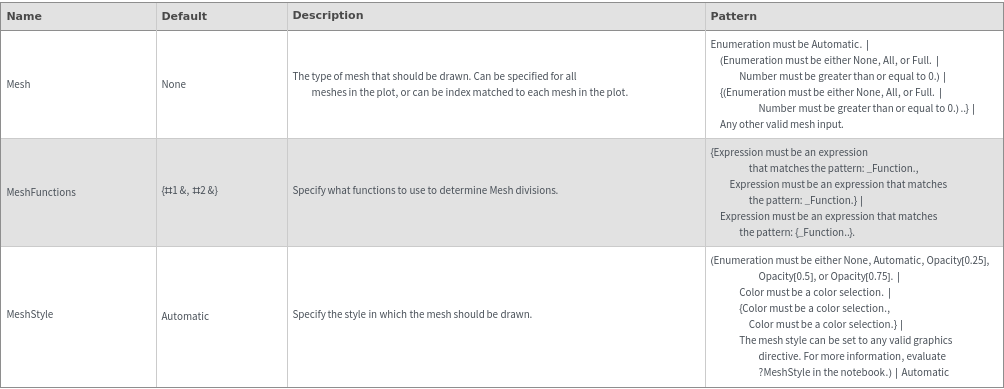
Mesh Options
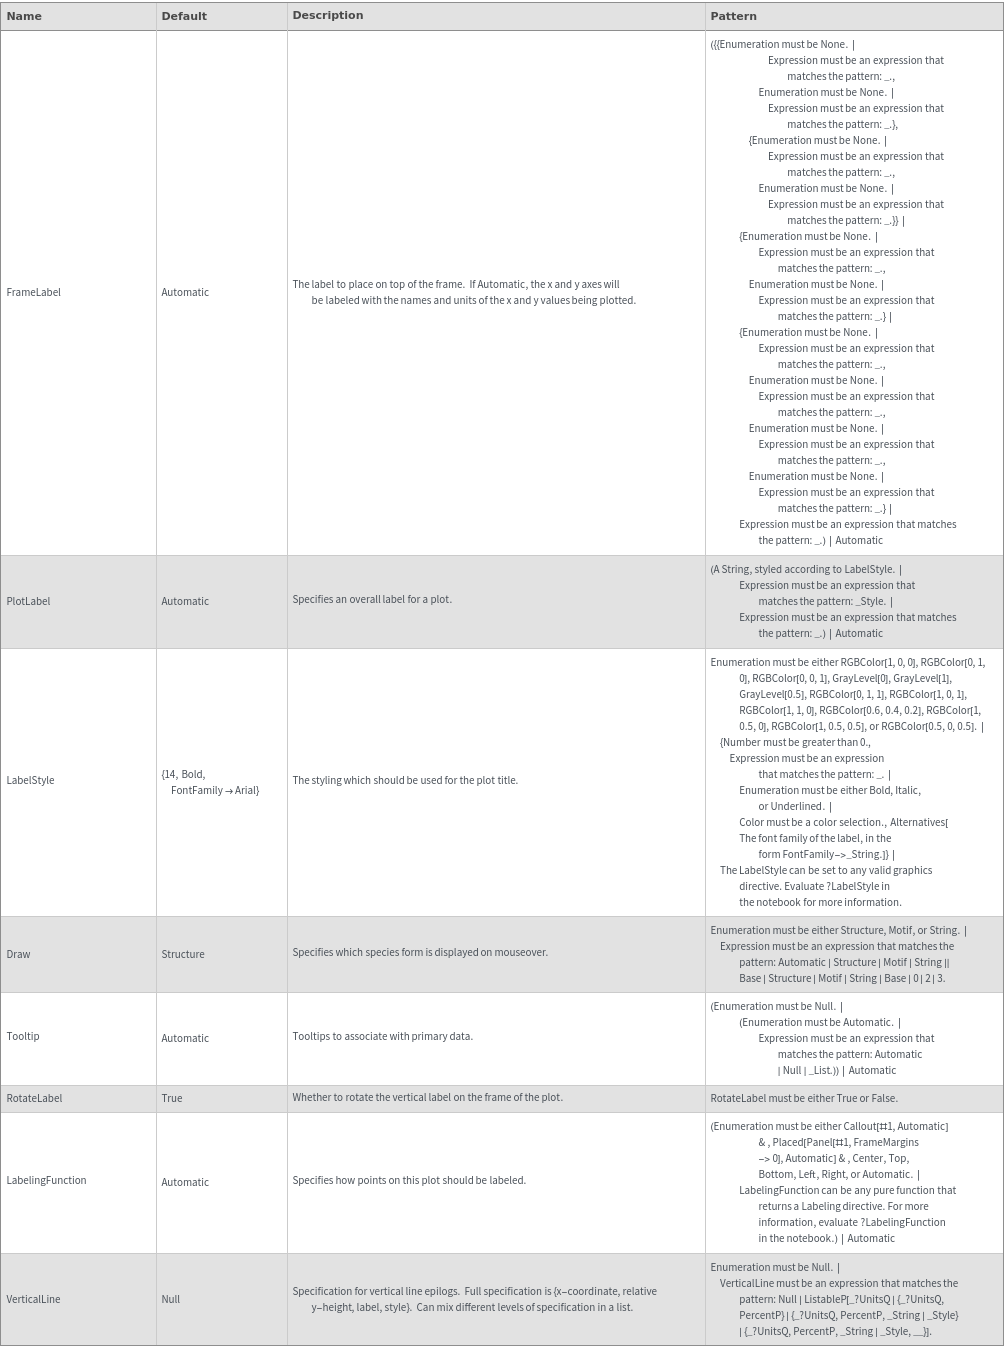
Plot Labeling Options
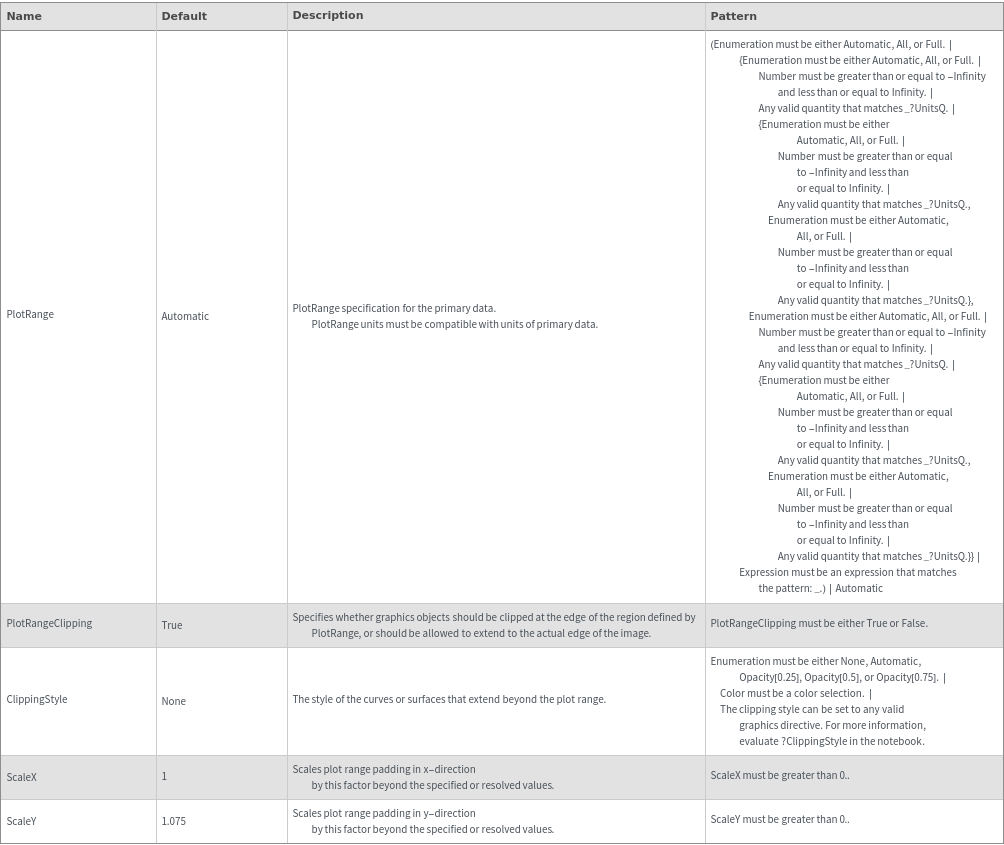
Plot Range Options
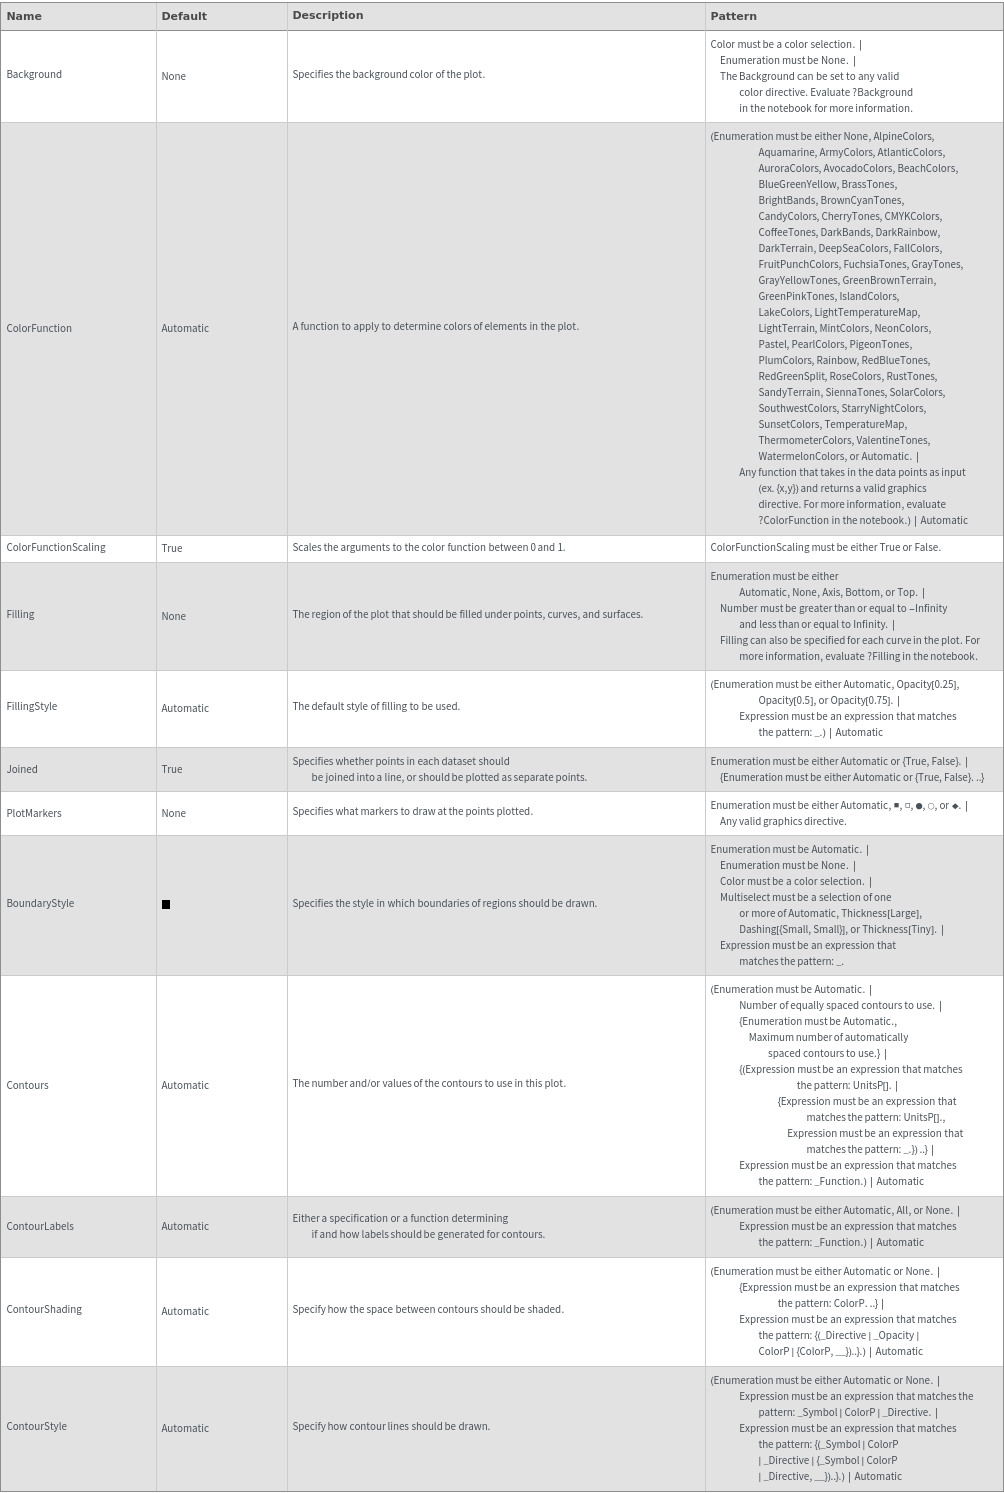
Plot Style Options
Secondary Data Options
General Options
Examples

Options (13)
FeatureDisplay (2)


PlotStyle (2)


Rates (7)
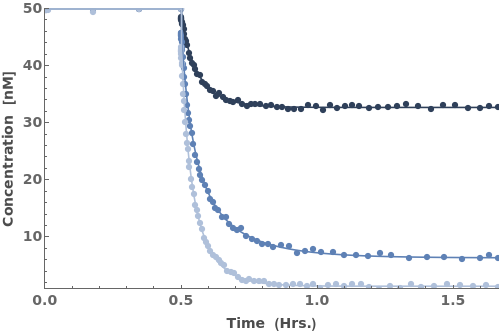
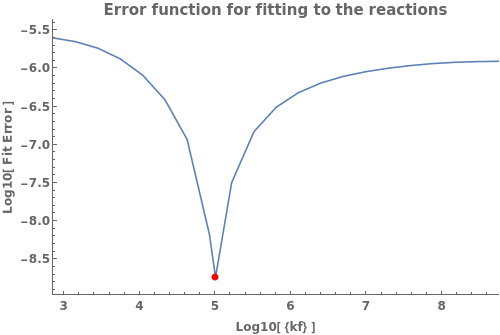
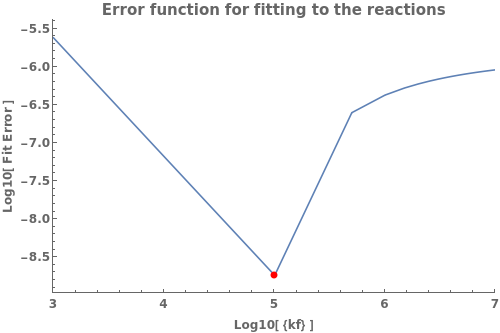
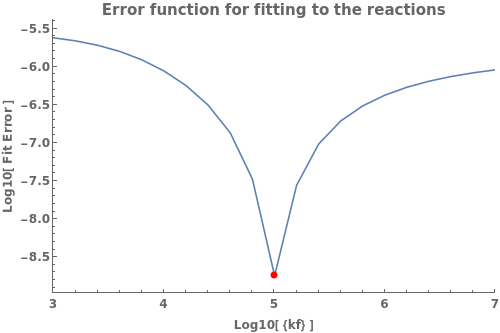
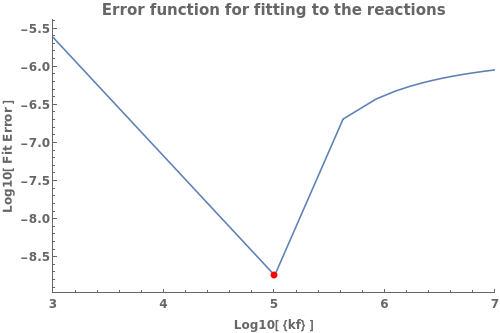
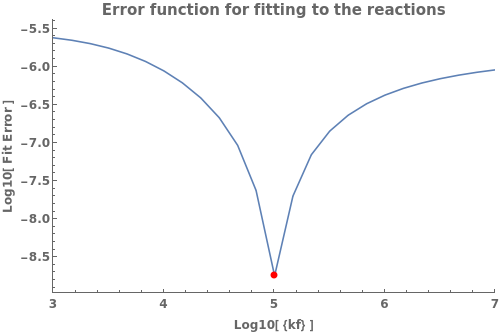
Create goodness of fit plot for one rate. All other rates are held constant at their optimum values:

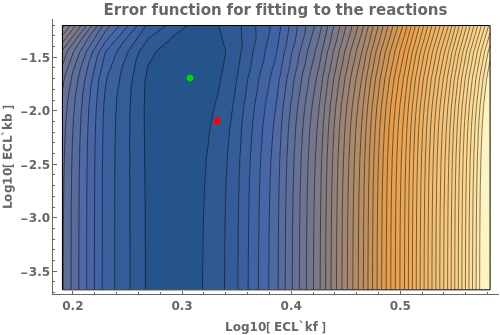
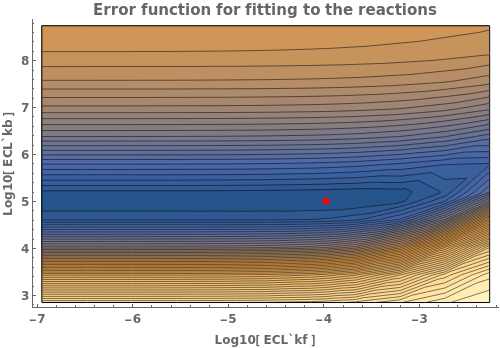
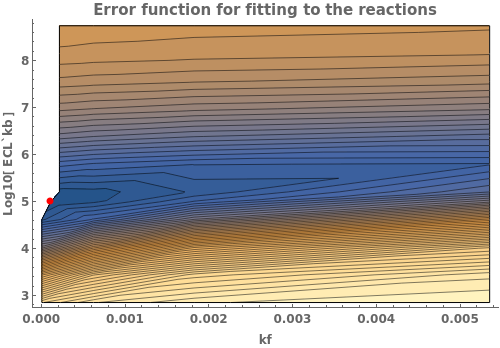
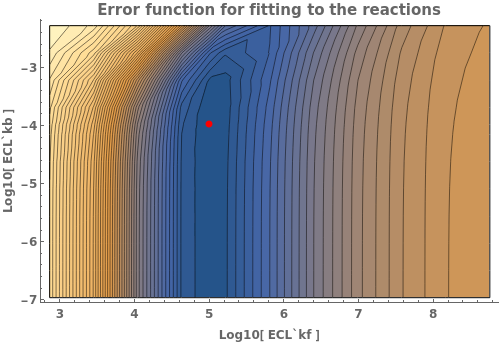
Create contour plot goodness of fit plot for two rates:

Specify the range from which to sample the varying rate will be uniformly sampled:

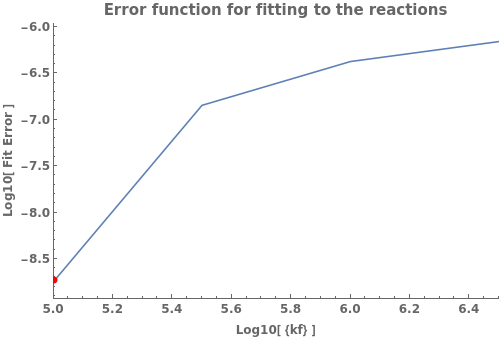
Specify the range from which to sample the varying rate will be log-sampled:

Sample kf at 25 points linearly spaced between 10^3 and 10^7:

Sample kf at 25 points logarithmically spaced between 10^3 and 10^7:

Specify the exact values at which to sample the varying rate: