PlotLadder
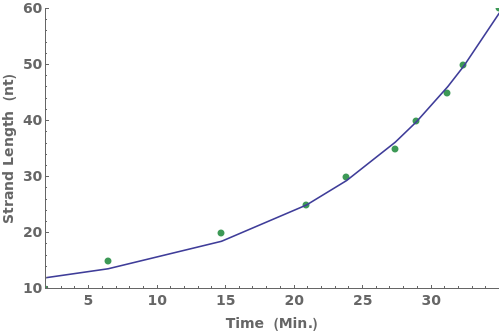
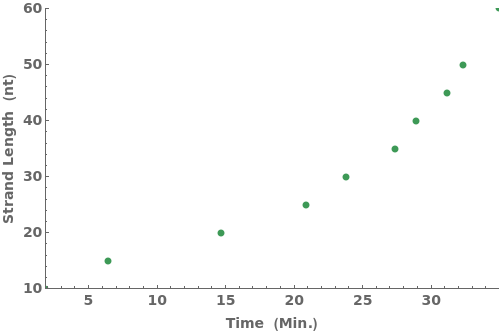
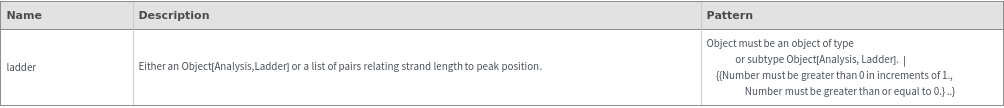
PlotLadder[ladder]⟹plot
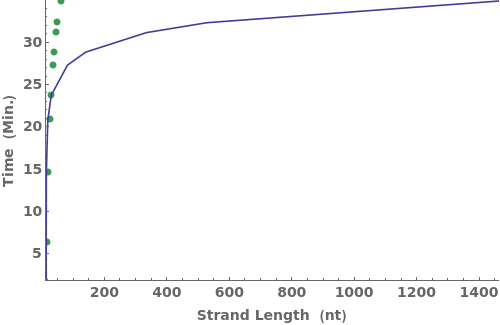
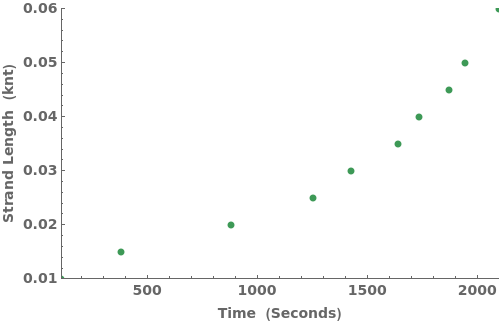
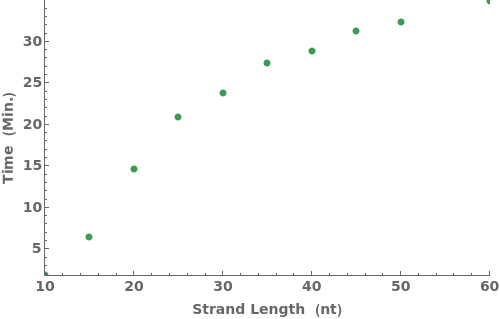
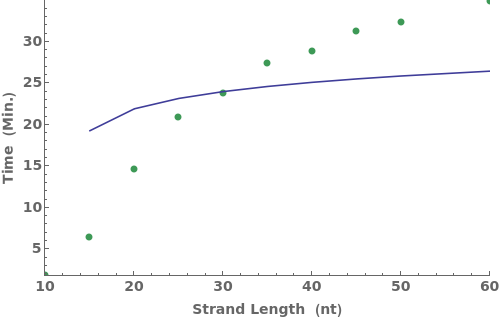
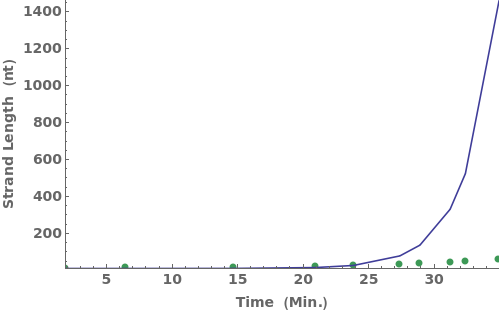
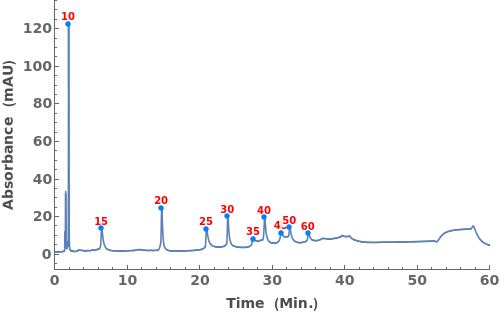
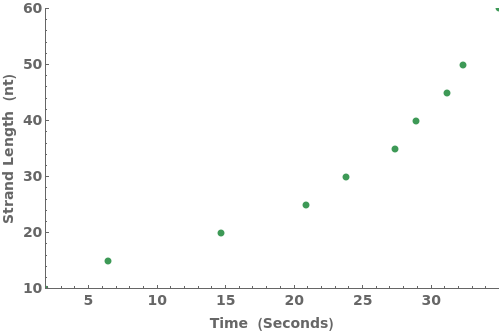
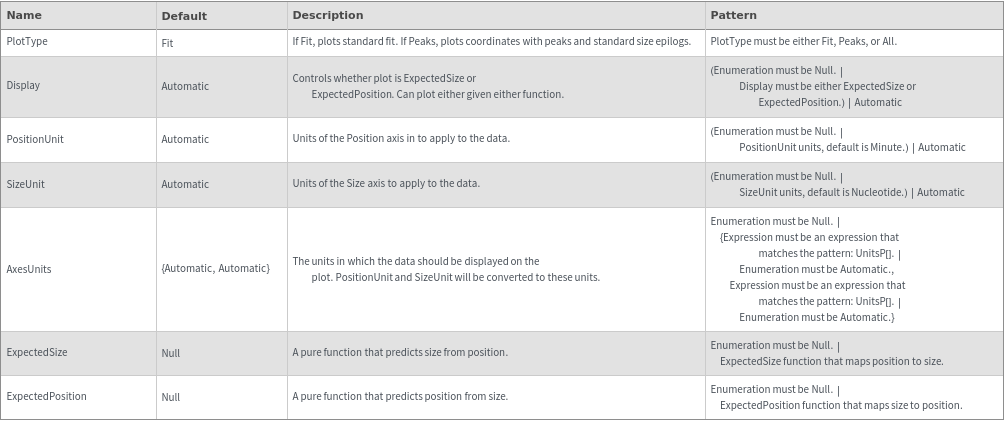
plots the standard peak points in ladder alongside a standard curve fit to either molecular weight (ExpectedSize) or position (ExpectedPosition).
Details
- Given ExpectedSize, can display either ExpectedSize or ExpectedPosition
- Given ExpectedPosition, can display either ExpectedSize or ExpectedPosition
- If Display->Automatic and one function is specified, that function will be displayed
- If Display->Automatic and both functions are specified, ExpectedSize will be displayed
- If Axes are set to Automatic, the axes labels will be taken from data units
Input
Output

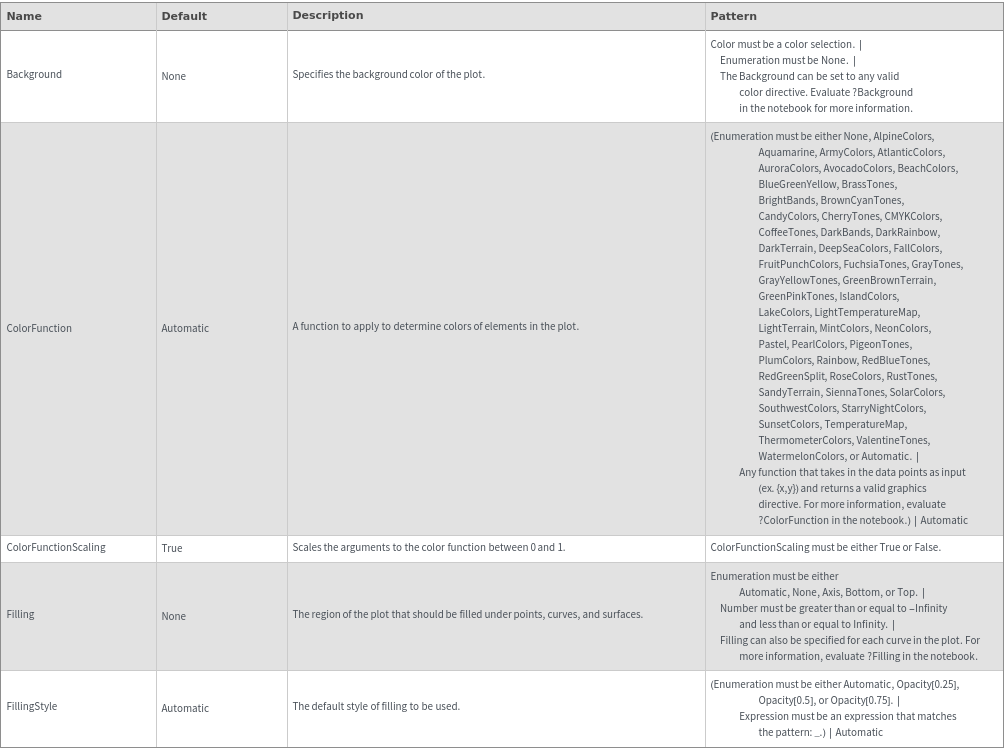
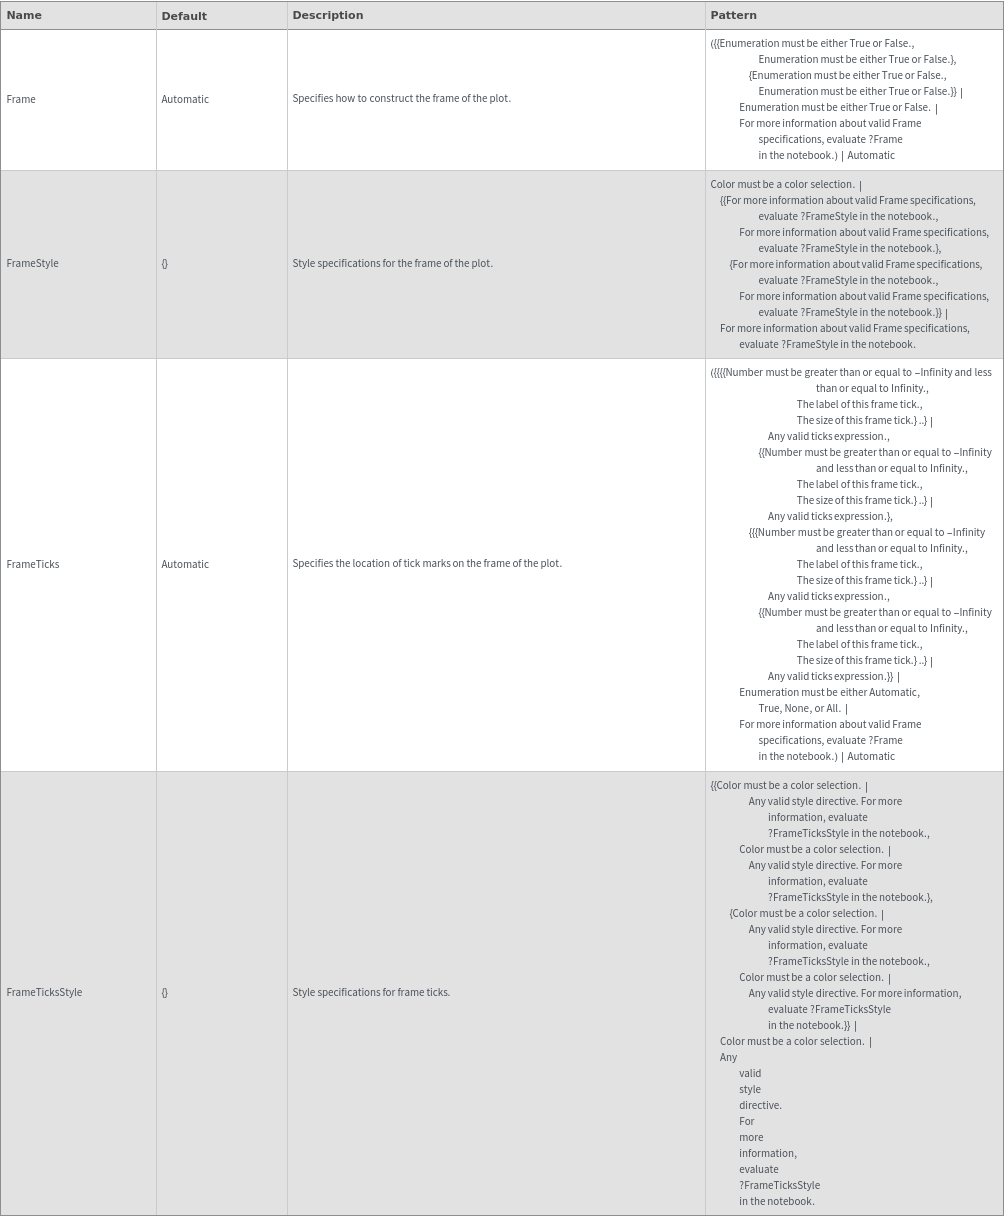
Frame Options
Grid Options
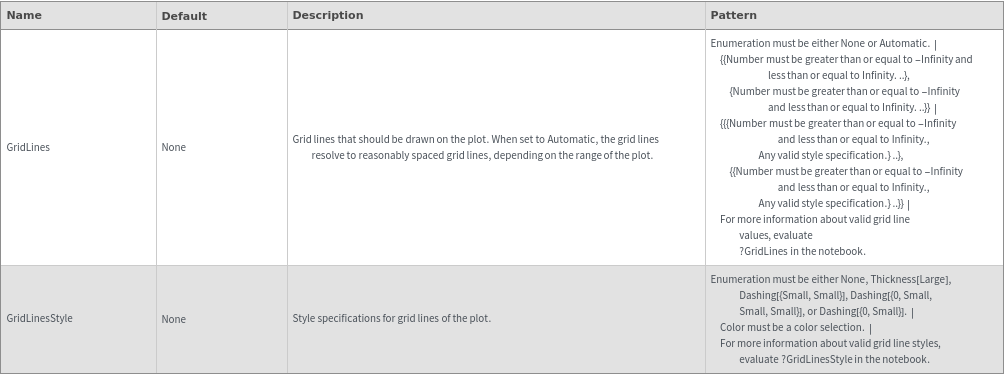
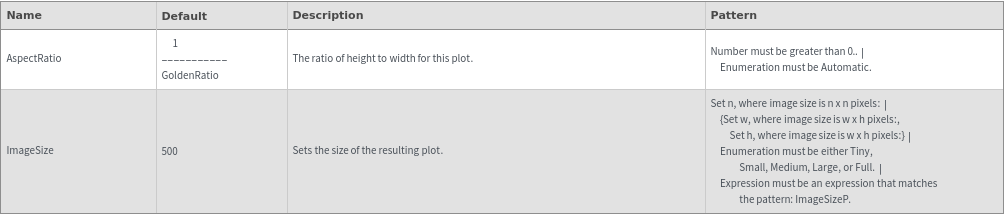
Image Format Options
Ladder Options
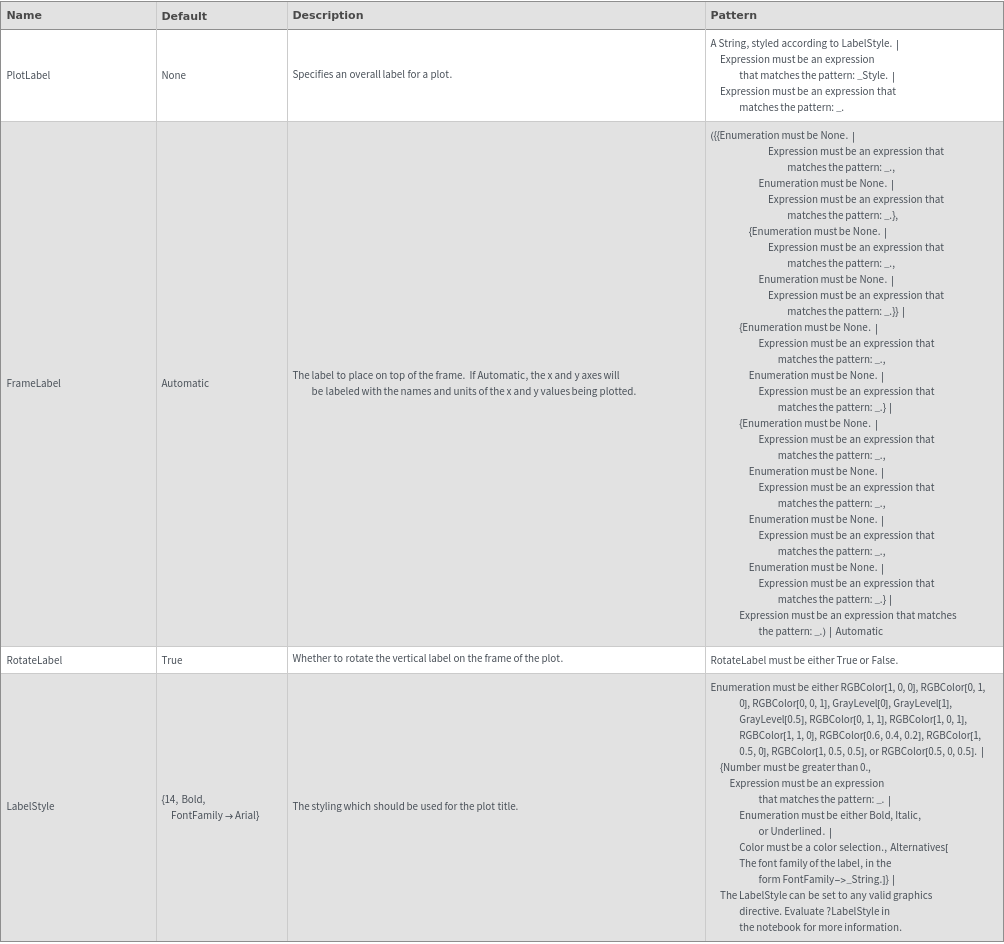
Plot Labeling Options
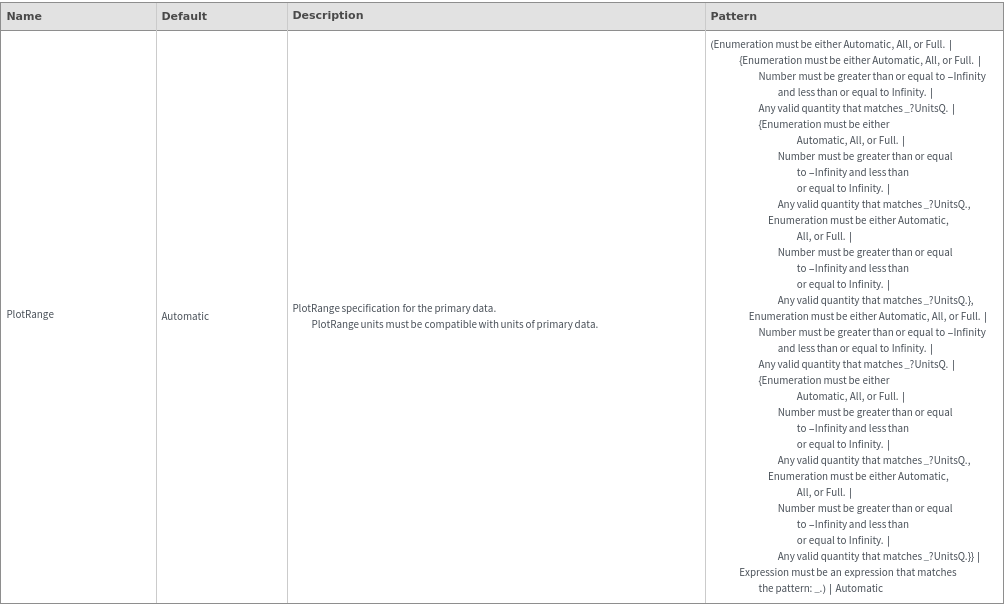
Plot Range Options
Plot Style Options