PlotMicroscopeOverlay
PlotMicroscopeOverlay[overlay]⟹plot
plots a microscope image within a zoomable frame.
Details
- Measurement lines can be added using Ctrl+LeftClick (Cmd+LeftClick on Mac).
- Measurement points can be moved by Ctrl+LeftClick+Dragging (Cmd+LeftClick+Dragging on Mac).
- Measurement lines can be removed using Ctrl+RightClick (Cmd+RightClick on Mac).
-
NoOverlay No overlay analysis exists for `1`
Input

Output

Frame Options
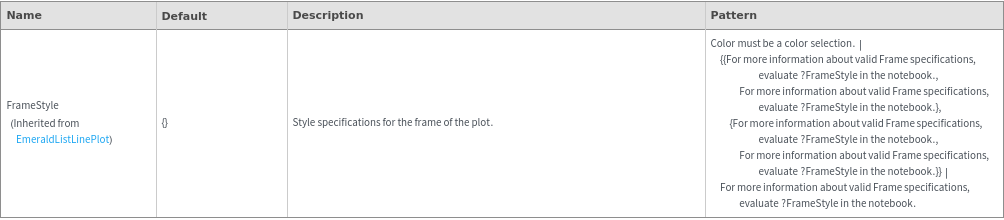
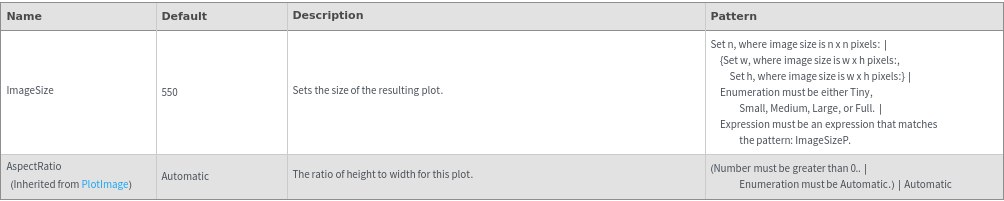
Image Format Options
Plot Labeling Options
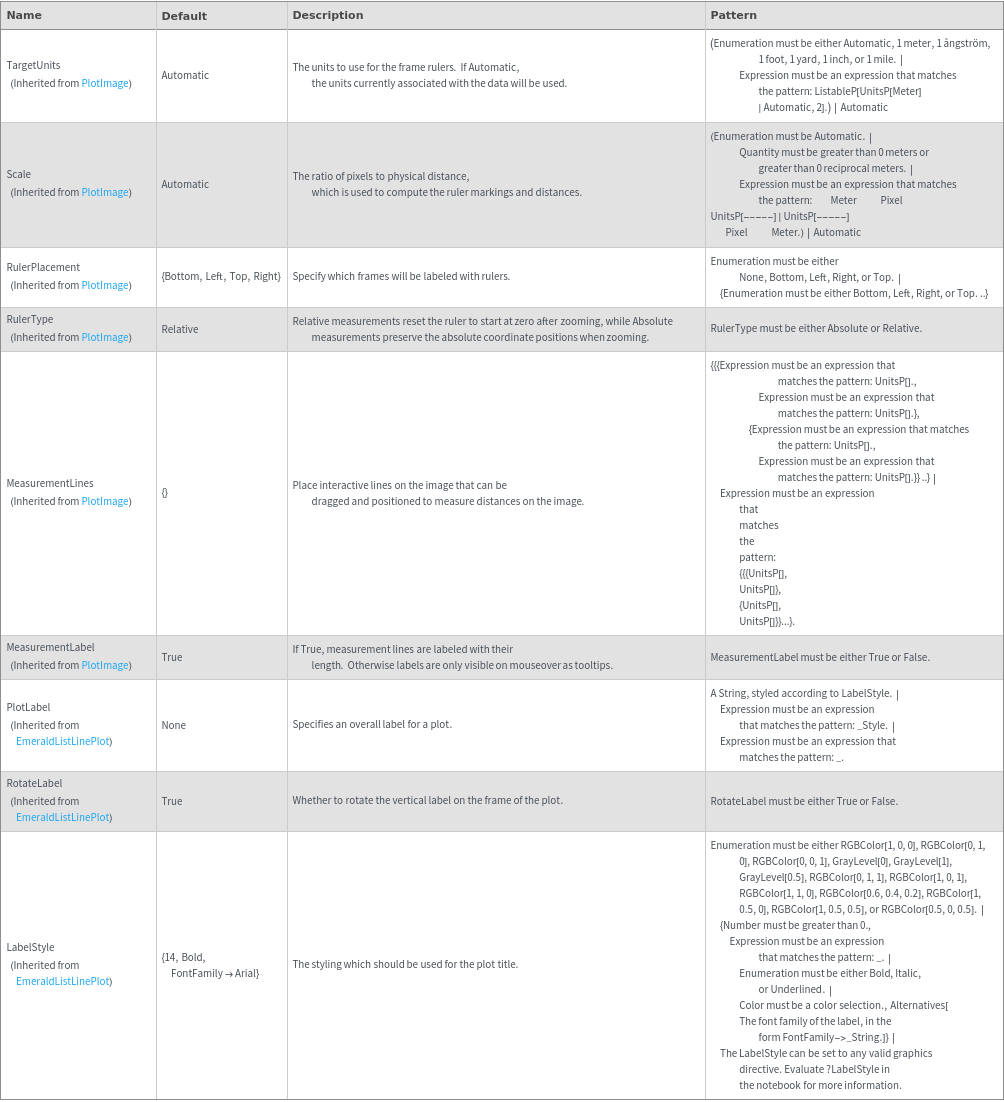
Plot Style Options
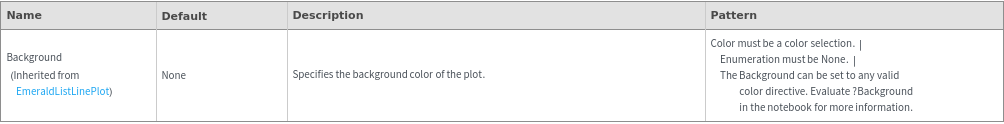
General Options