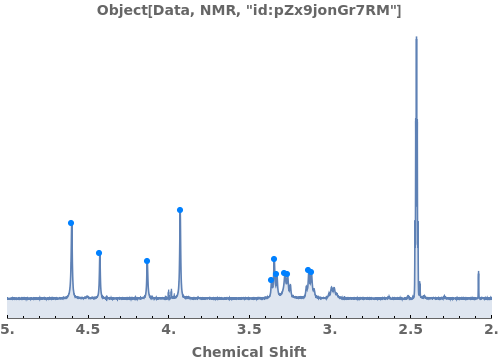
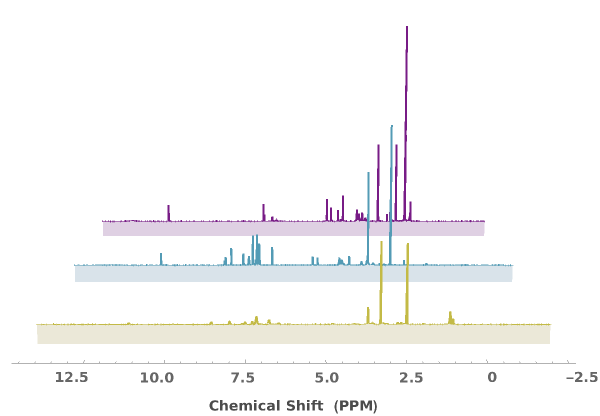
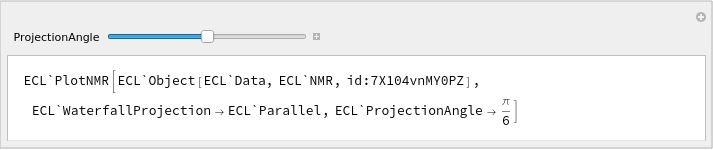
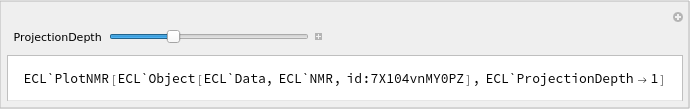
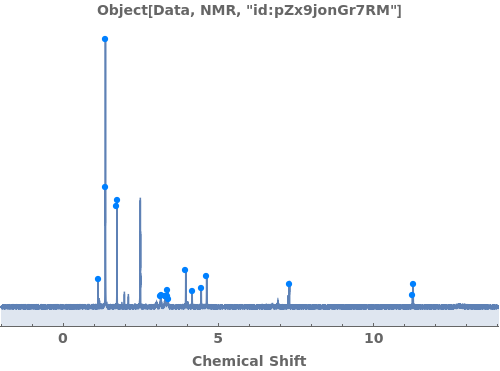
PlotNMR
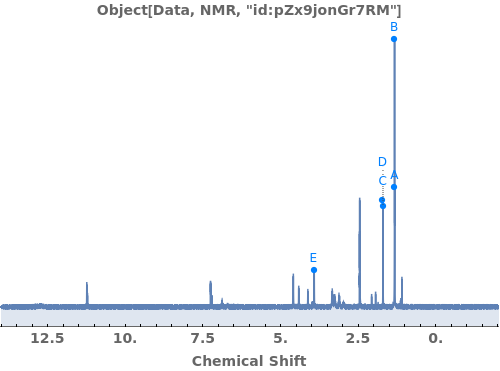
PlotNMR[NMRdata]⟹plot
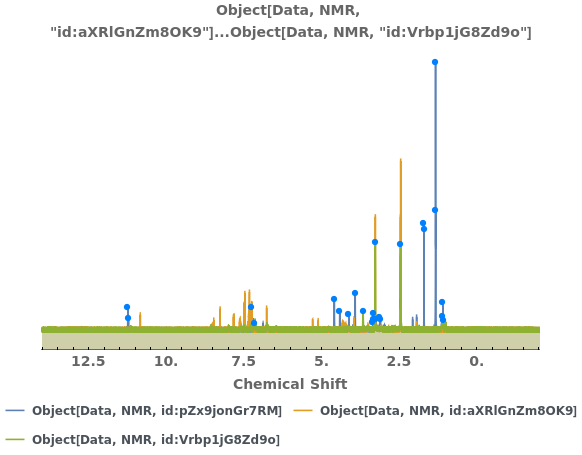
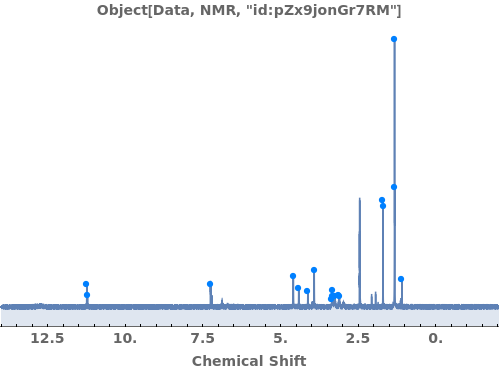
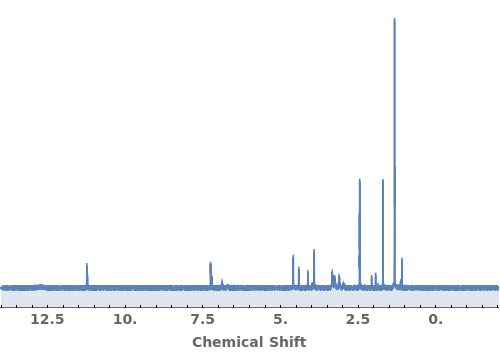
generates a graphical representation of spectra contained in NMRdata.
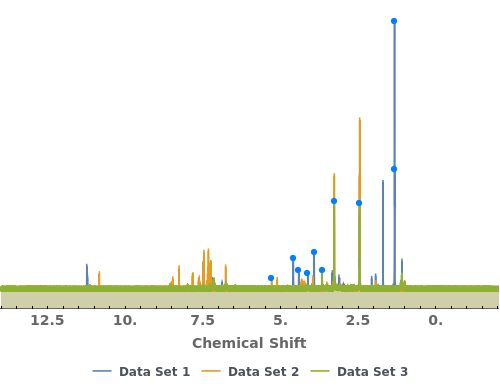
PlotNMR[spectra]⟹plot
generates a graphical representation of the provided spectra.
Details
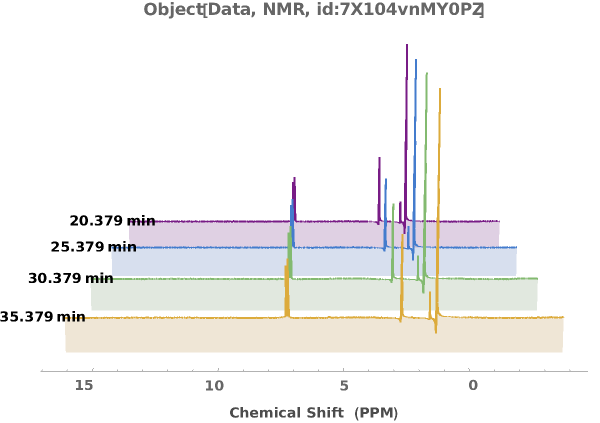
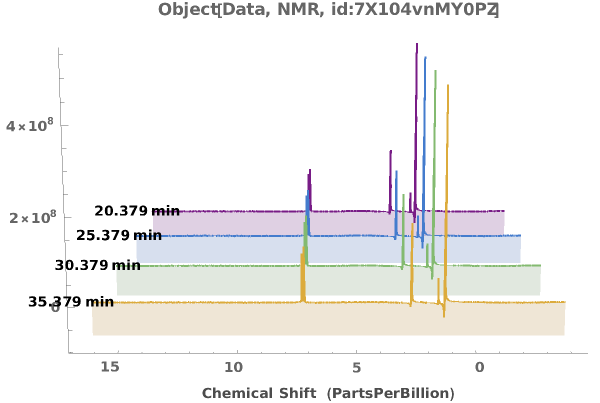
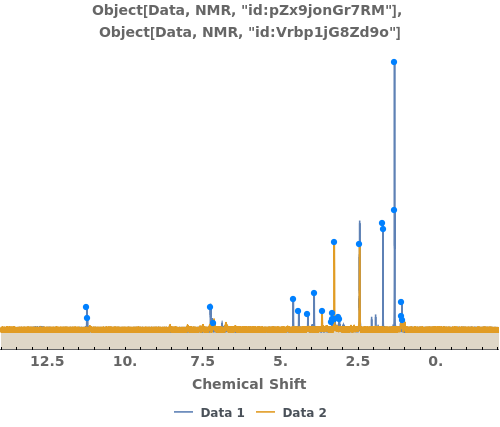
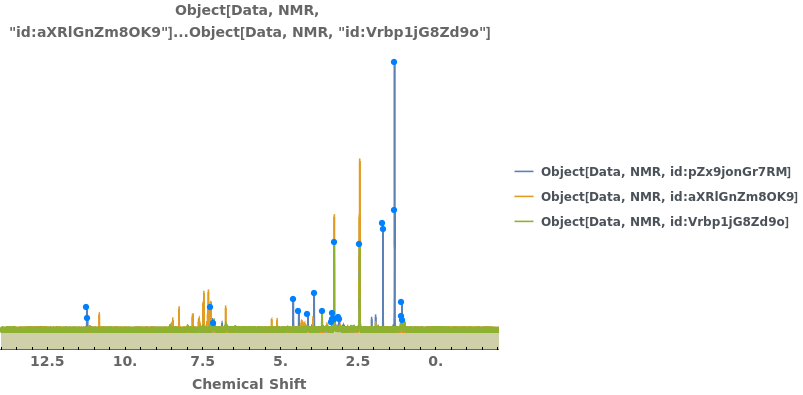
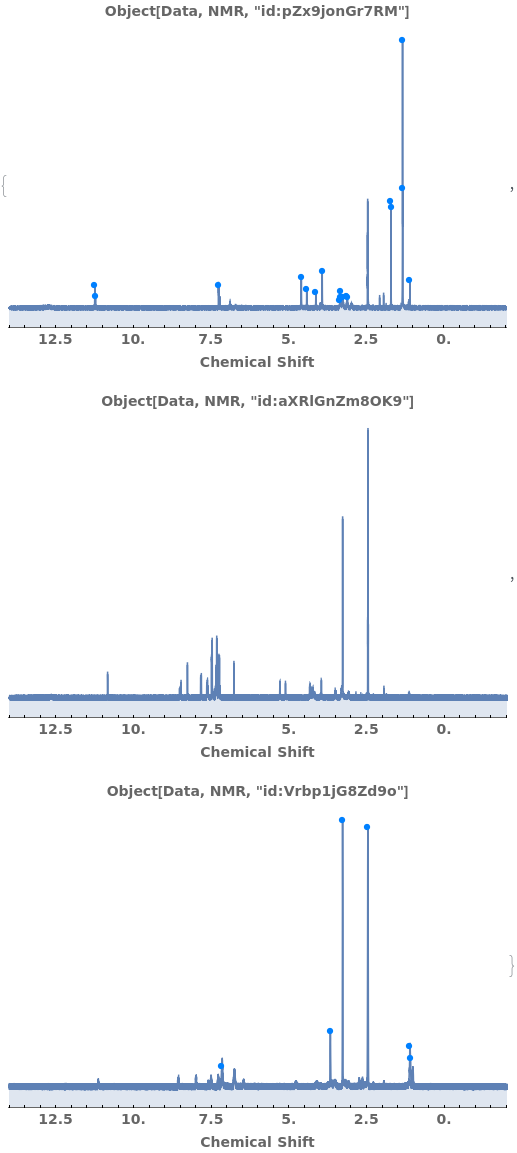
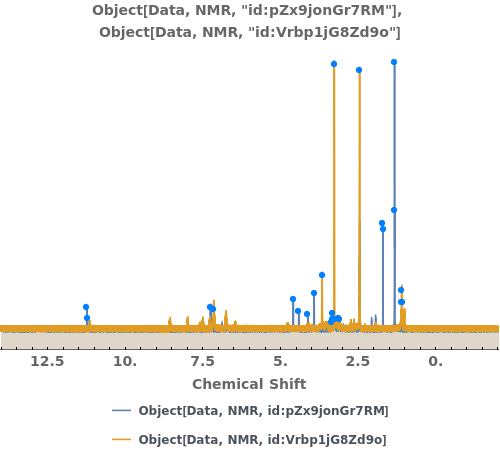
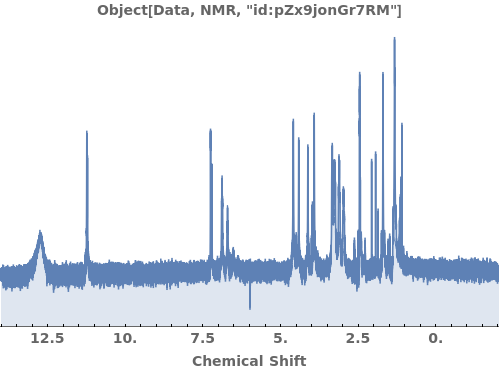
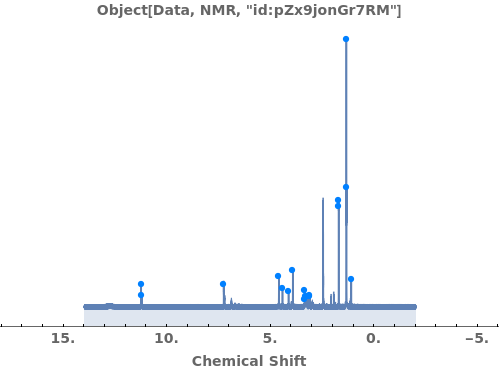
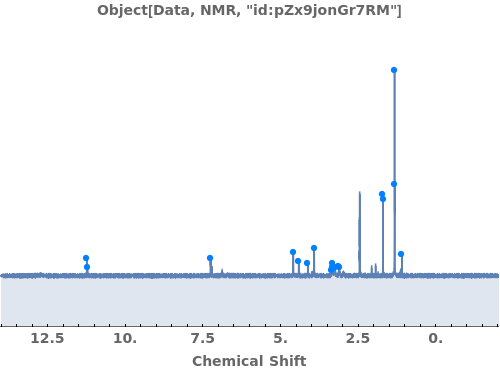
- NMR spectra are traditionally displayed in reverse x-axis form, however the option for PlotRange uses the standard {{xmin,xmax},{ymin,ymax}} format.
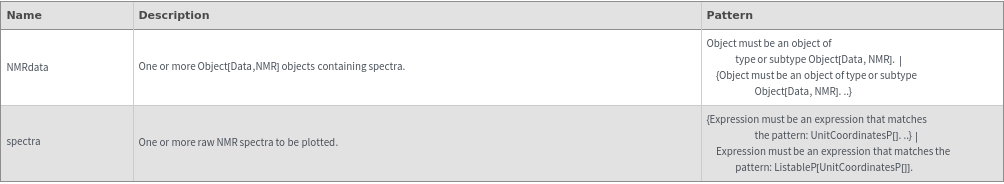
Input
Output

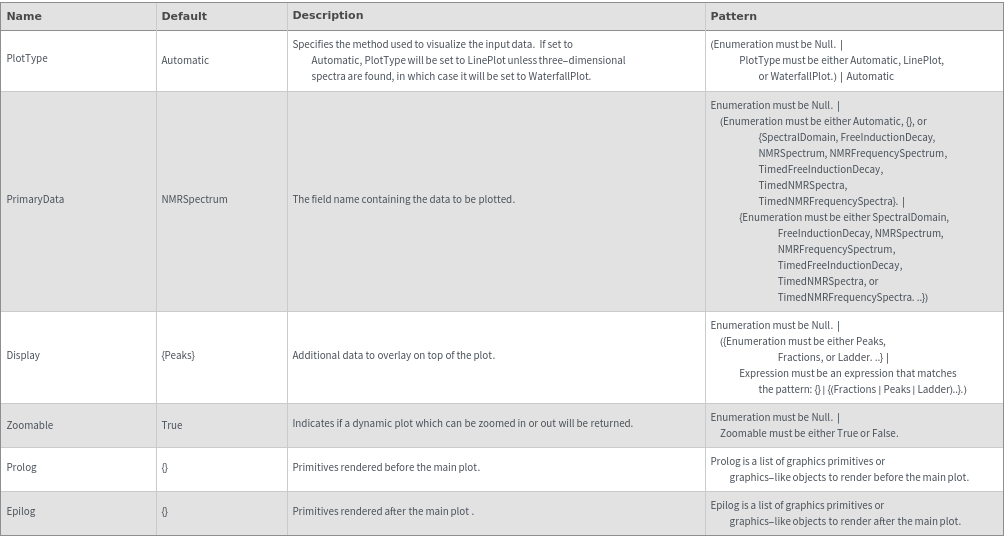
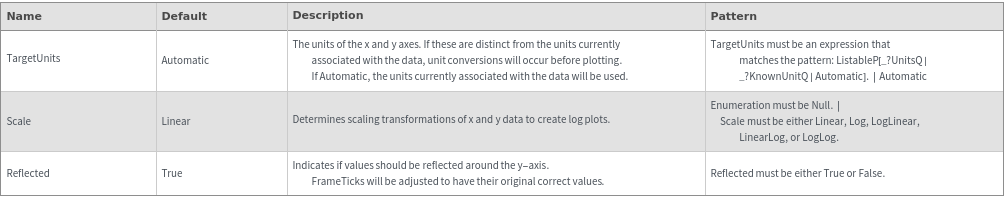
Data Specifications Options
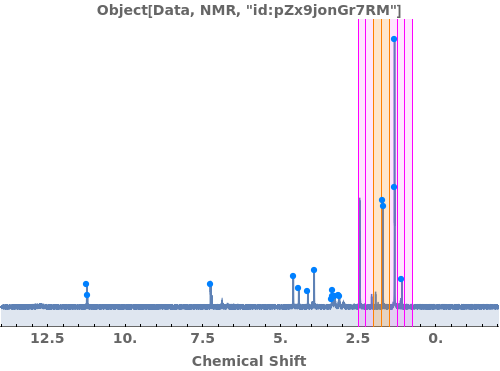
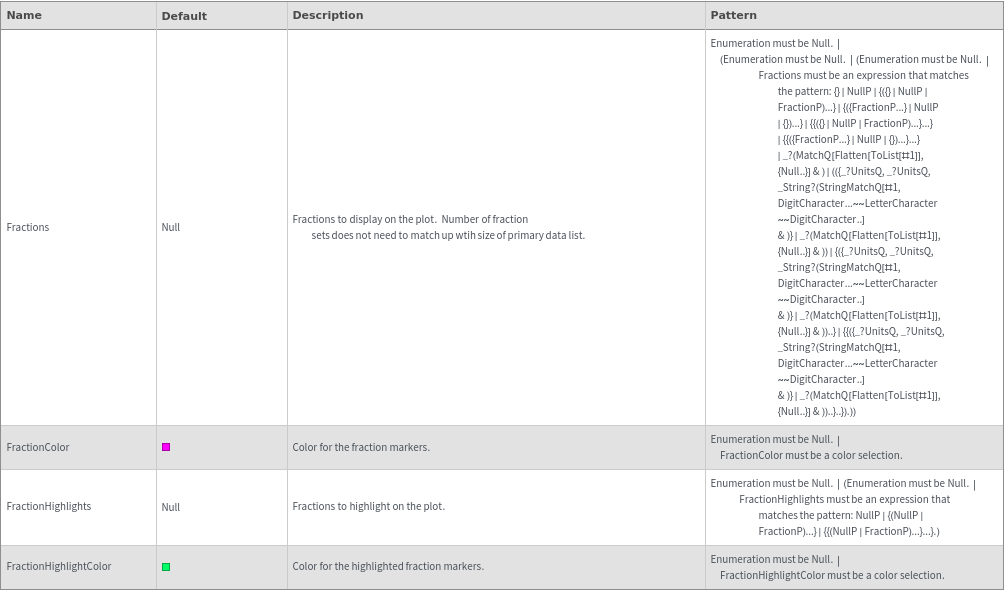
Fractions Options
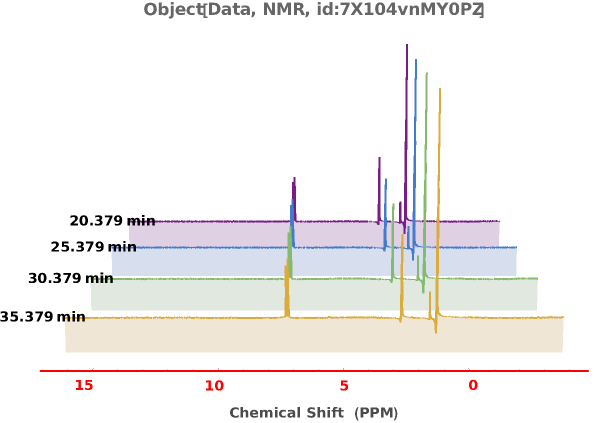
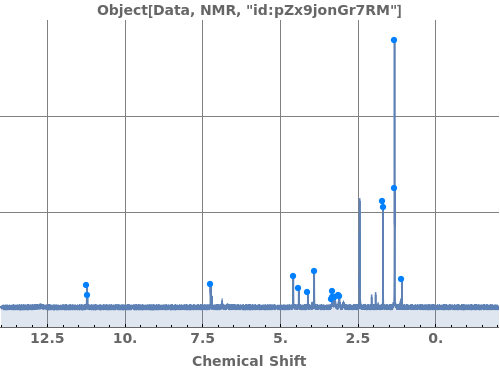
Frame Options

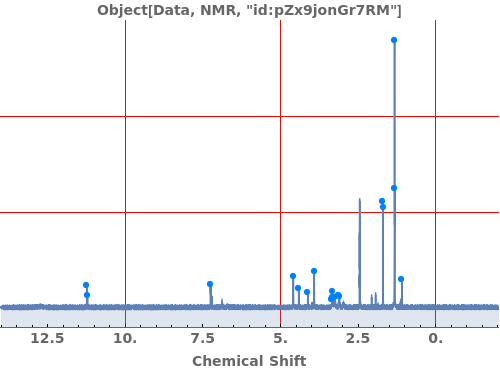
Grid Options
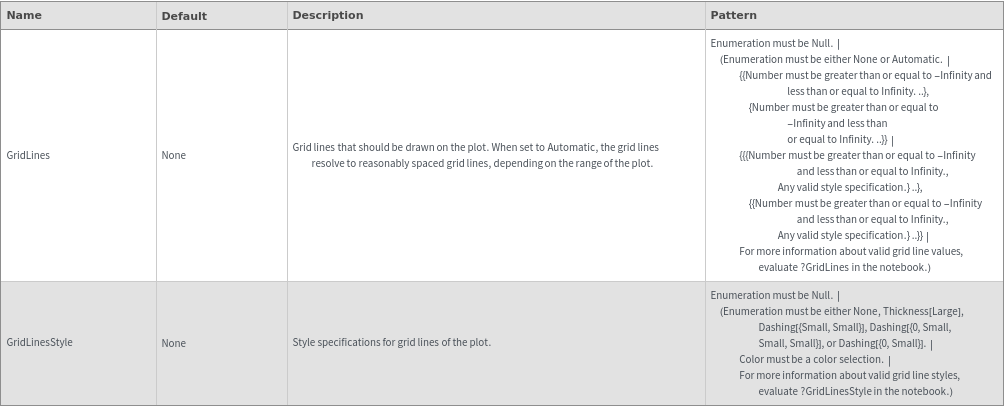
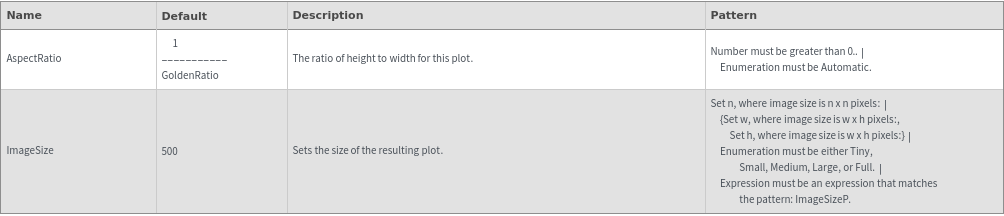
Image Format Options
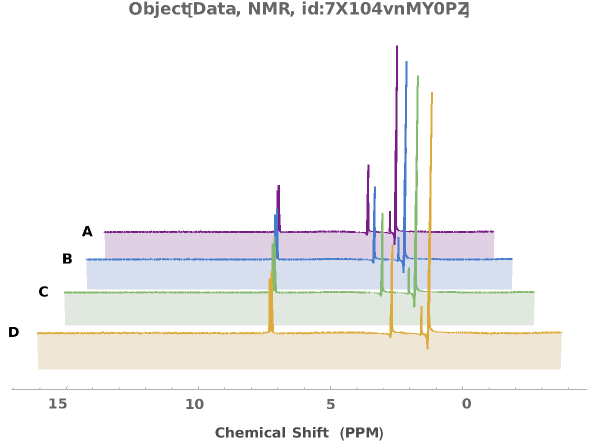
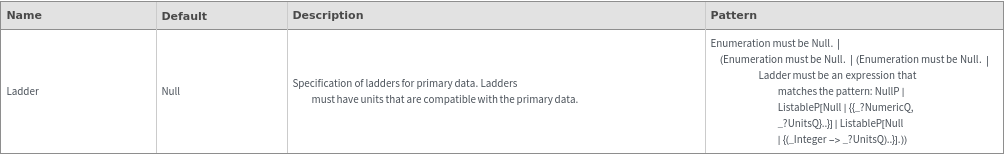
Ladder Options
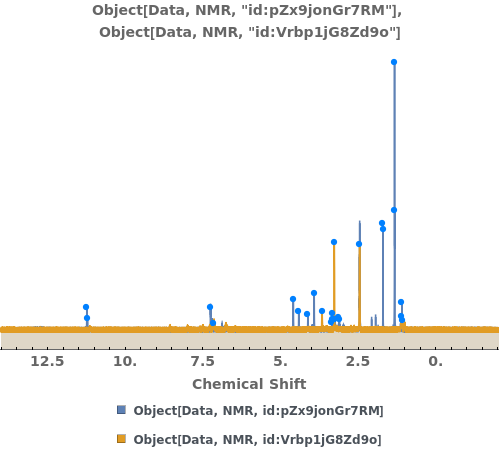
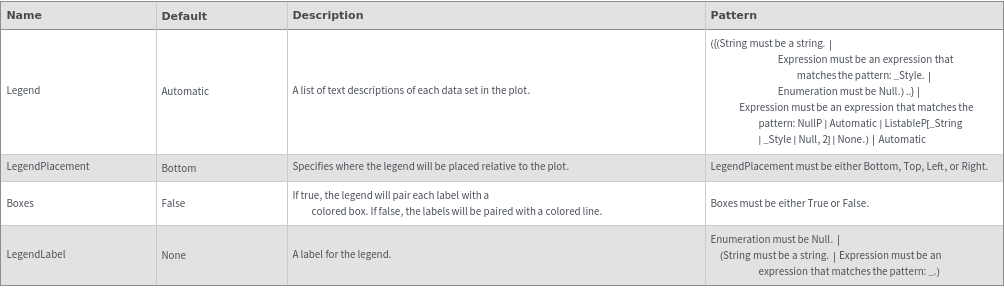
Legend Options
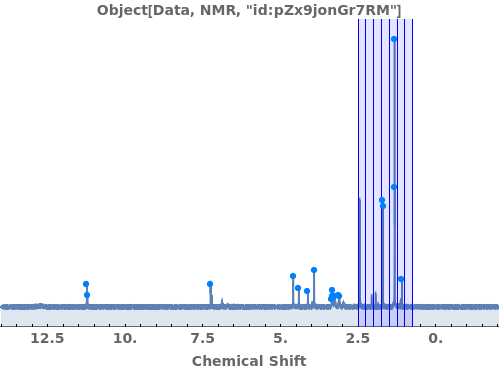
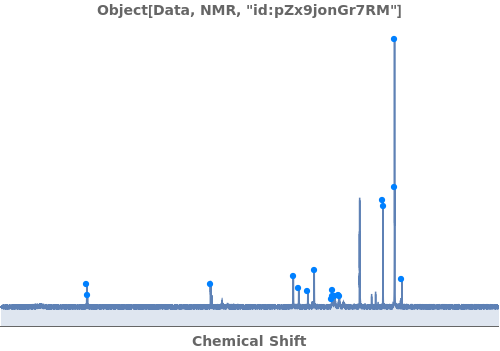
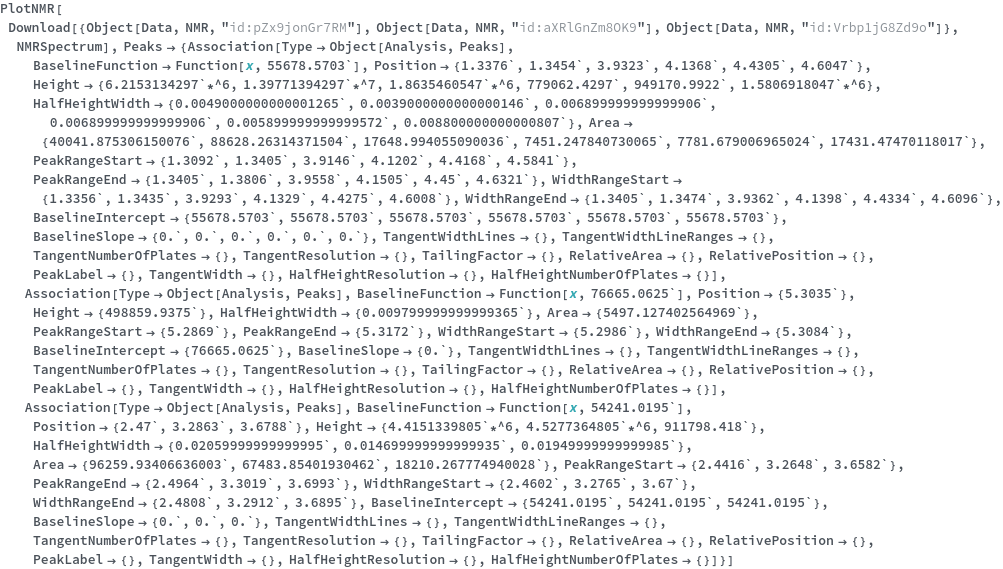
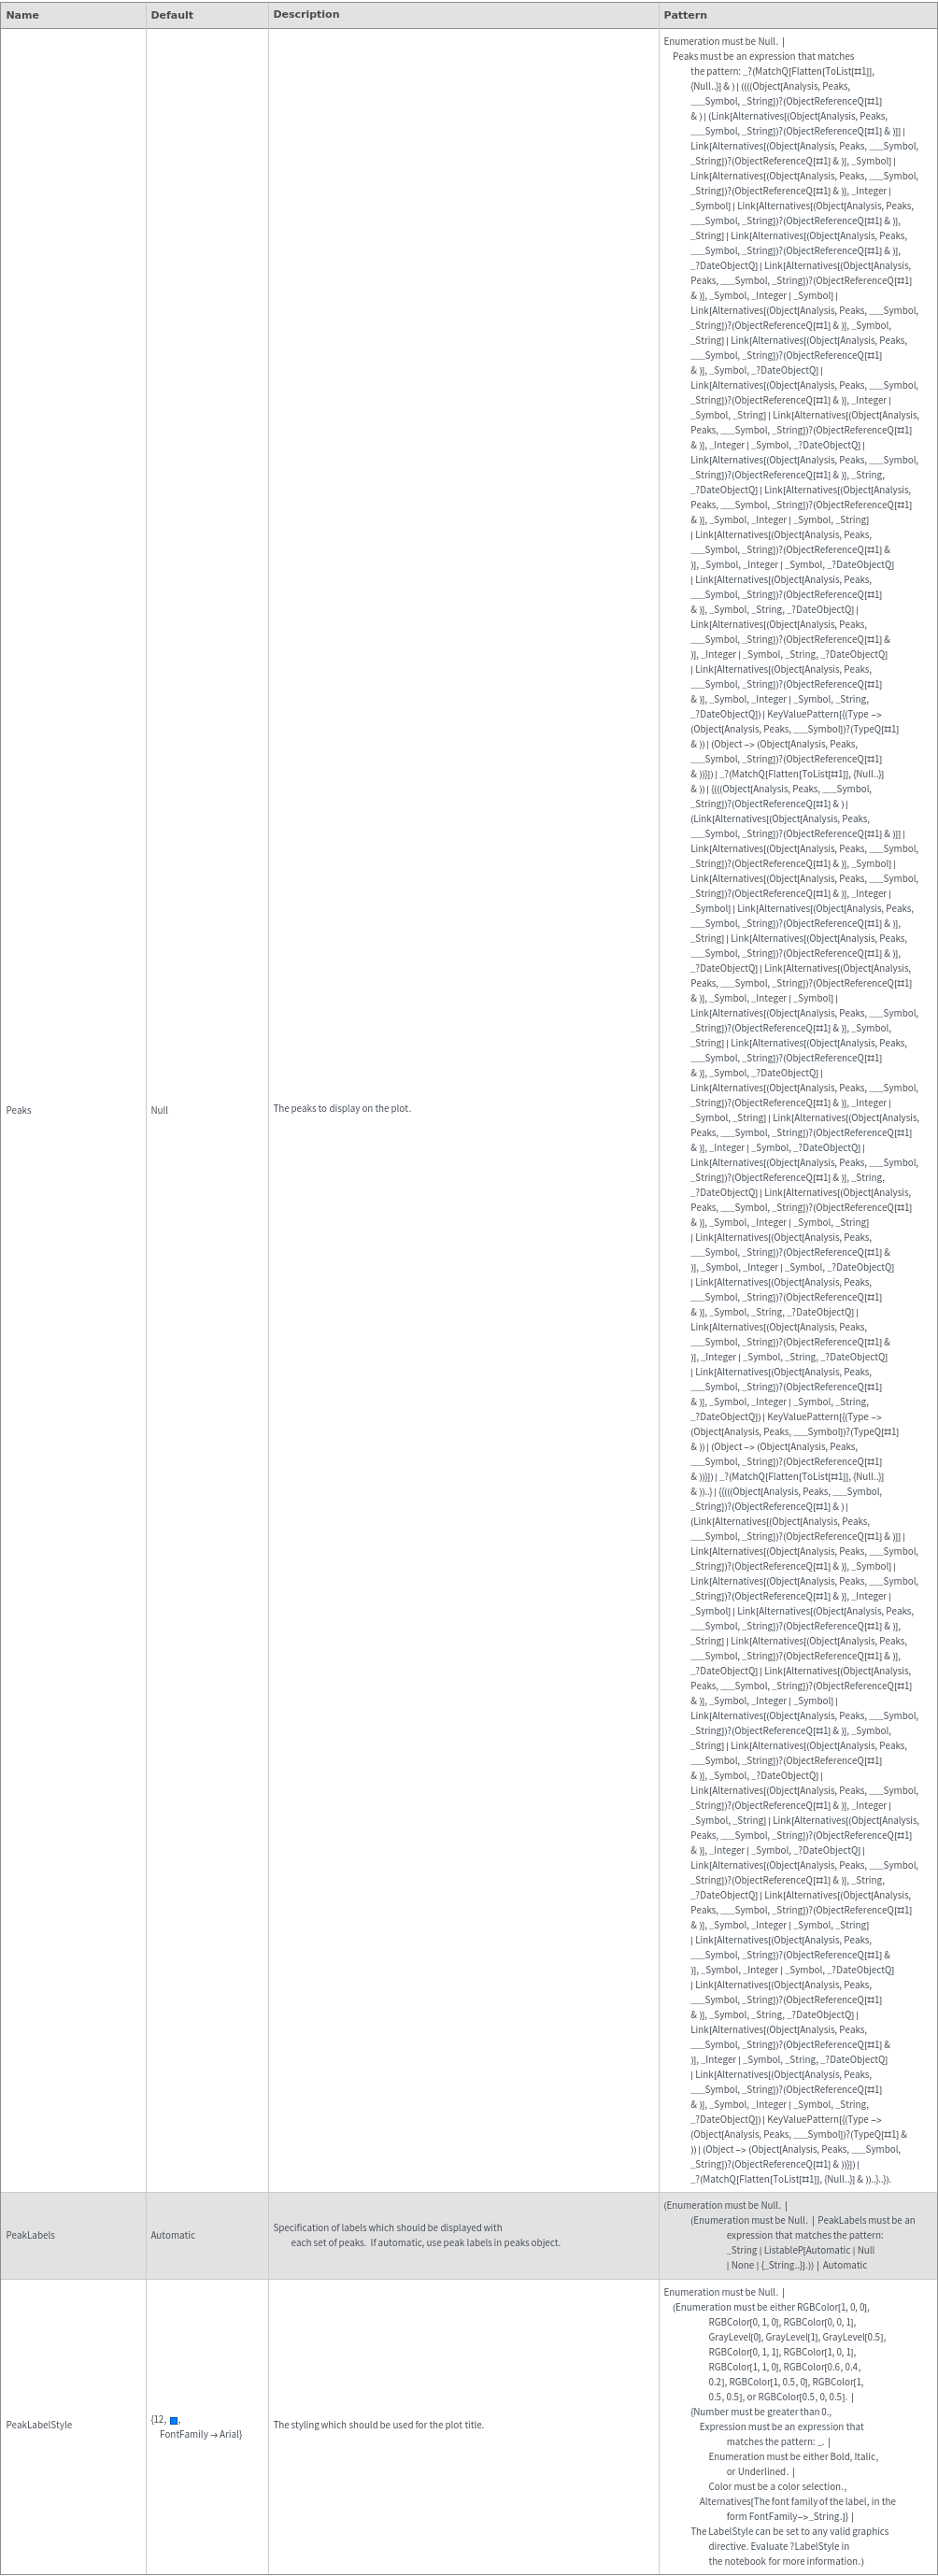
Peaks Options
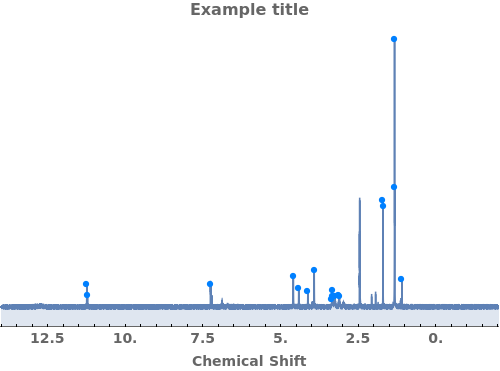
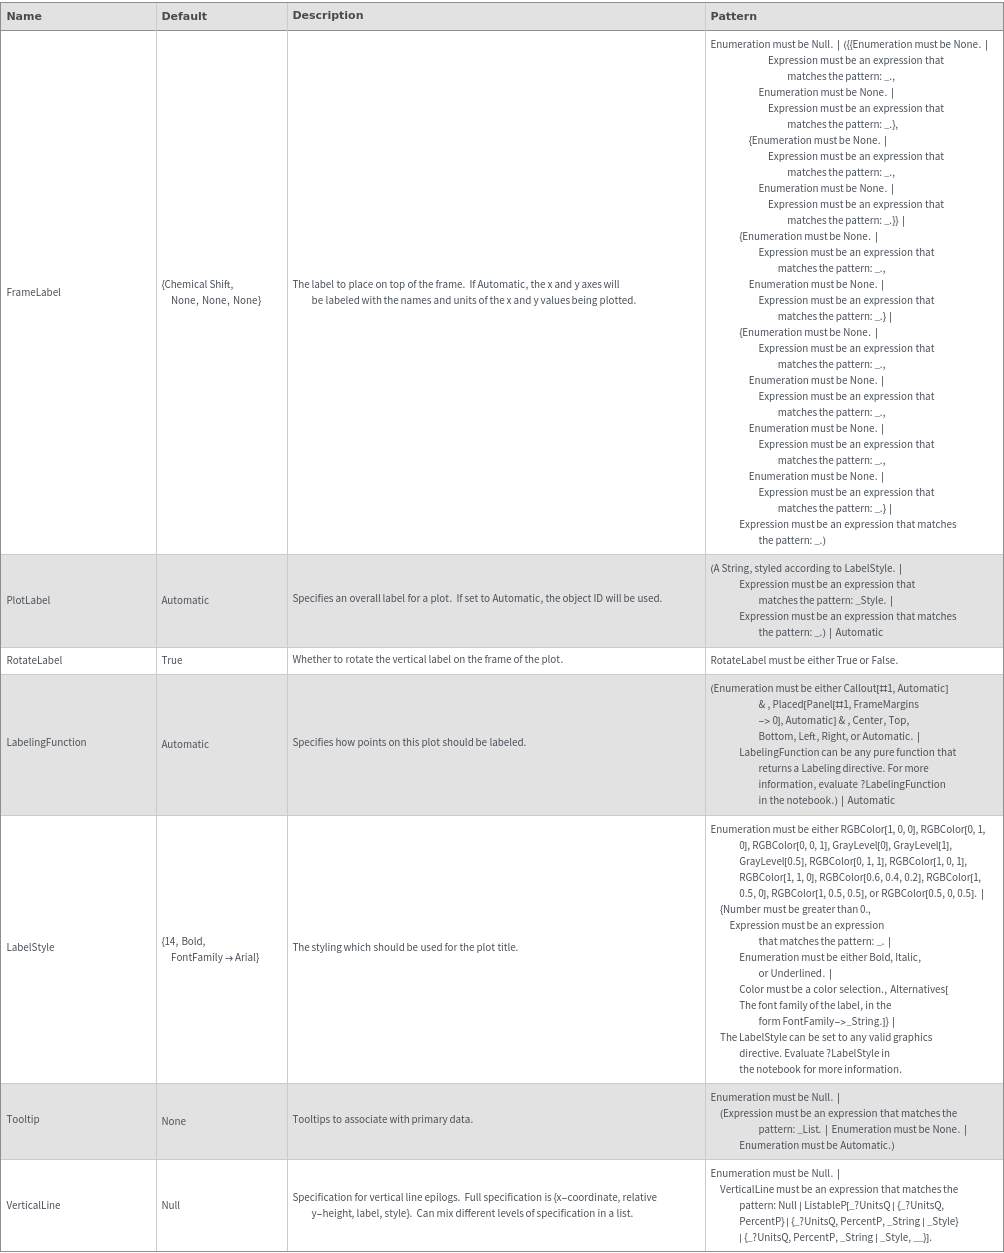
Plot Labeling Options
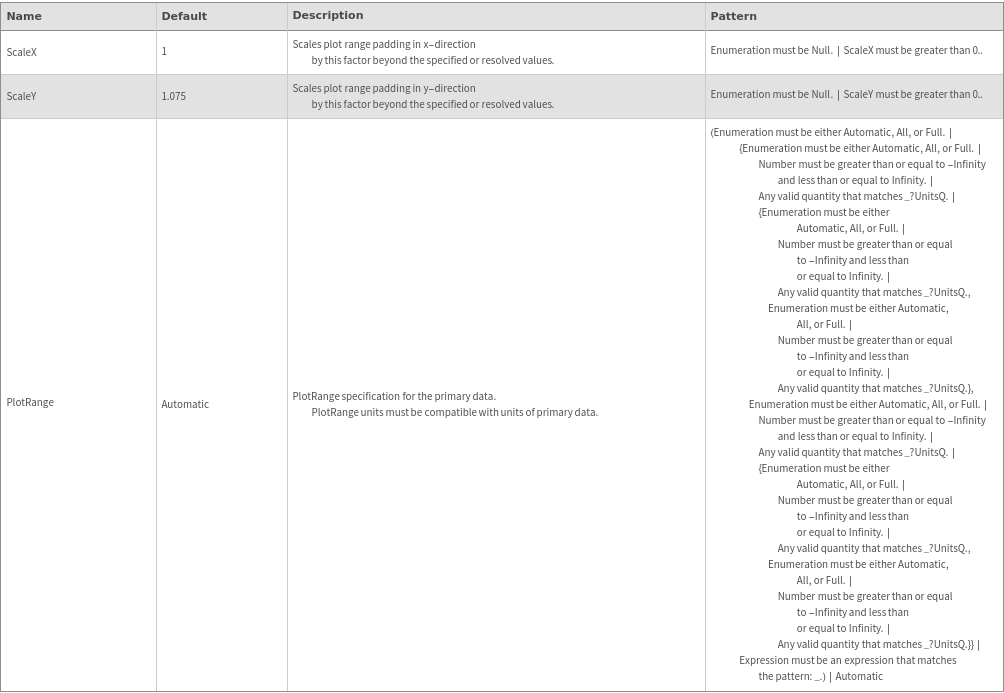
Plot Range Options
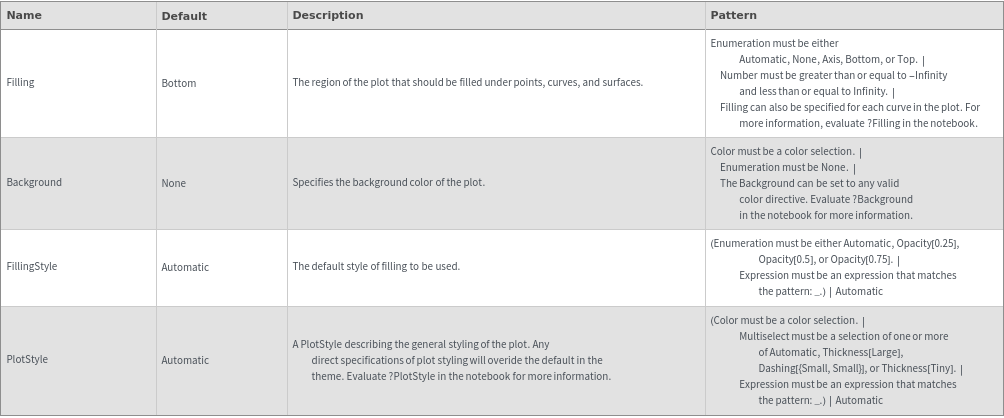
Plot Style Options
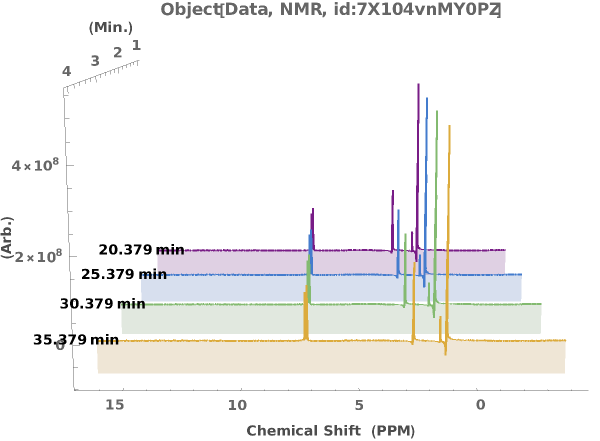
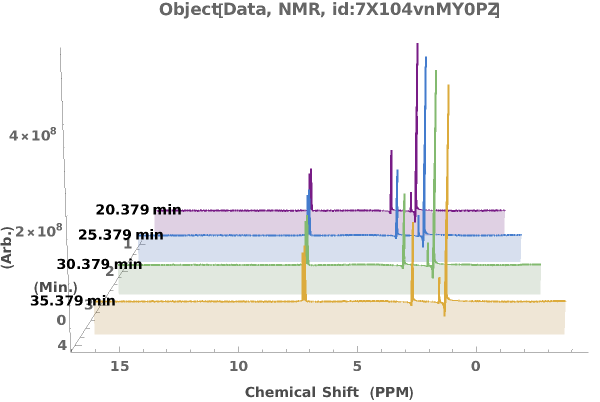
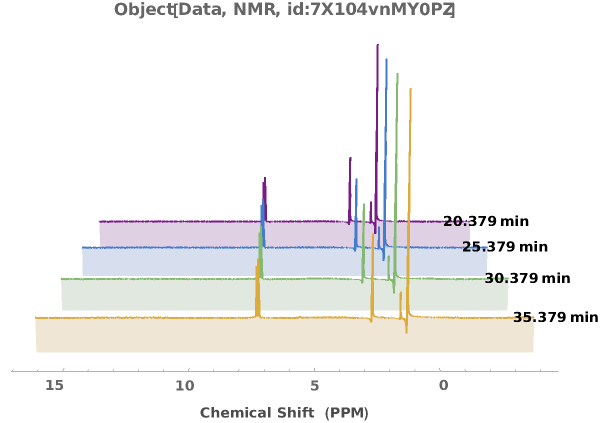
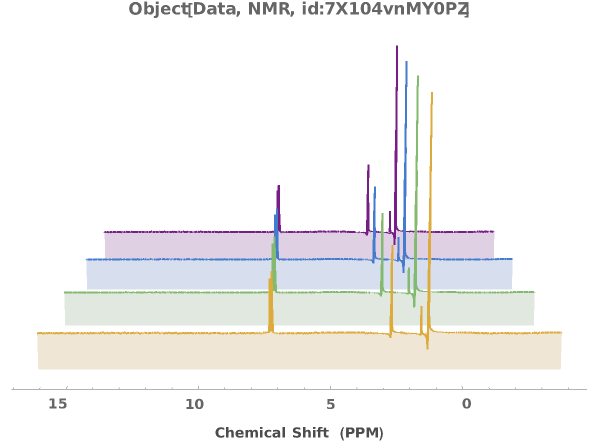
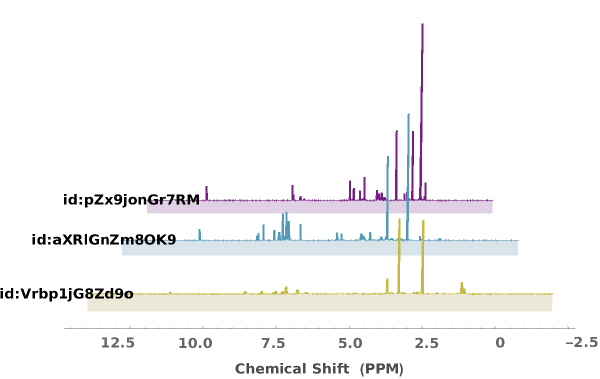
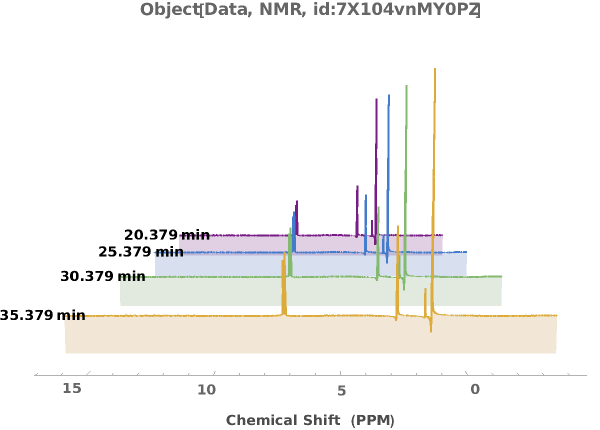
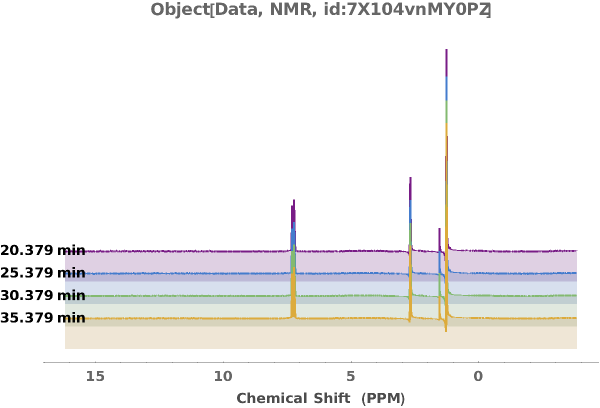
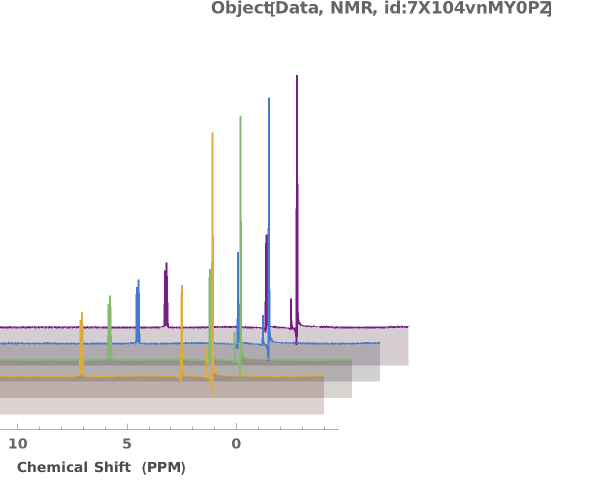
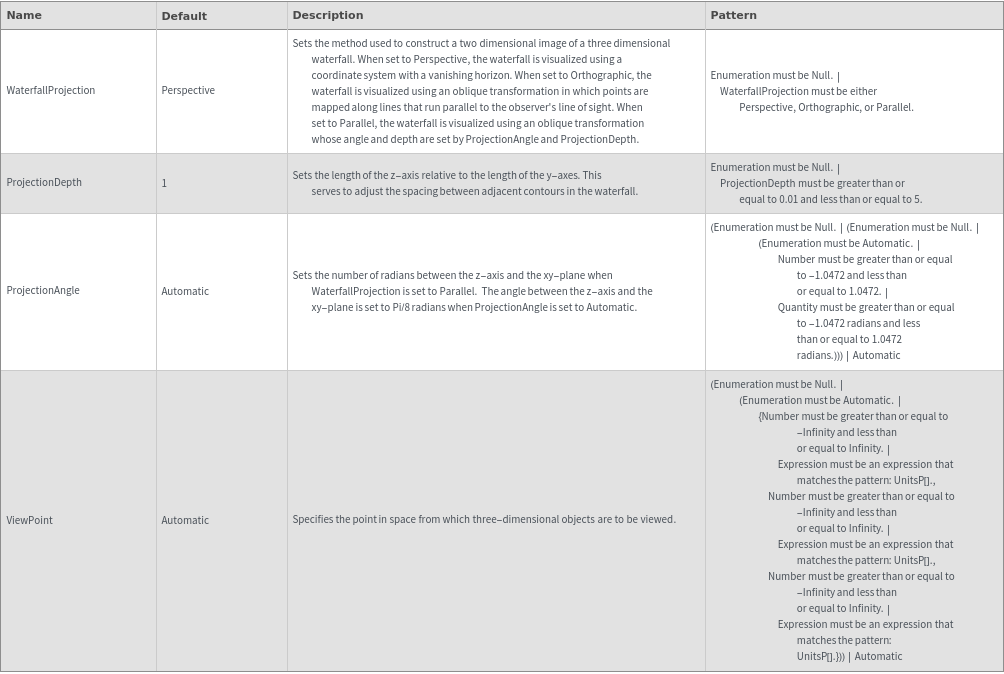
Waterfall 3D View Options
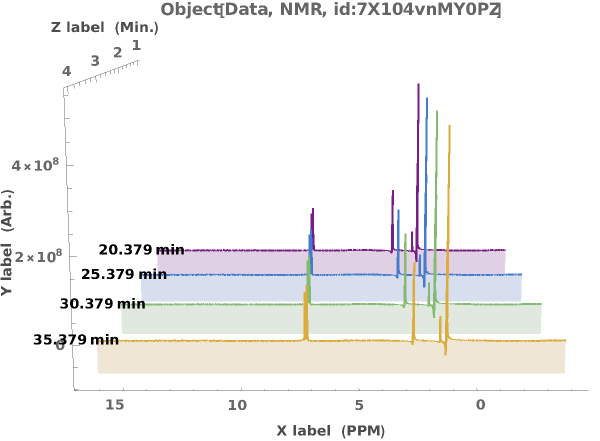
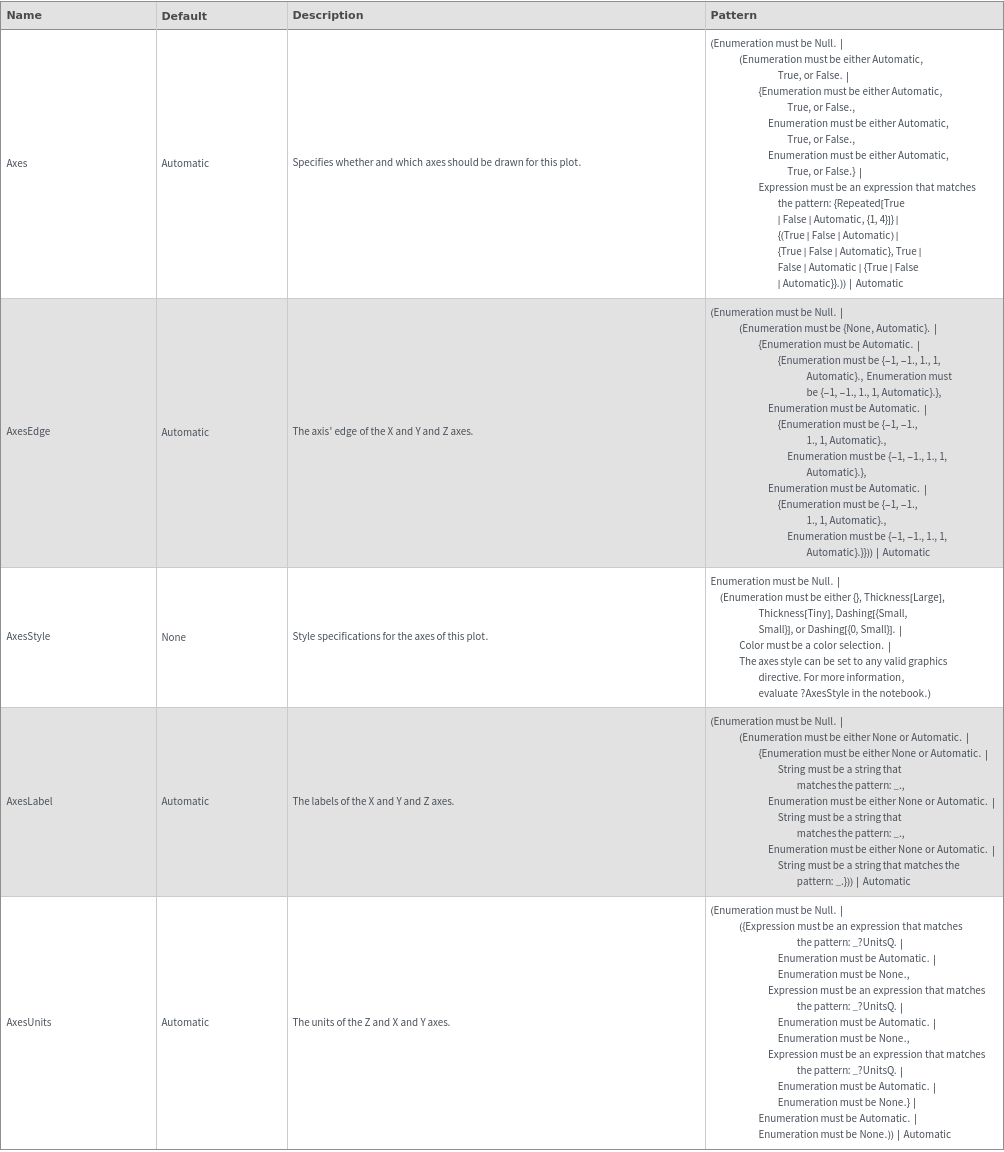
Waterfall Axes Options
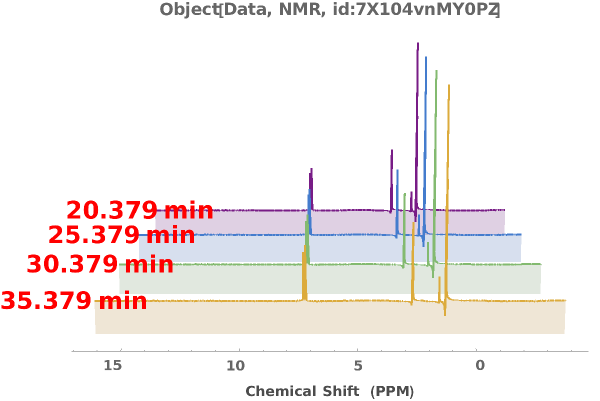
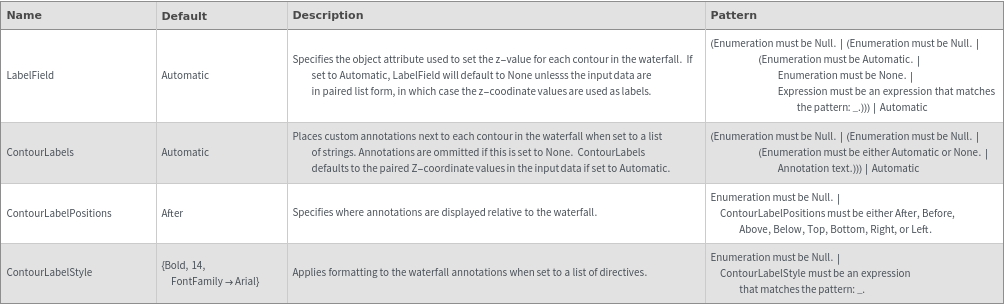
Waterfall Labels Options
General Options