PlotNMR2D
PlotNMR2D[NMR2Ddata]⟹plot
provides a graphical plot the provided NMR2Ddata spectra.
Details
- Two-dimensional NMR spectra are traditionally displayed as contour plots.
- The dynamic slider below each plot controls the threshold below which peaks will not be shown.
- If the data is particularly noisy and the signal is weak, the slider will not appear and the spectrum may only be viewed at a single contour level.
- Note that the first time a dataset is plotted in a session, it may take a long time to process the data. Contour levels are cached so that subsequent plots of the same data are fast.
Input
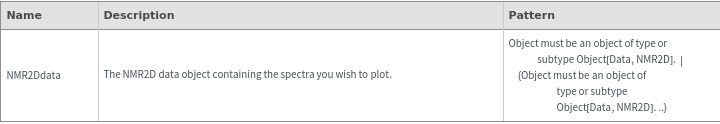
Output

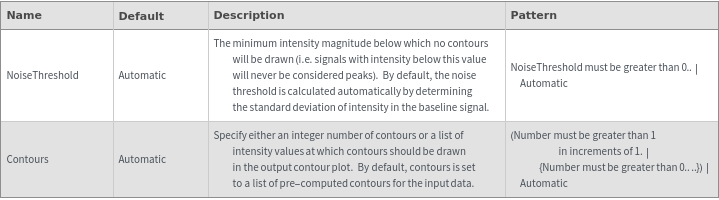
Contours Options
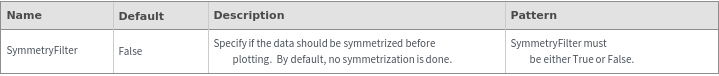
Data Processing Options
Frame Options
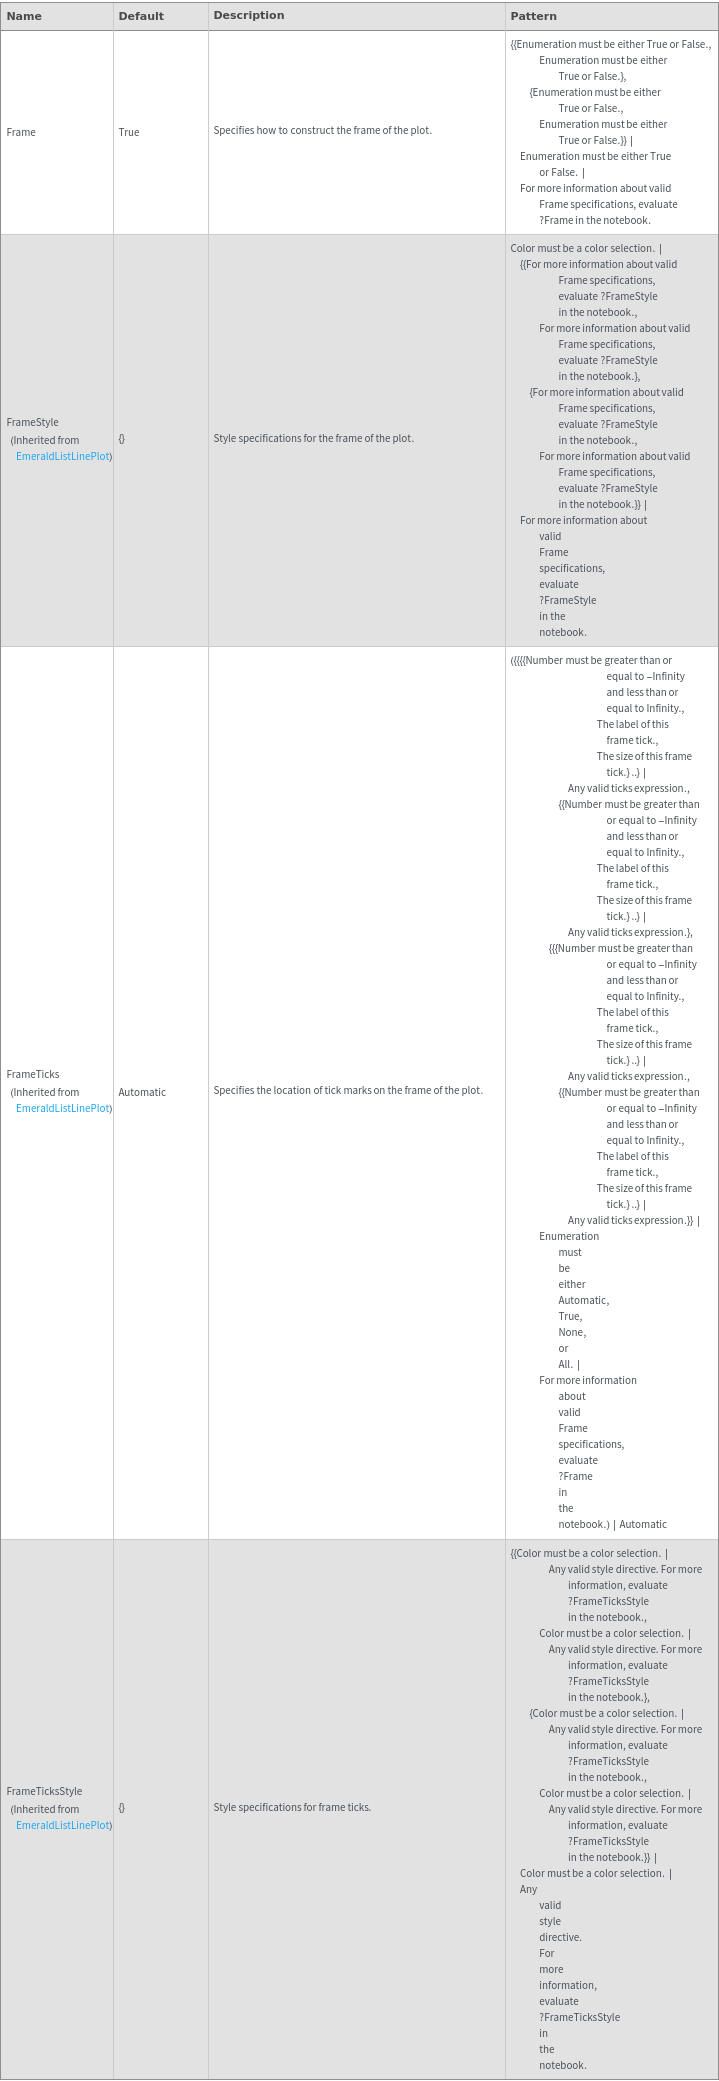
Grid Options
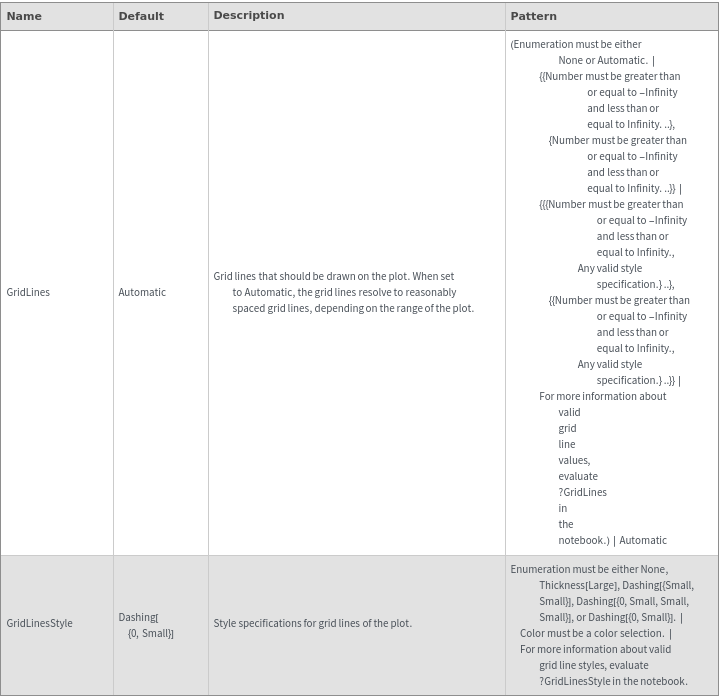
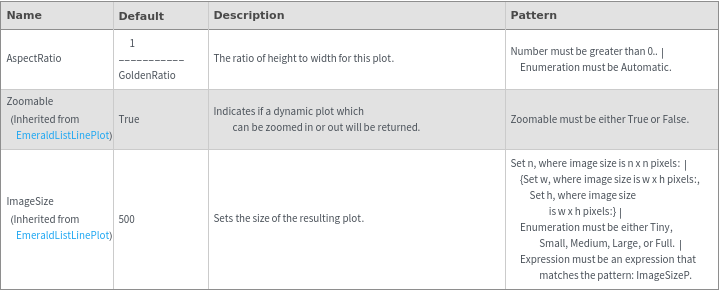
Image Format Options
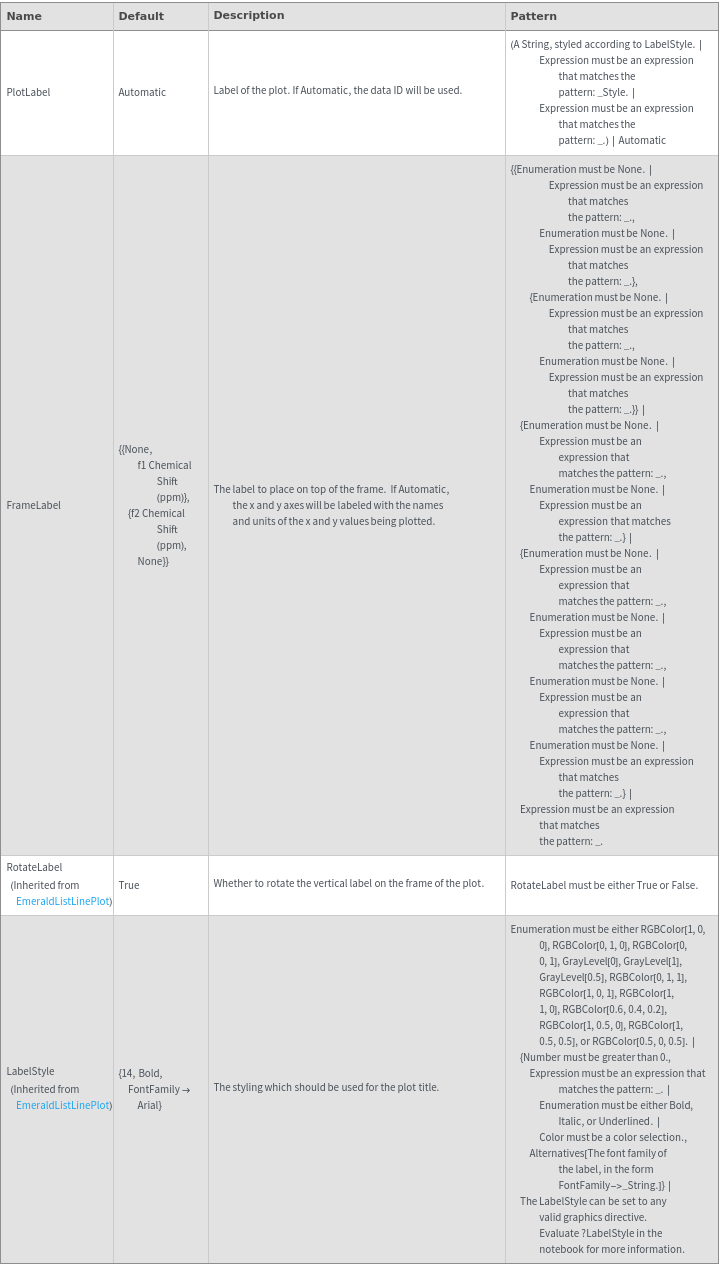
Plot Labeling Options
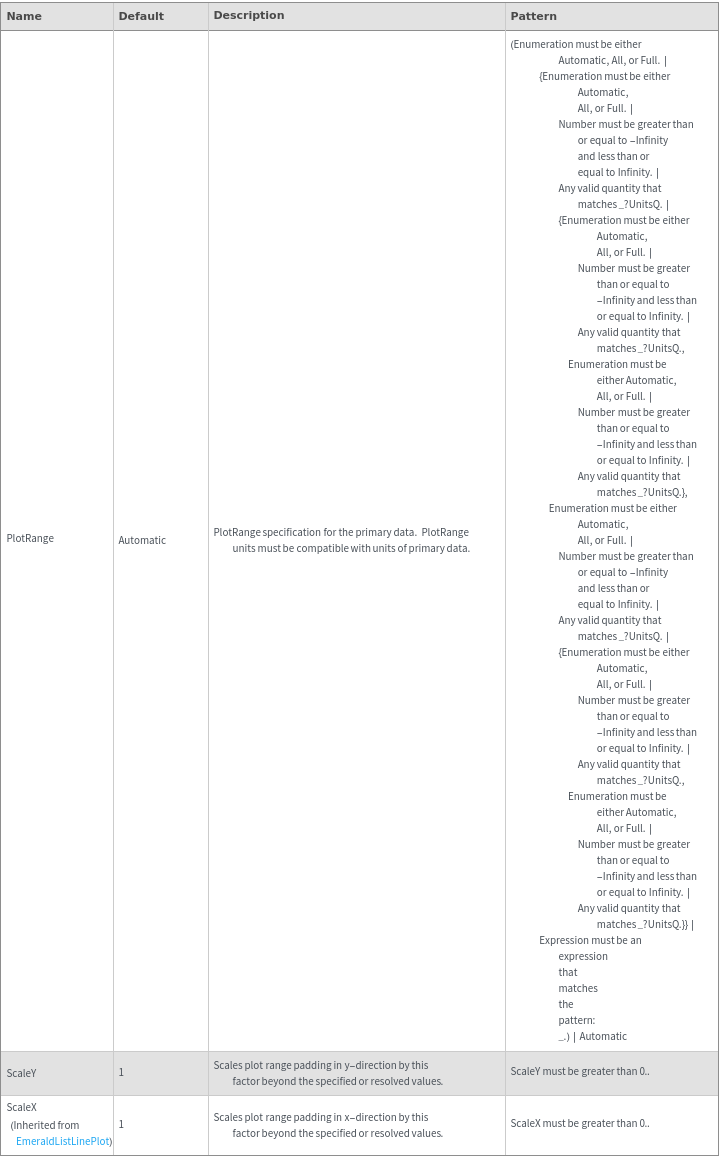
Plot Range Options
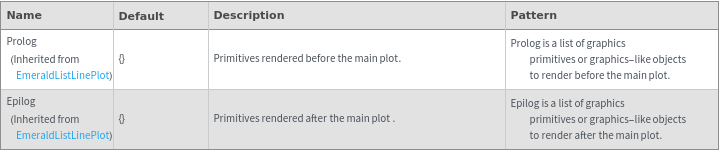
General Options