PlotPAGE
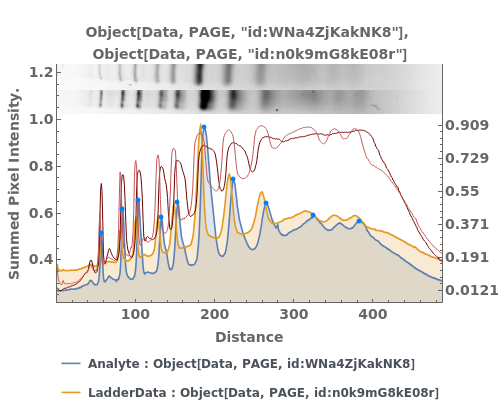
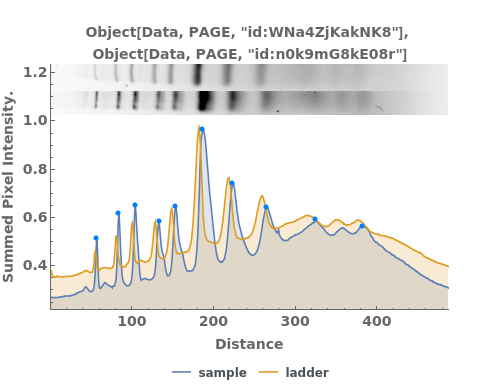
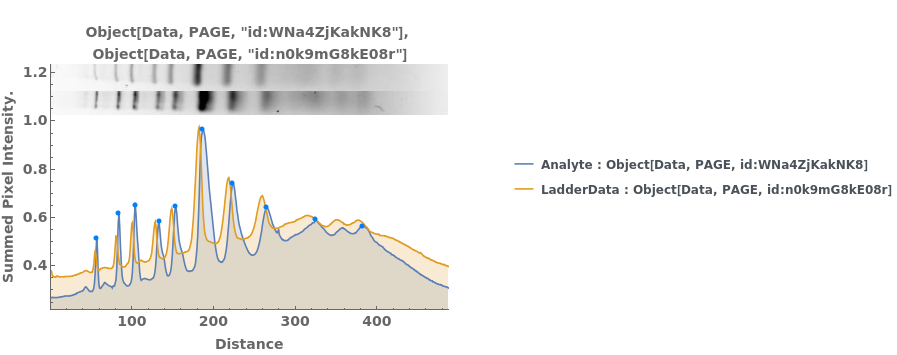
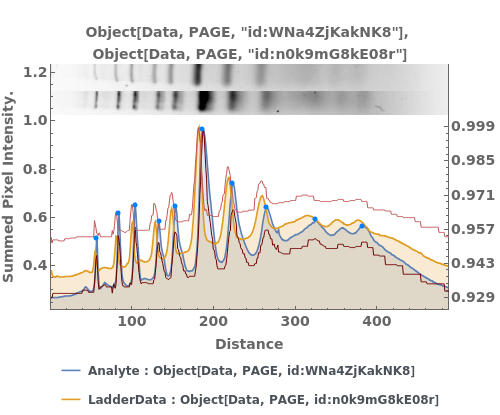
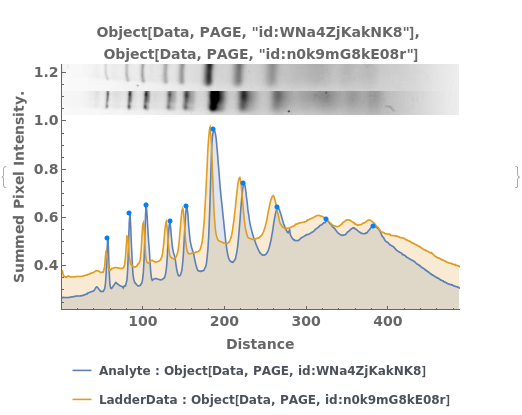
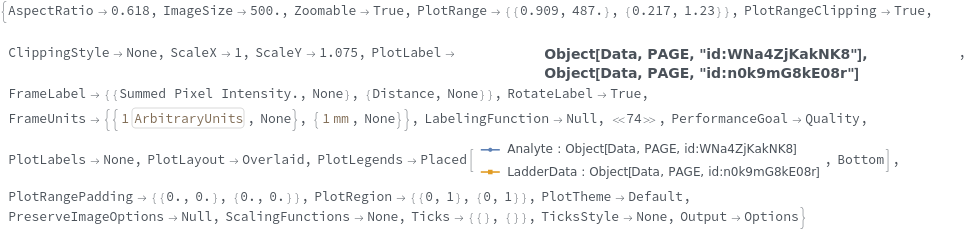
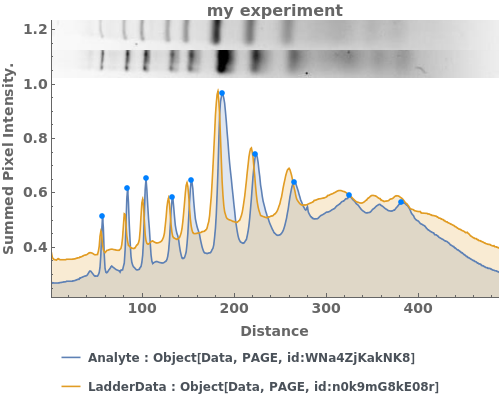
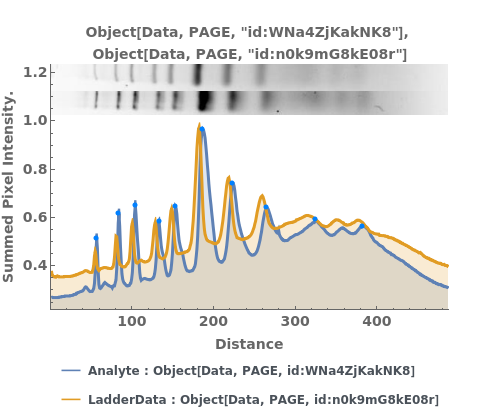
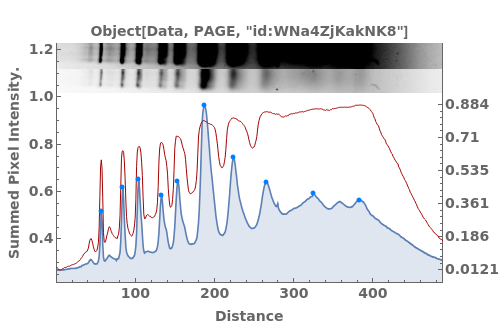
PlotPAGE[pageData]⟹plot
returns a pixel intensity plot of the LaneImage of the given pageData, with LaneImage across top of plot.
Details
Input

Output

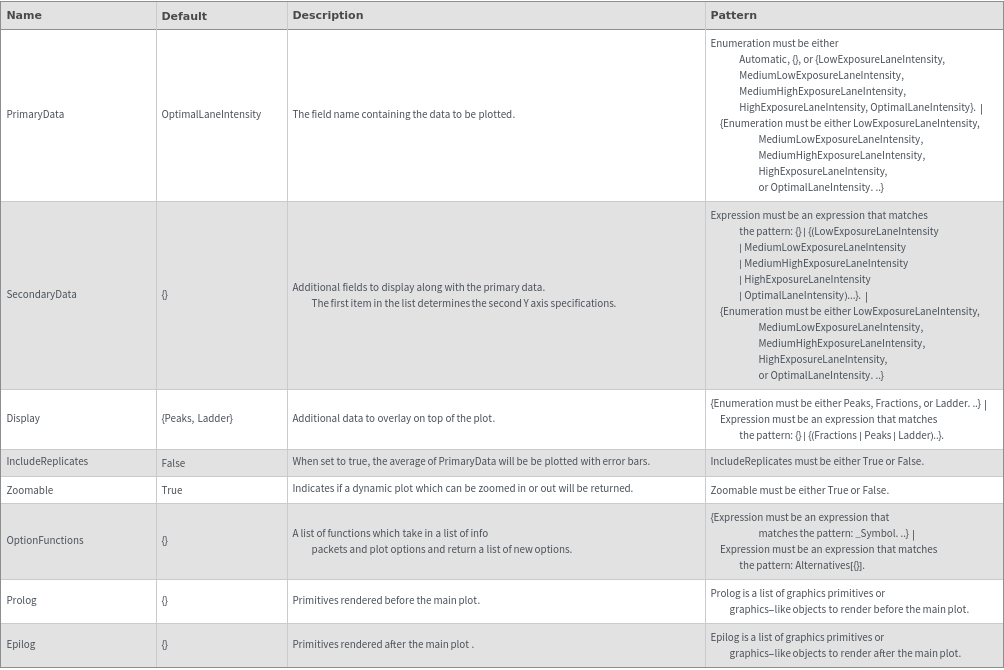
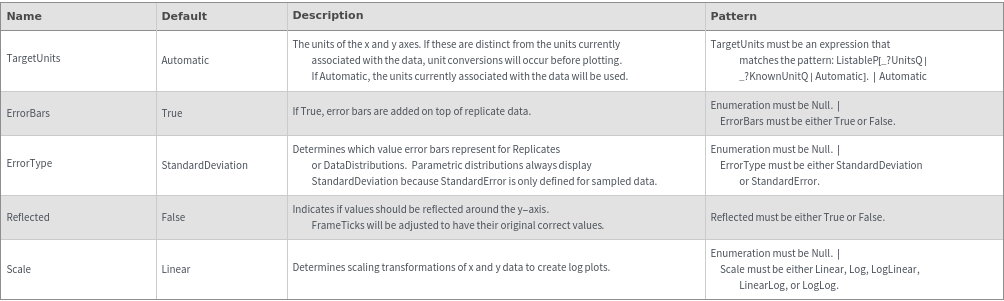
Data Specification Options

Data Specifications Options
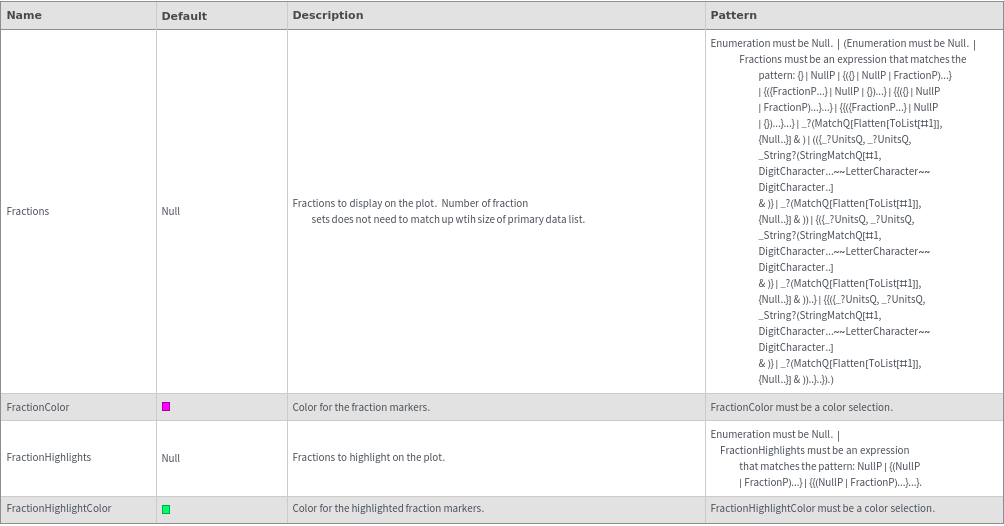
Fractions Options
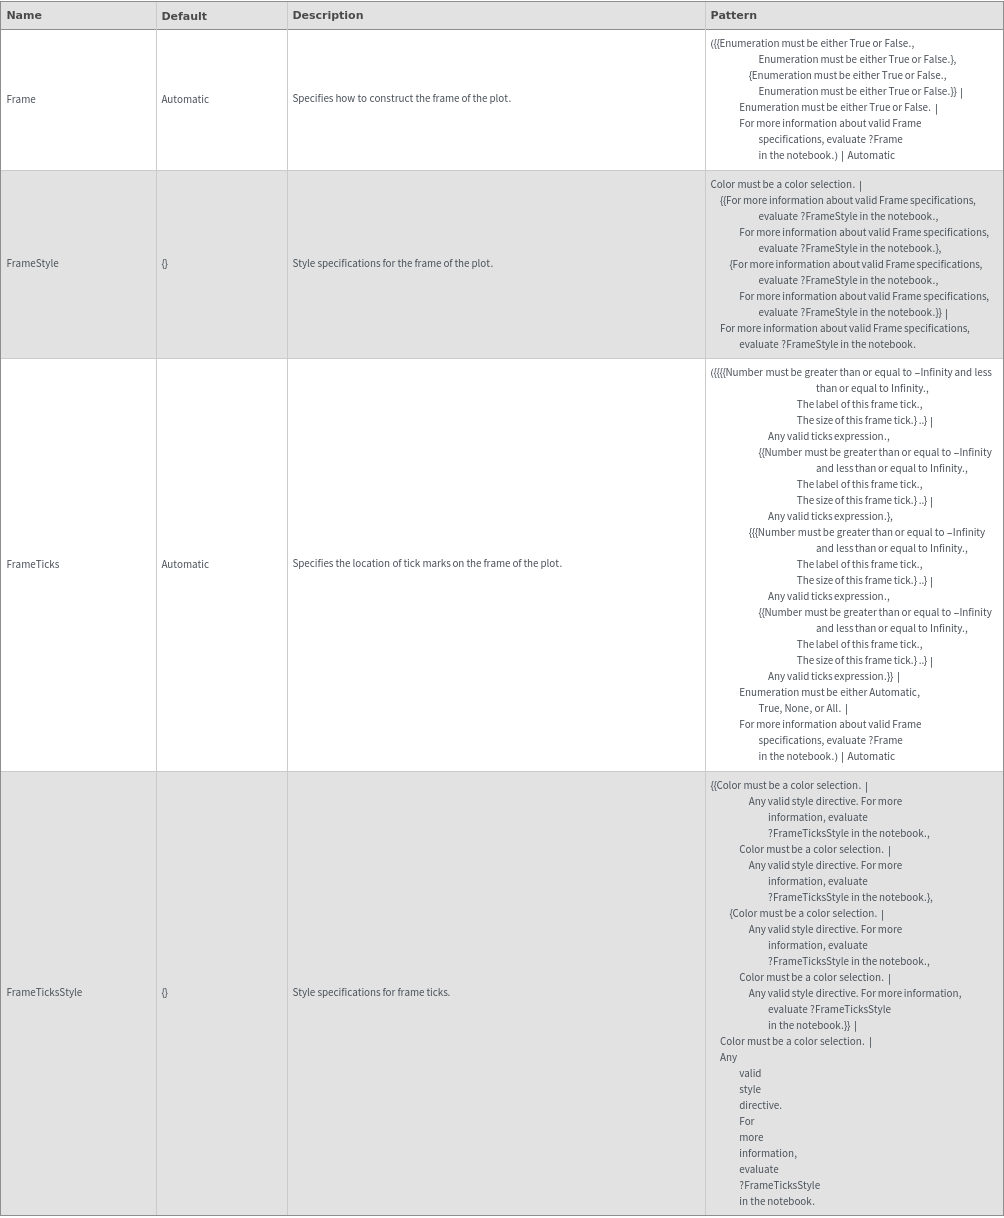
Frame Options
Grid Options
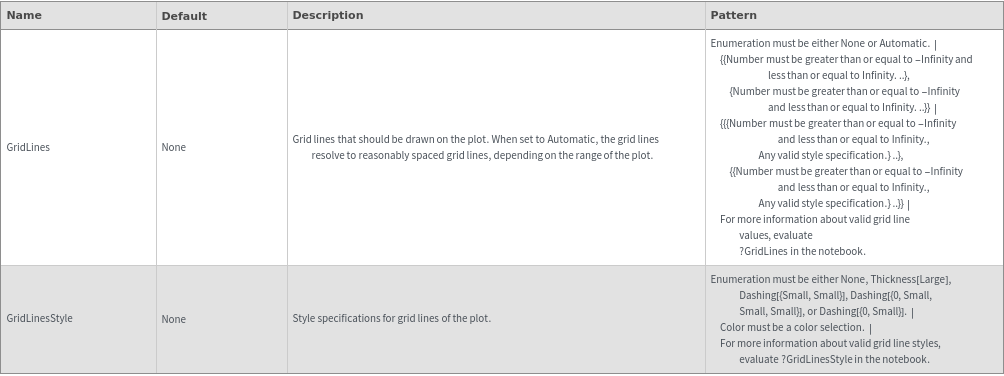
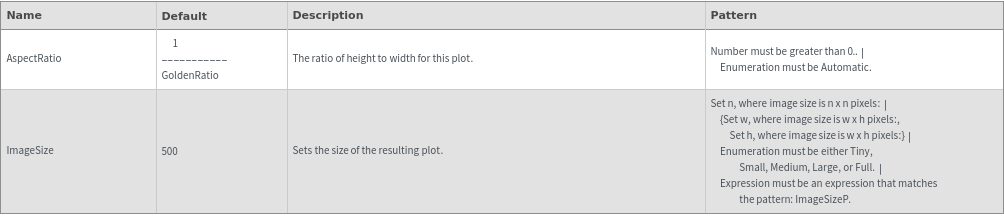
Image Format Options
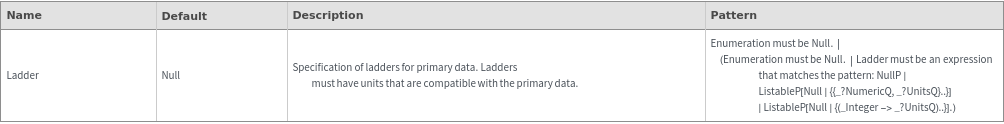
Ladder Options
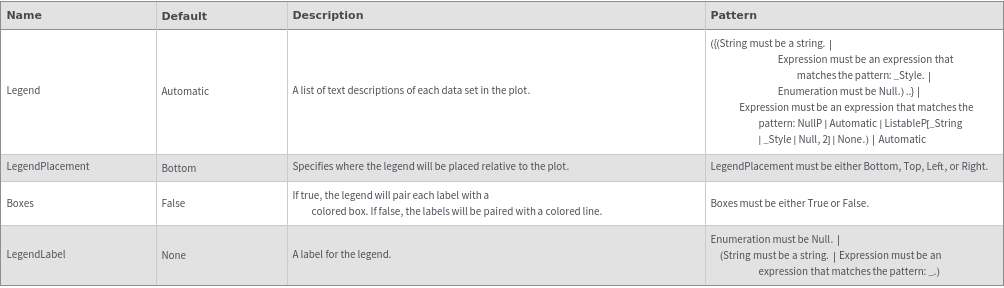
Legend Options
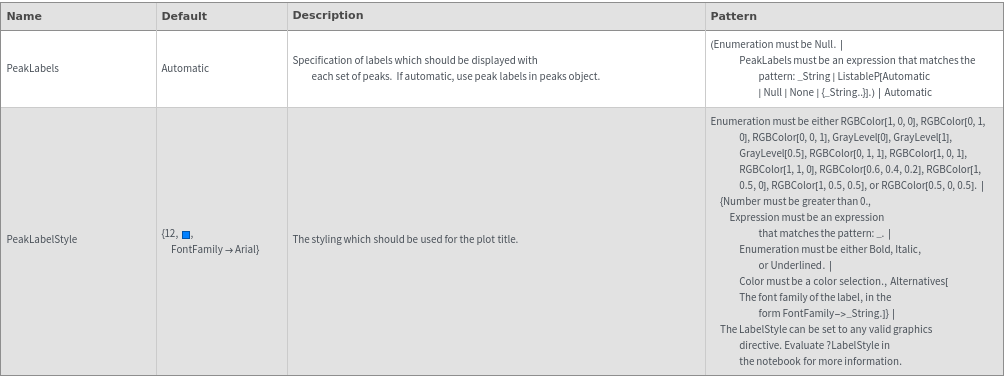
Peaks Options
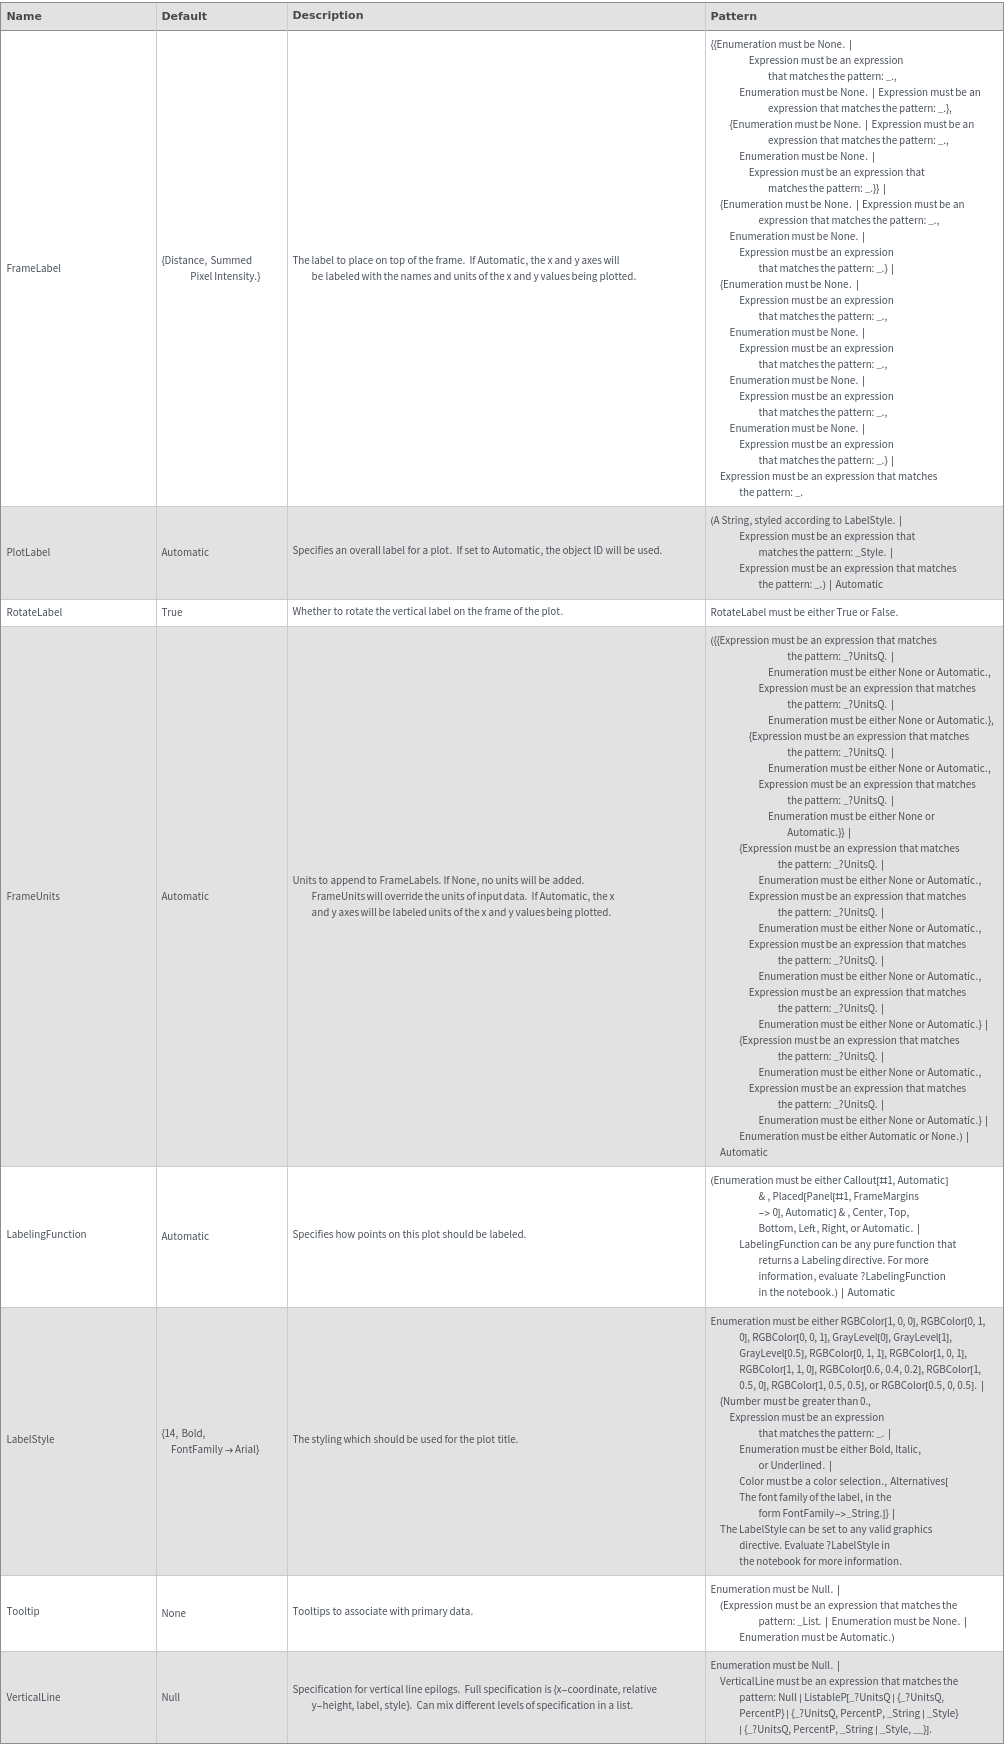
Plot Labeling Options
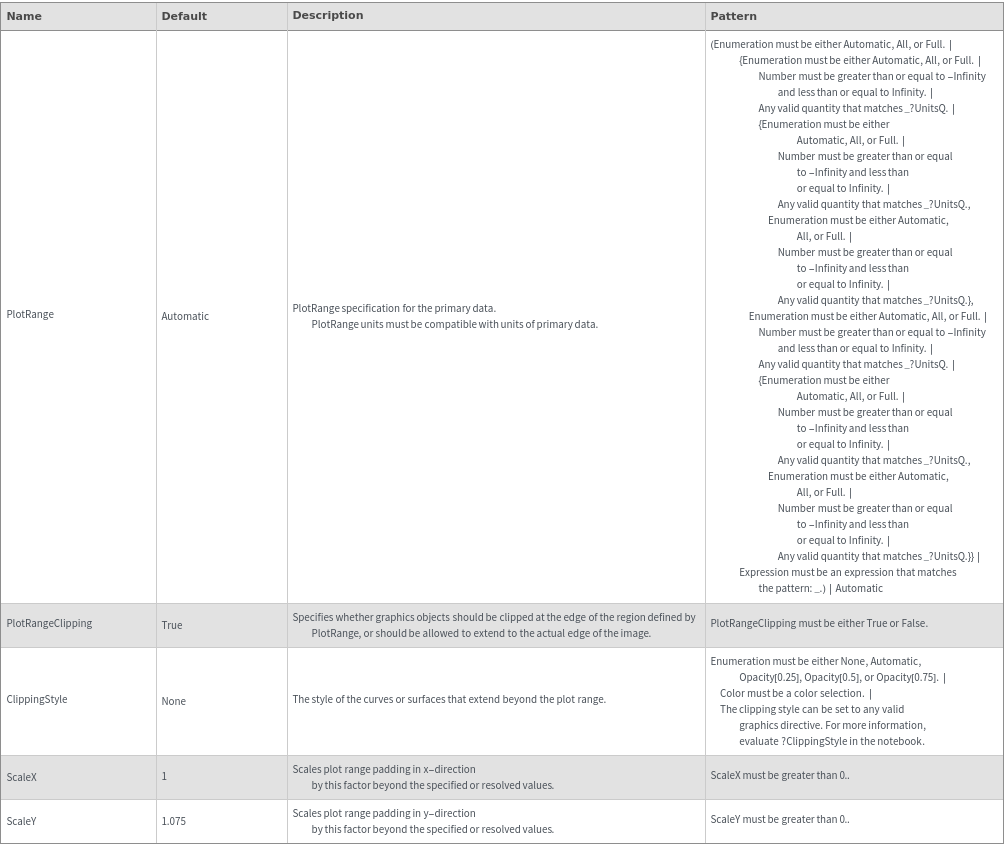
Plot Range Options
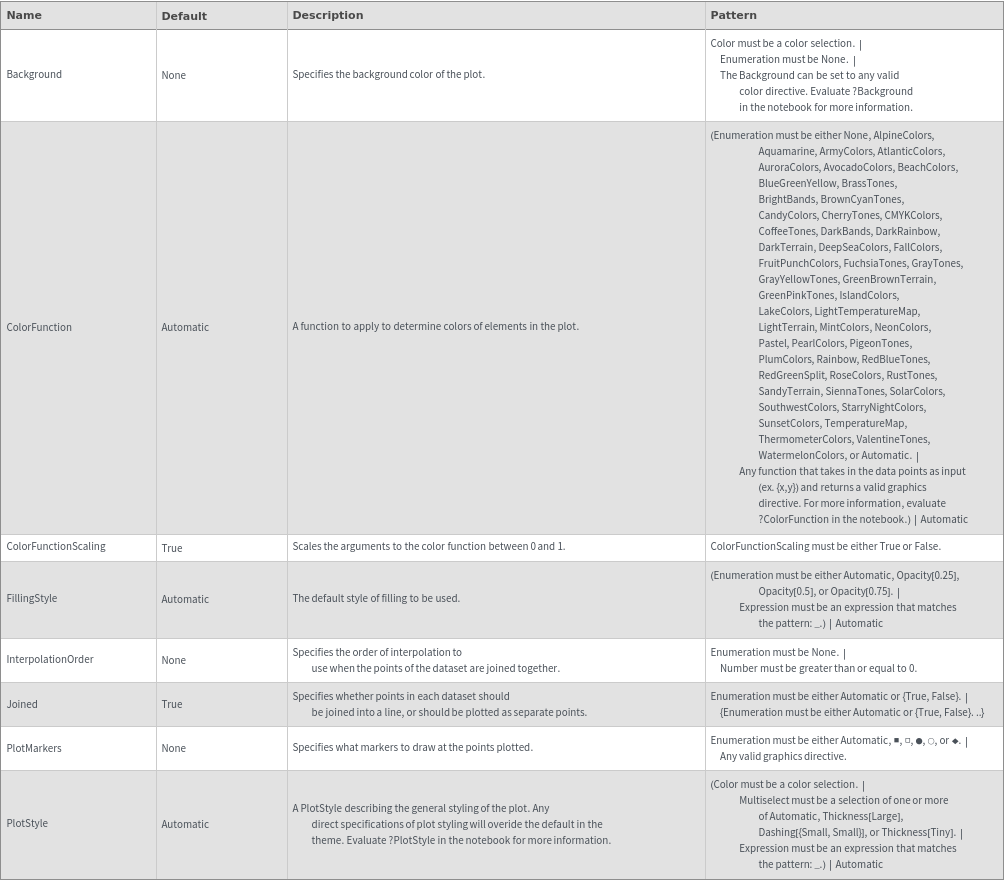
Plot Style Options
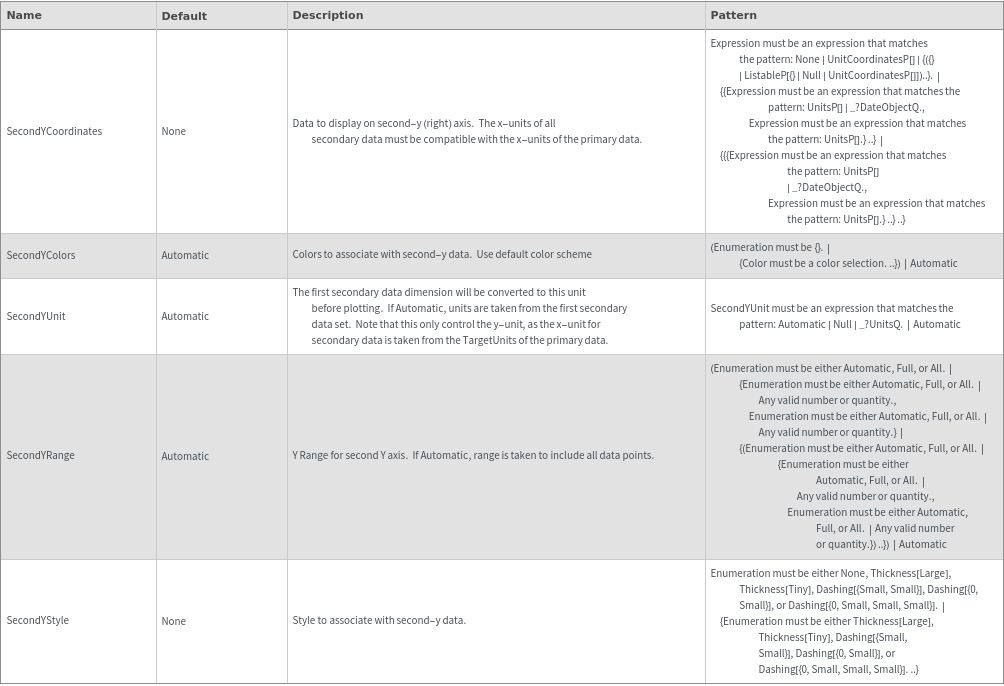
Secondary Data Options
General Options