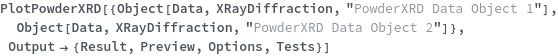
PlotPowderXRD
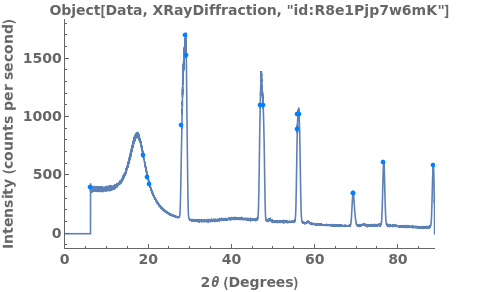
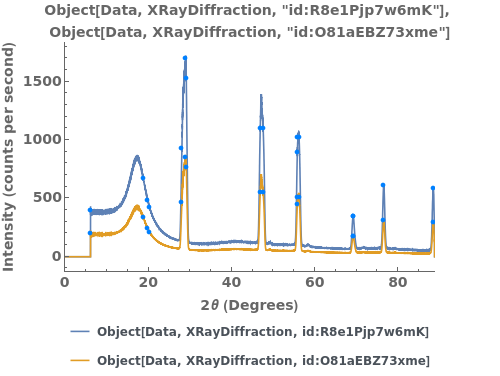
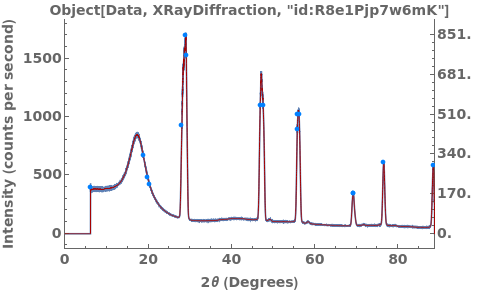
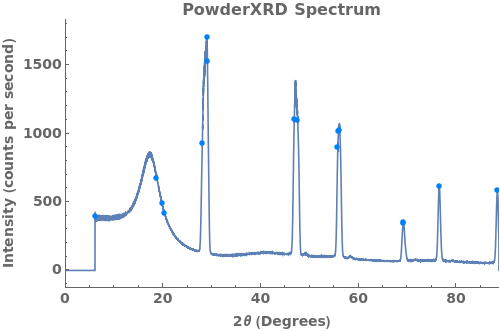
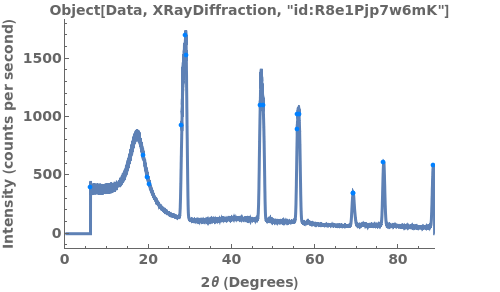
PlotPowderXRD[powderXRDData]⟹plot
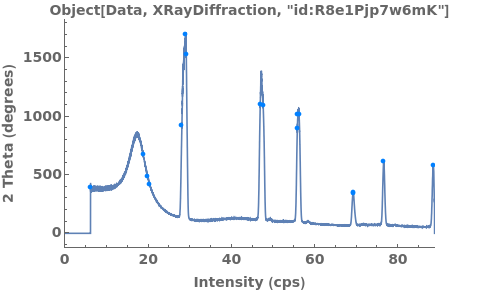
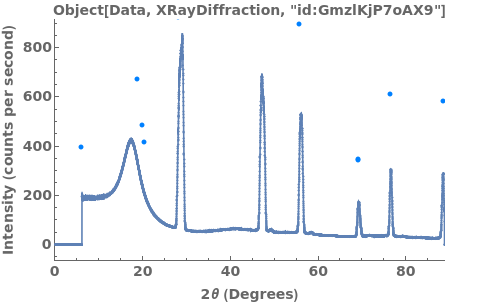
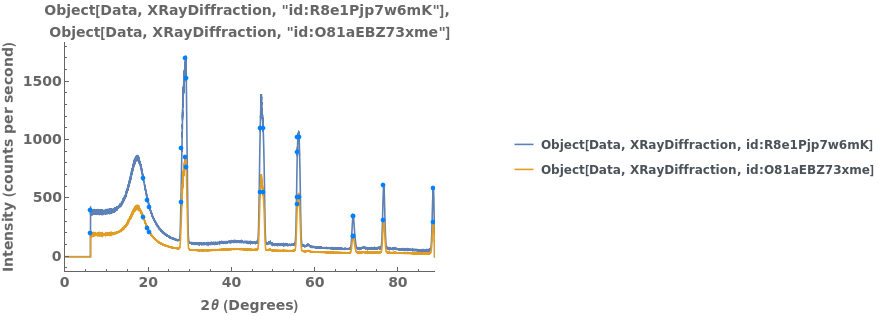
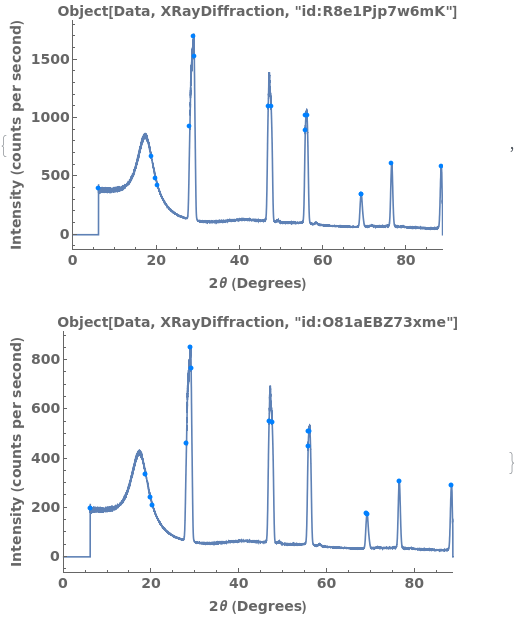
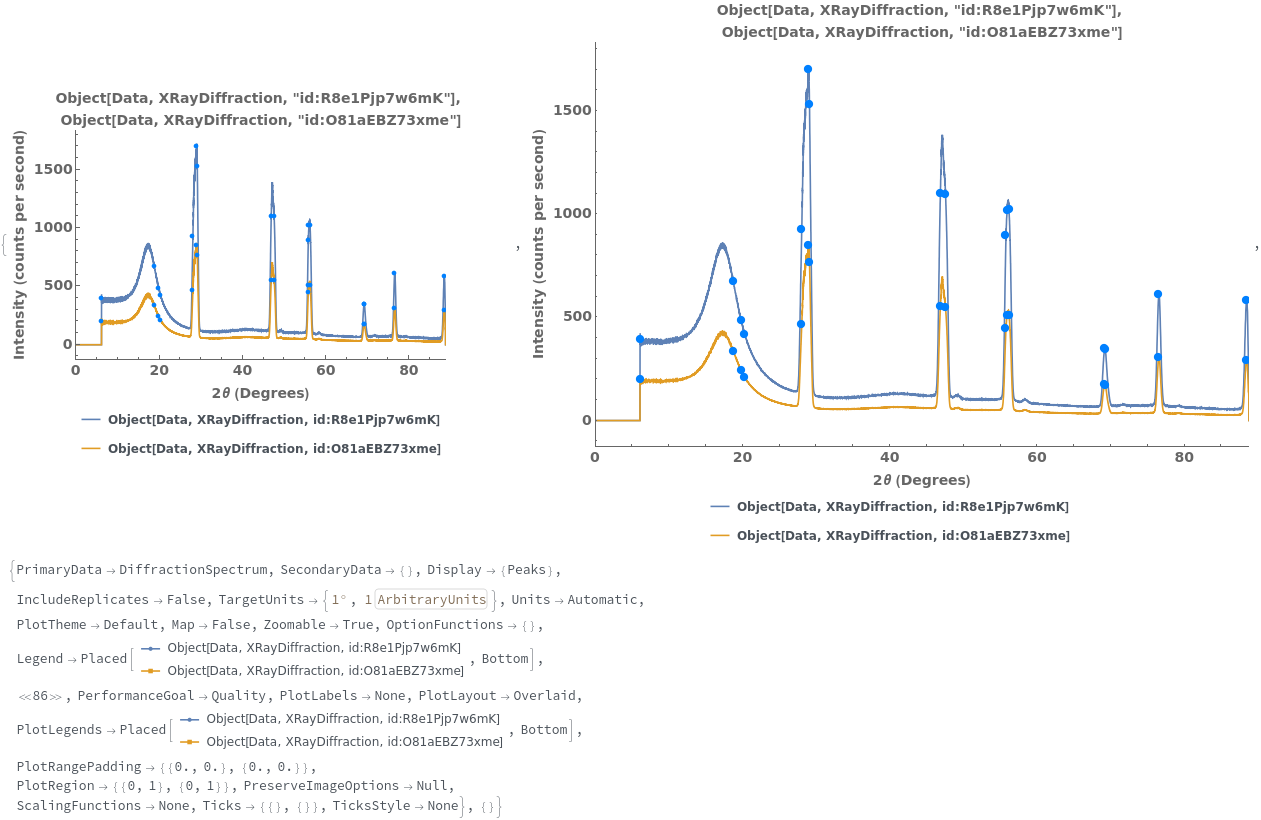
returns a plot of intensity vs 2θ from a supplied powderXRDData object.
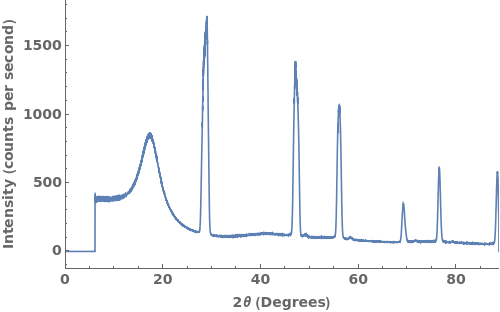
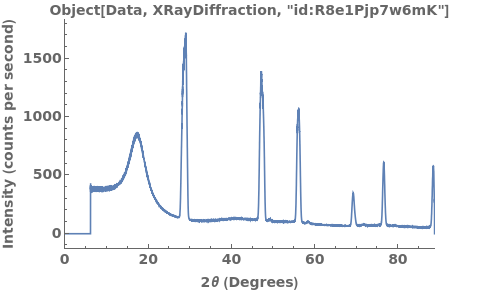
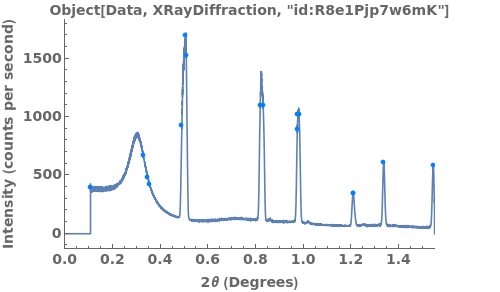
PlotPowderXRD[rawDiffractionData]⟹plot
returns a plot of intensity vs 2θ from a supplied rawDiffractionData value.
Details
Input
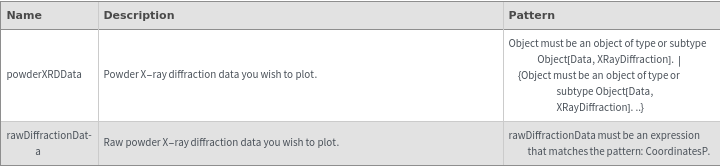
Output

Data Specifications Options
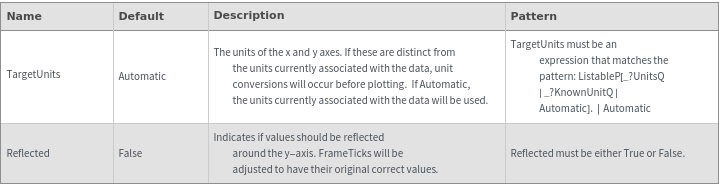
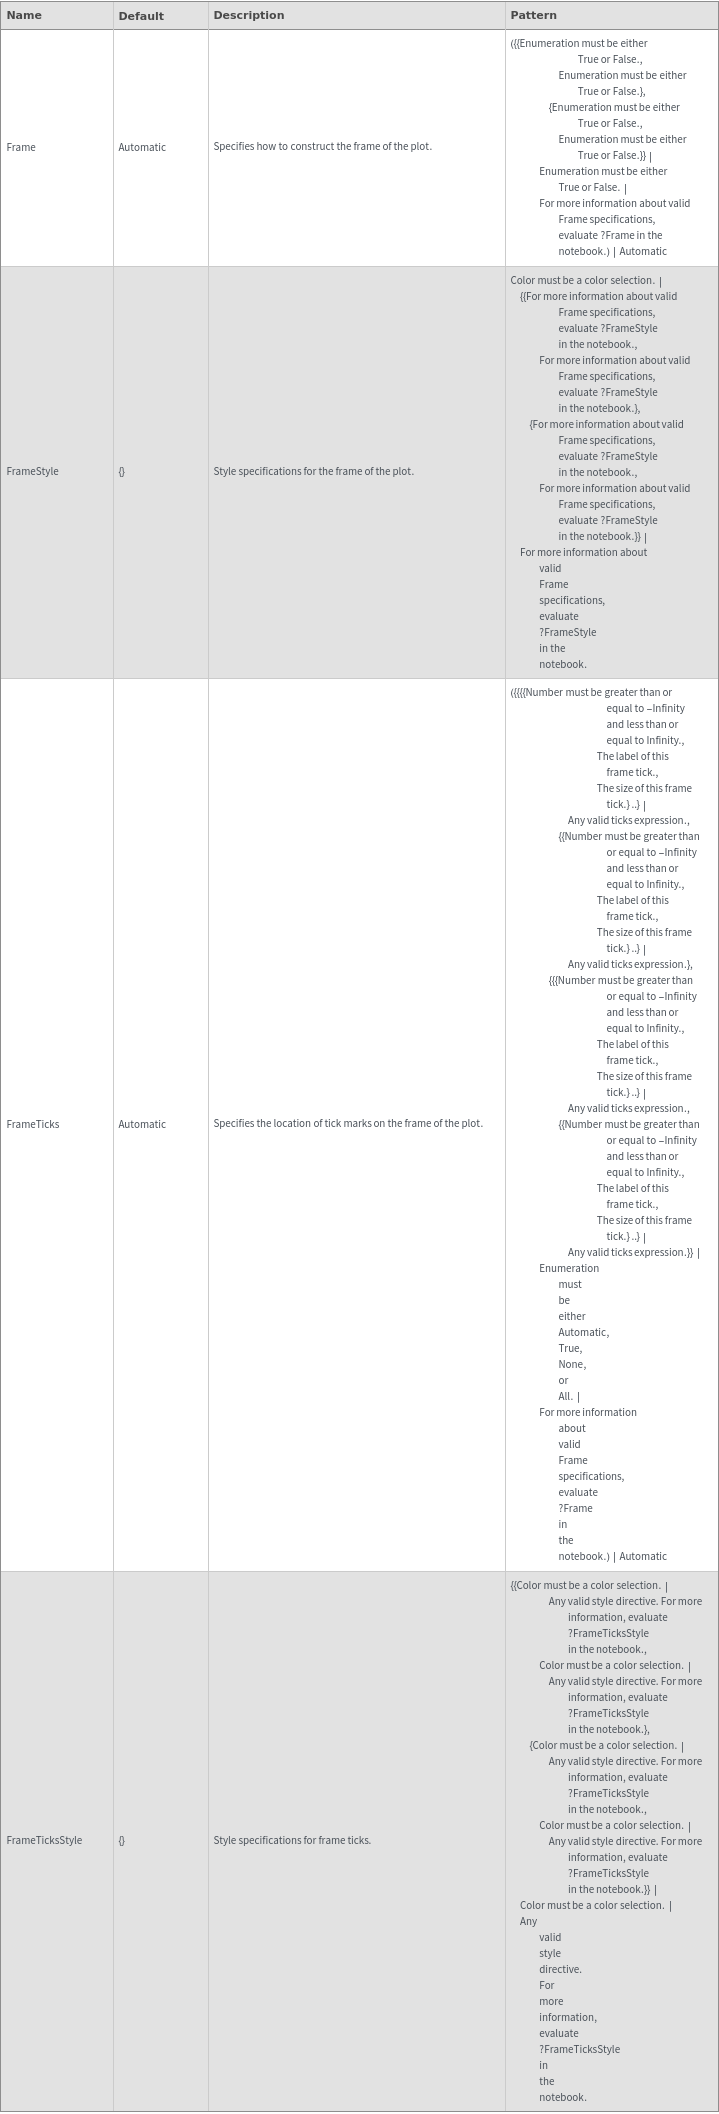
Frame Options
Grid Options
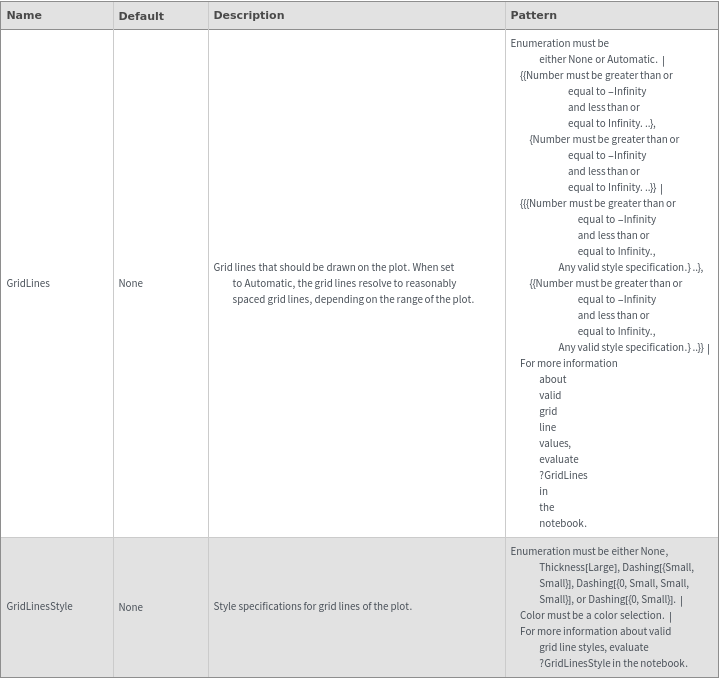
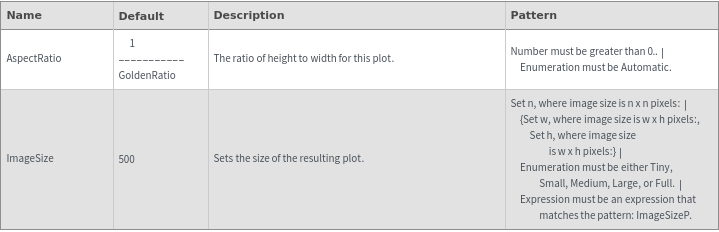
Image Format Options
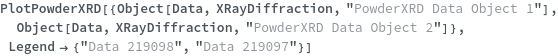
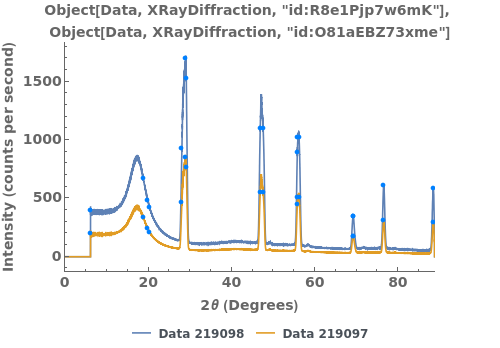
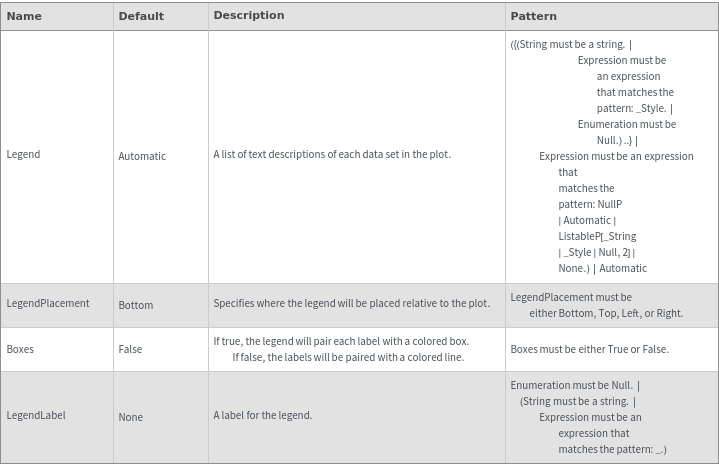
Legend Options
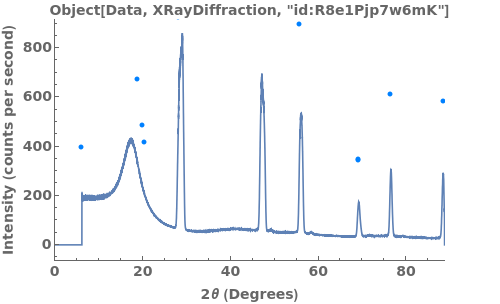
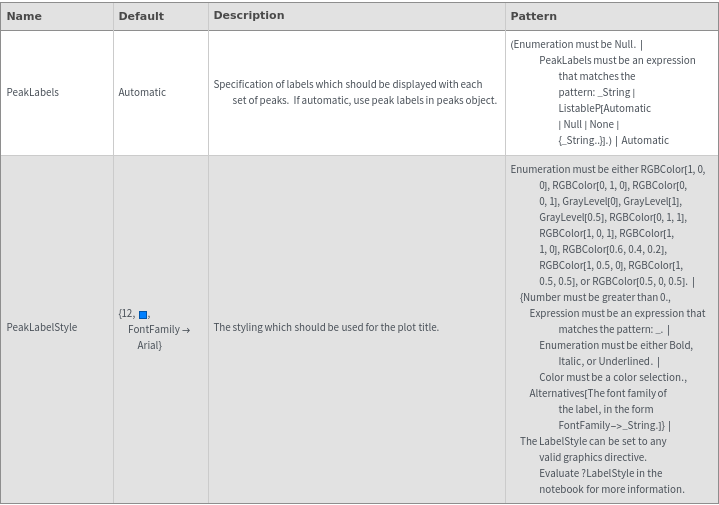
Peaks Options
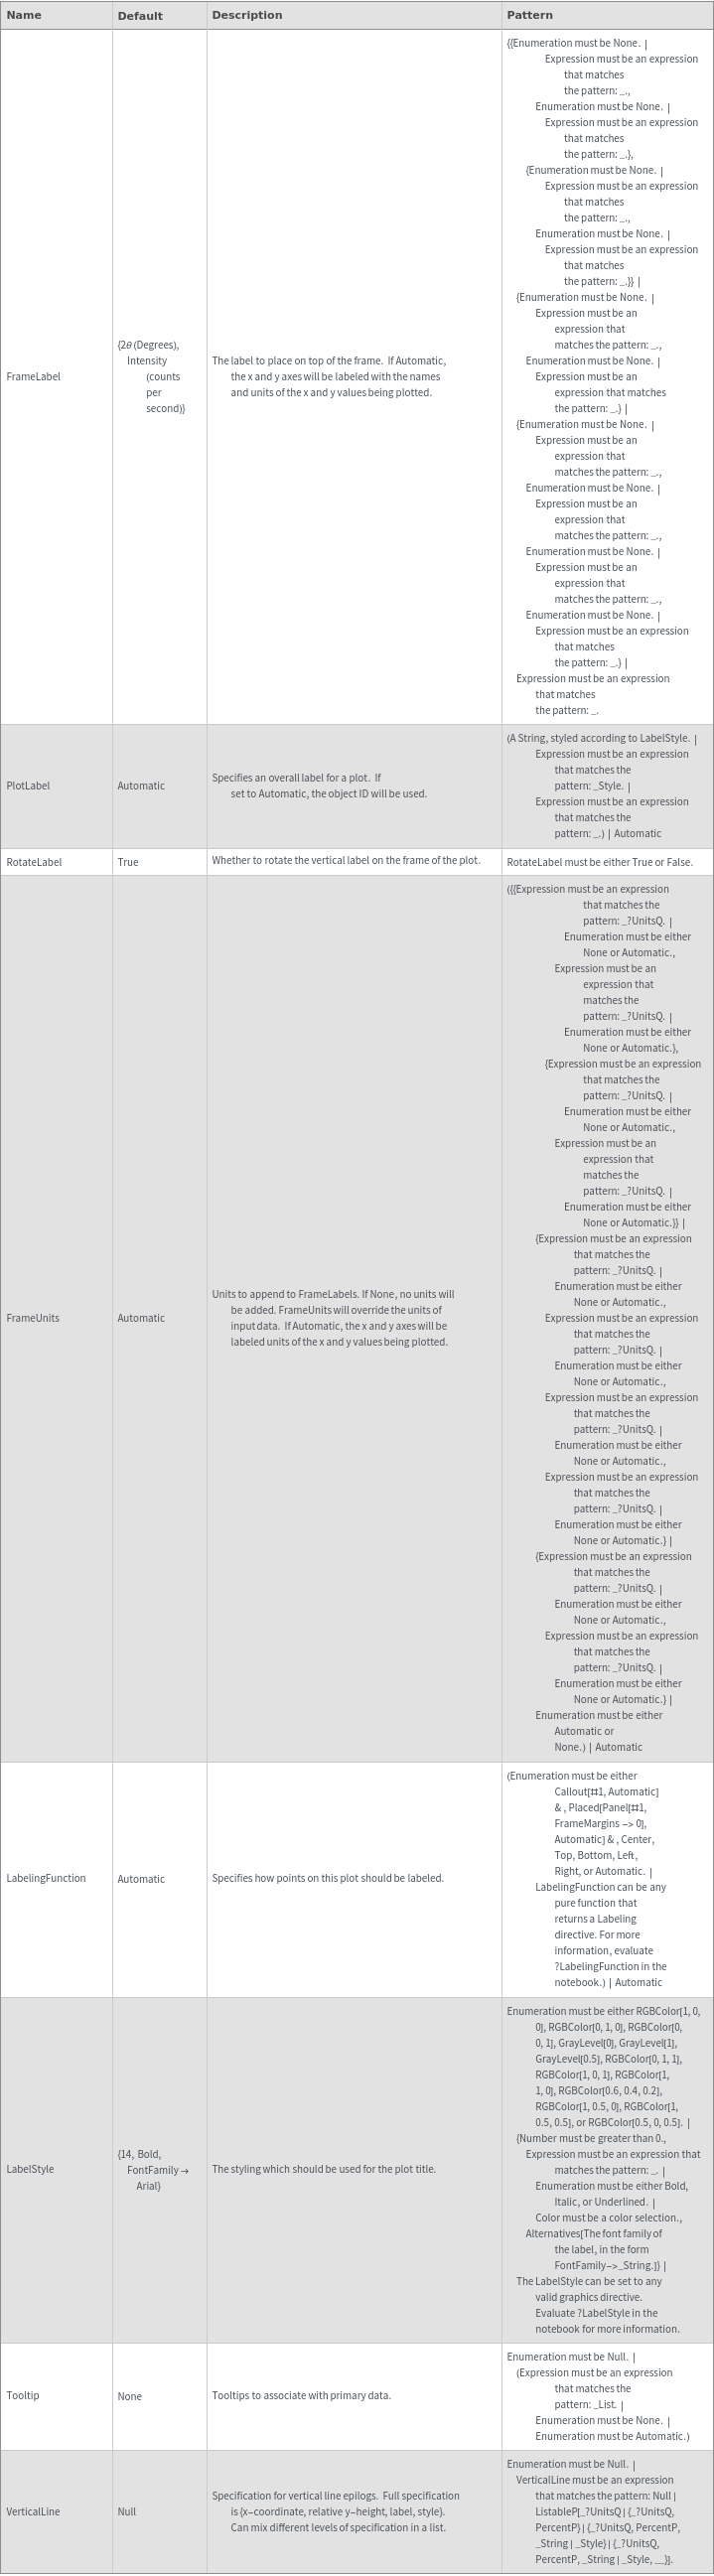
Plot Labeling Options
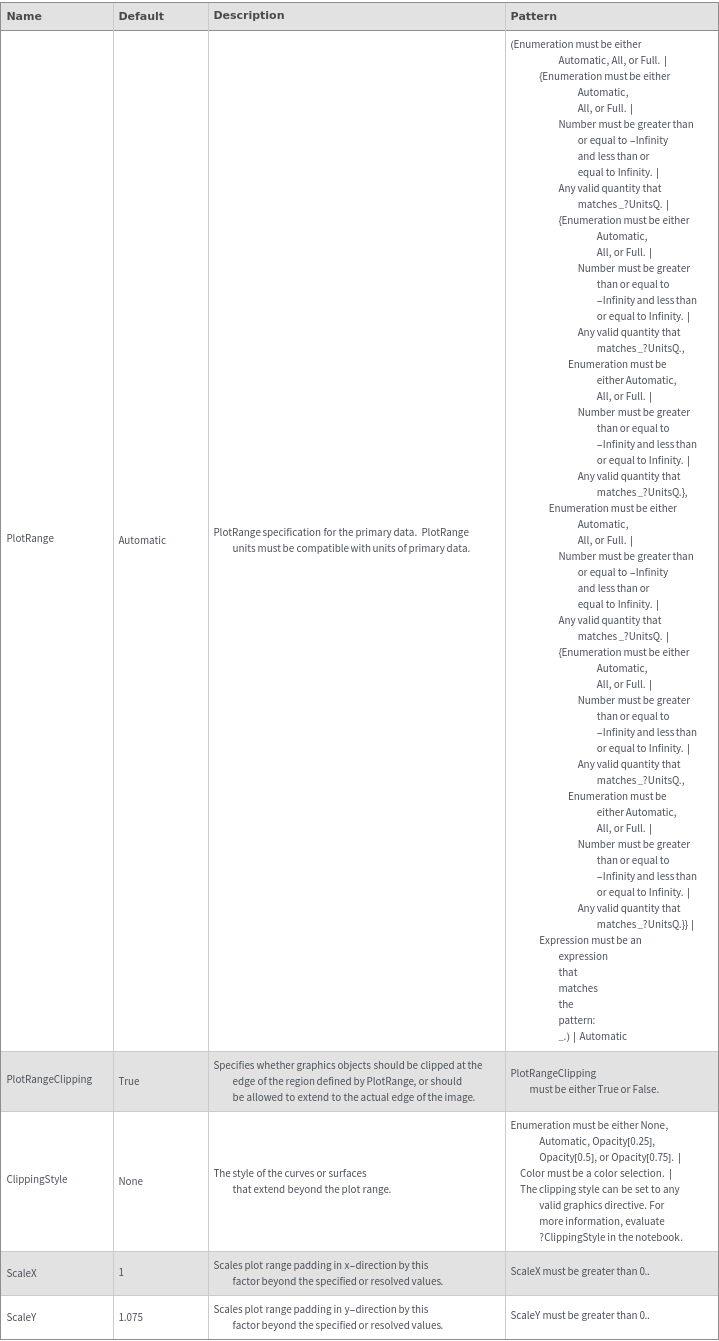
Plot Range Options
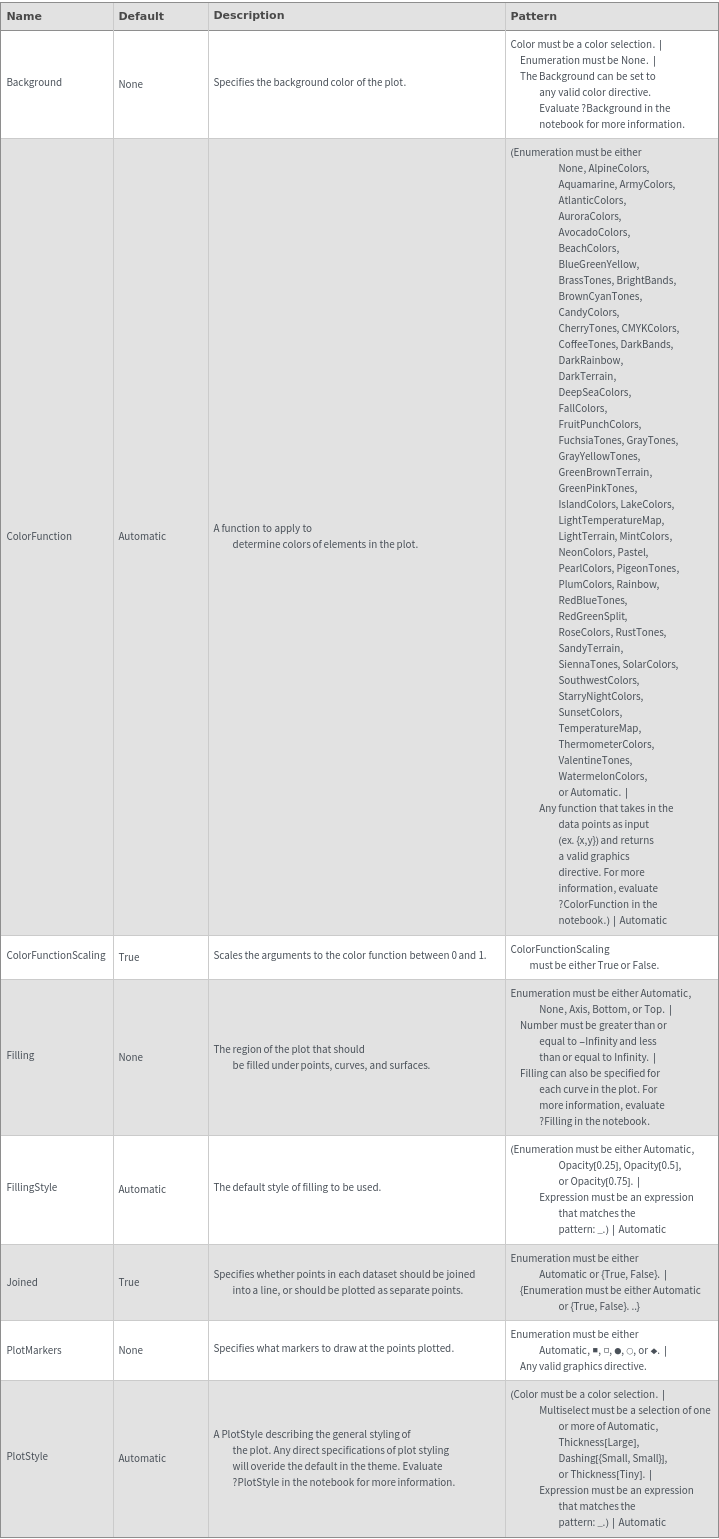
Plot Style Options
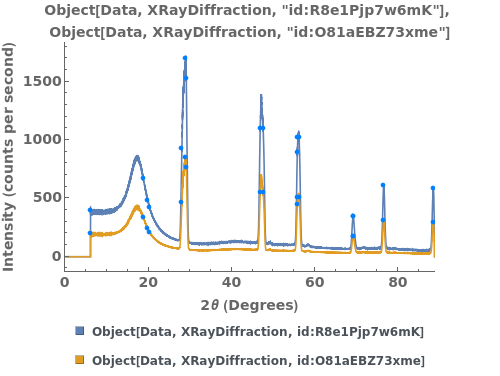
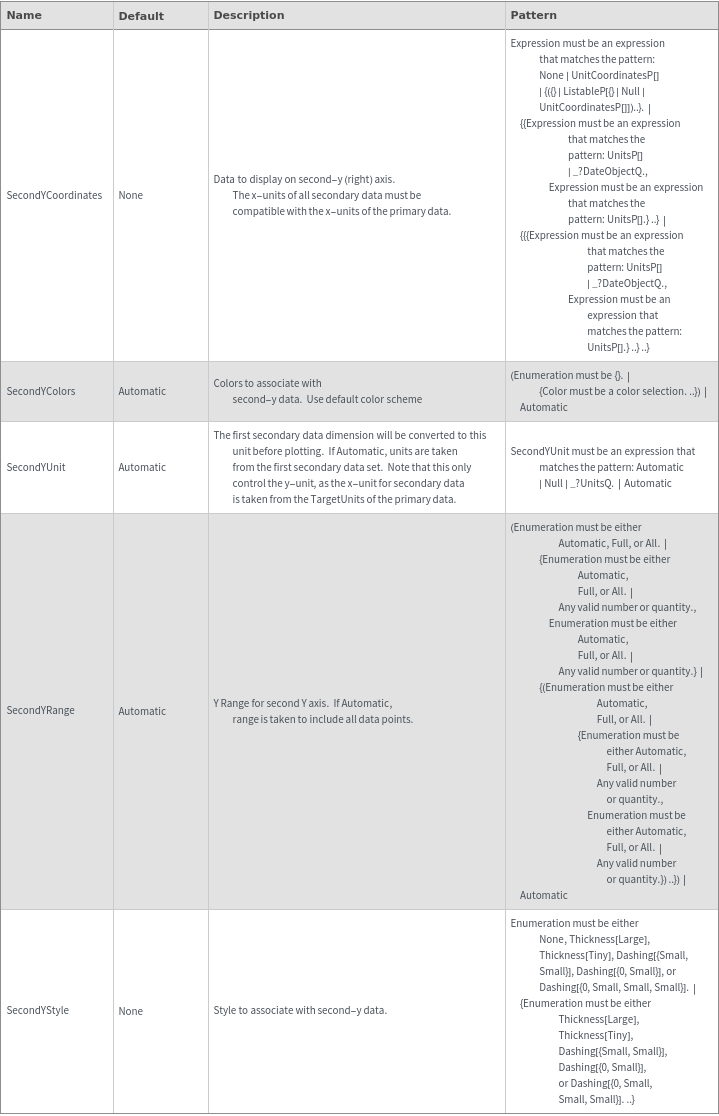
Secondary Data Options
General Options