PlotRamanSpectroscopy
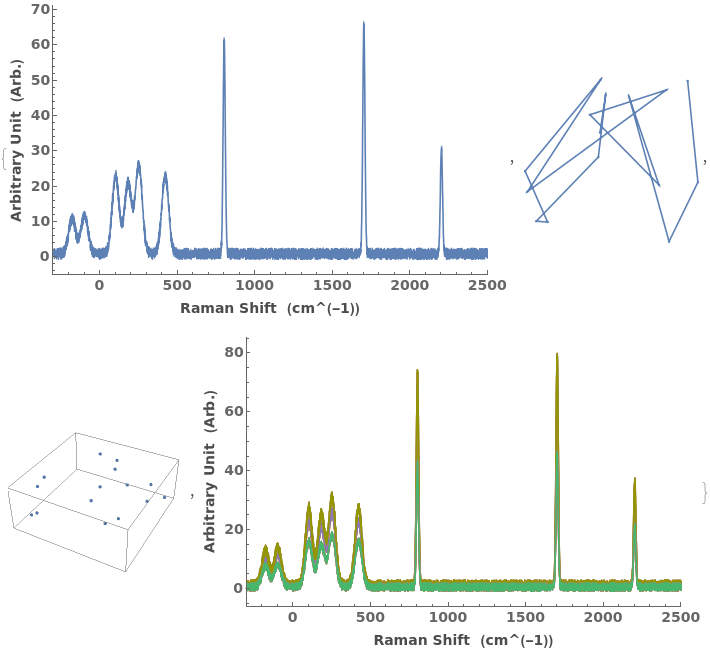
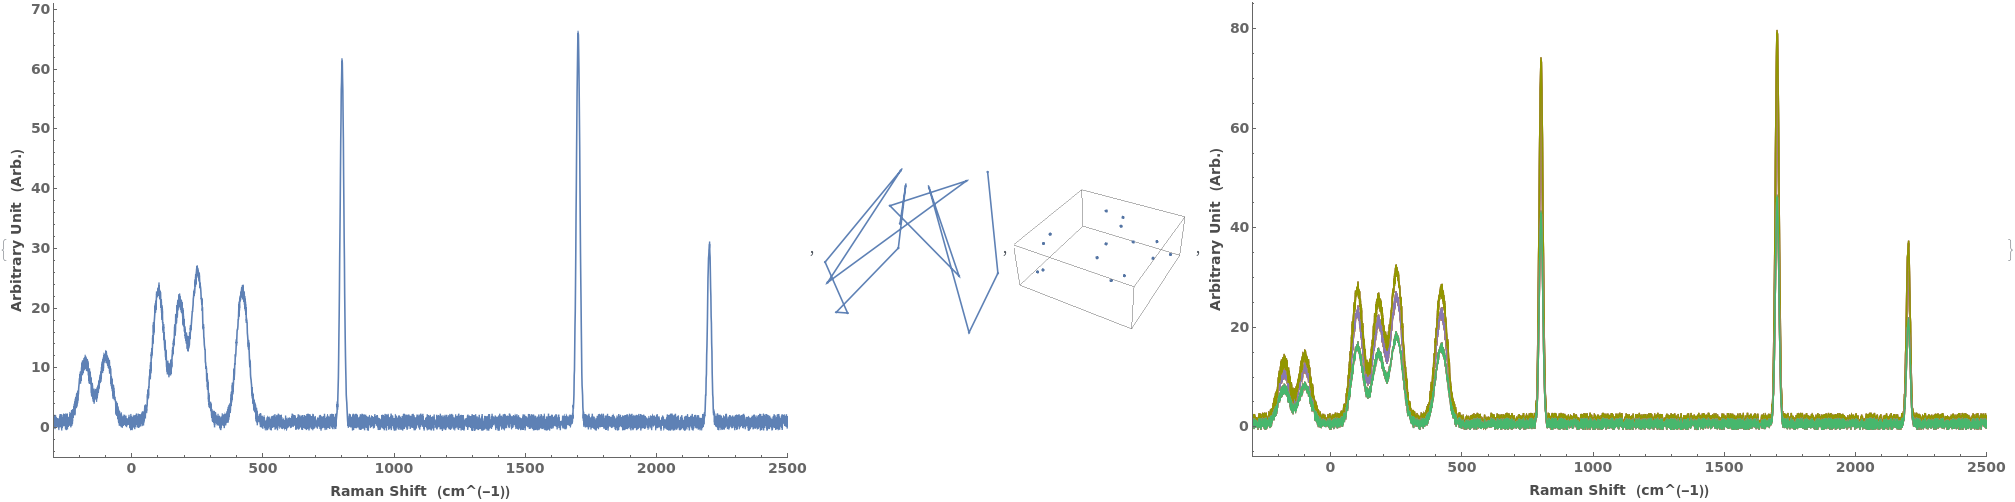
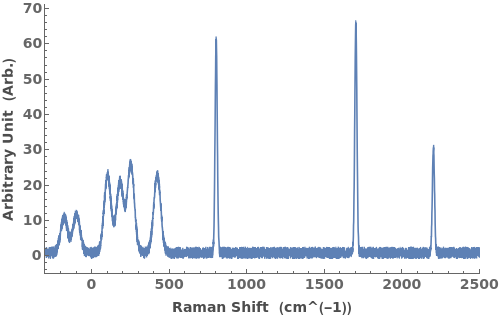
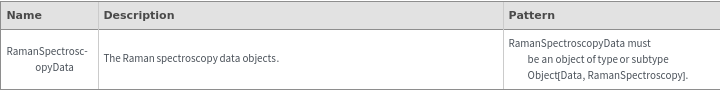
PlotRamanSpectroscopy[RamanSpectroscopyData]⟹fig
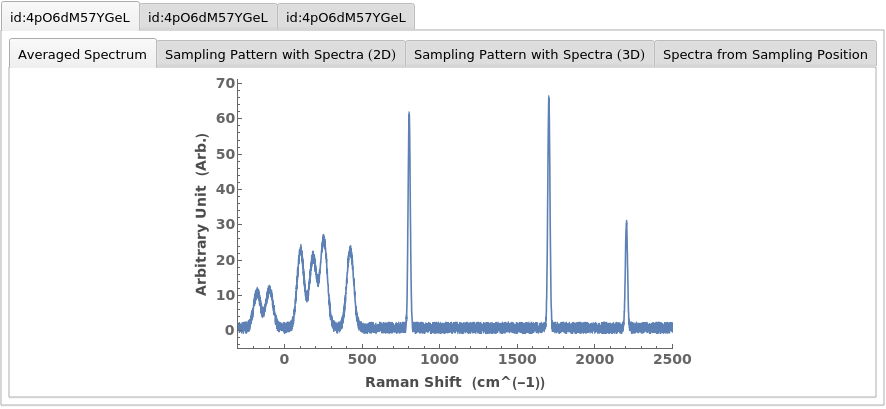
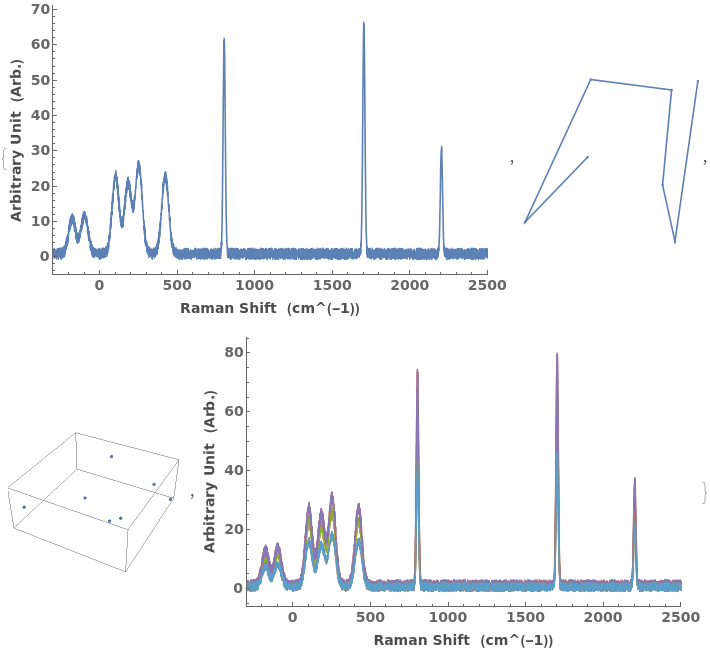
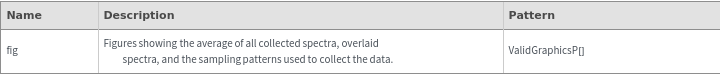
plots the average collected Raman spectrum, Raman spectra from each sampling point, and the sampling pattern for RamanSpectroscopyData.
Details
- For each RamanSpectroscopy data object the measurement coordinates are displayed as a tooltip for each spectrum, and the spectra are displayed as a tooltip for each measurement position.
Input
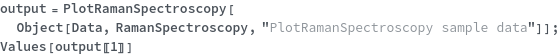
Output
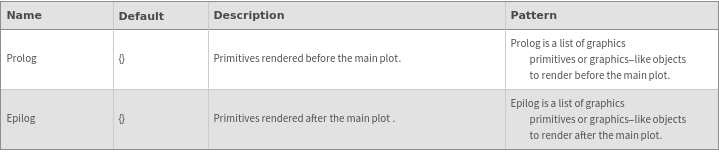
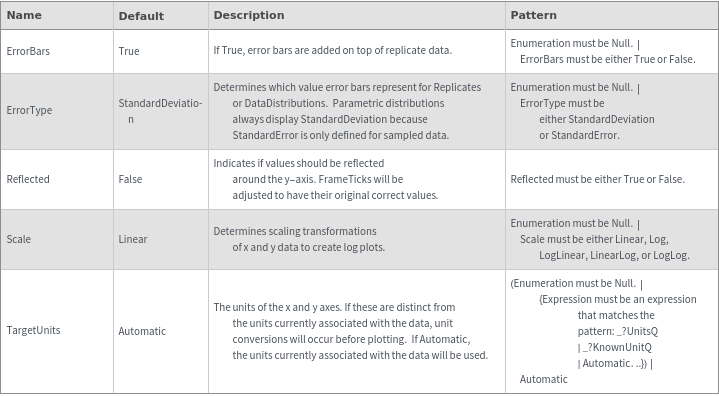
Data Specifications Options
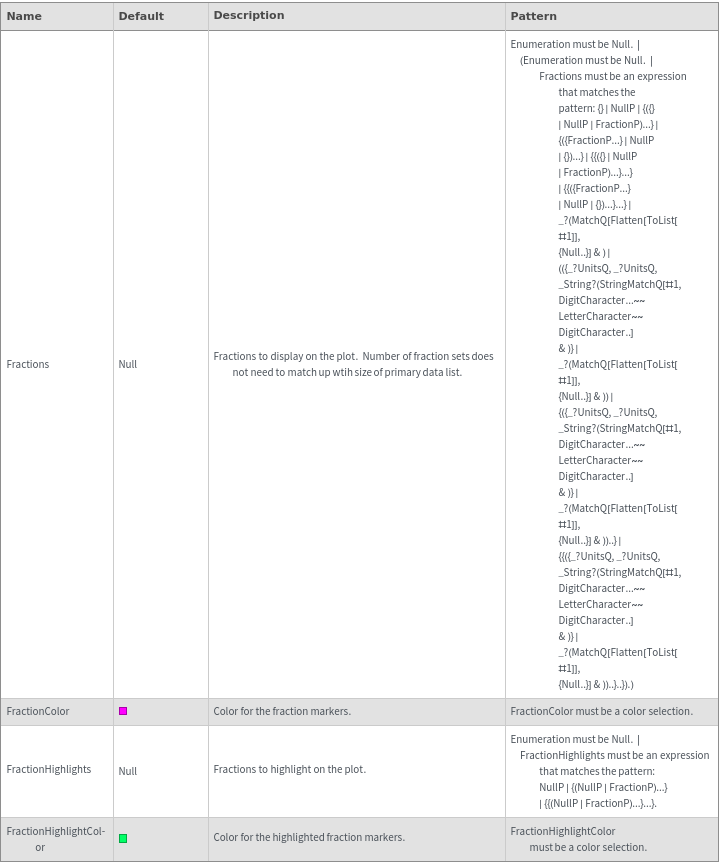
Fractions Options
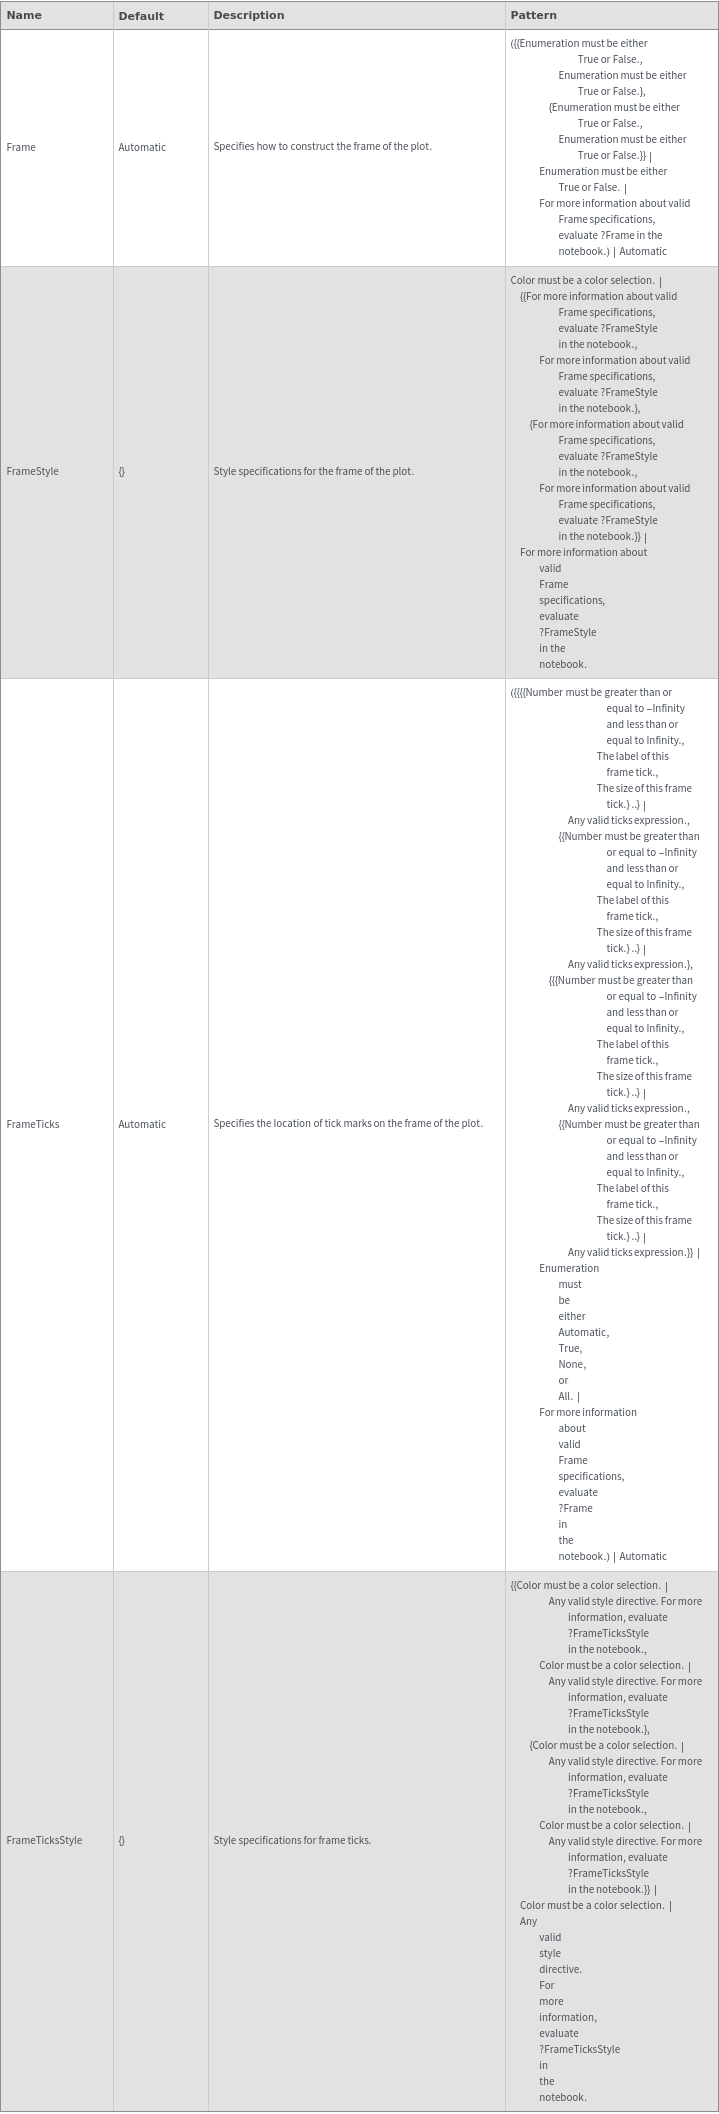
Frame Options
Grid Options
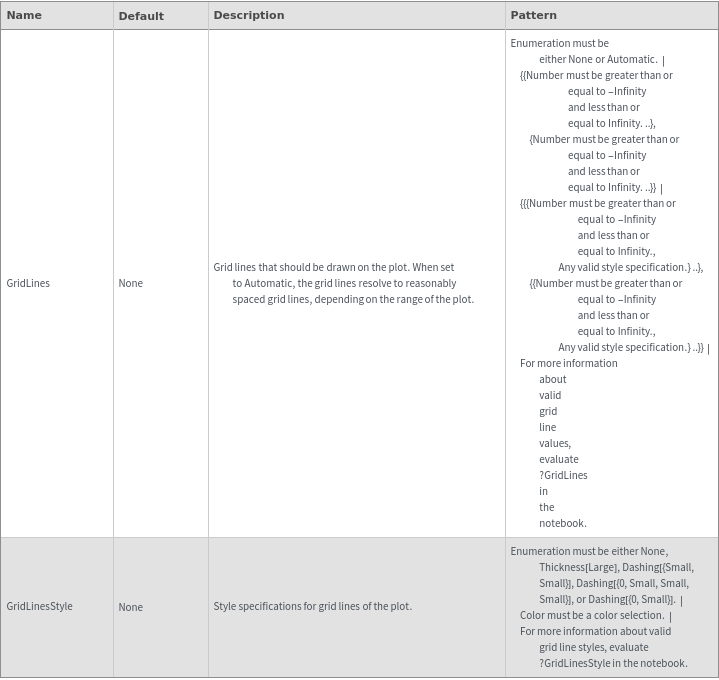
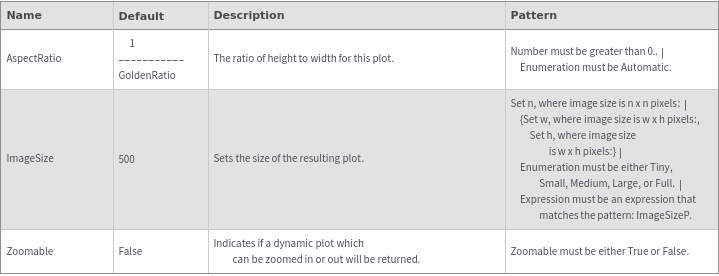
Image Format Options
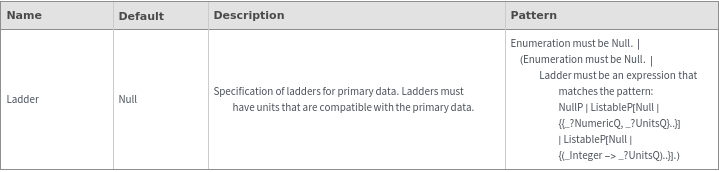
Ladder Options
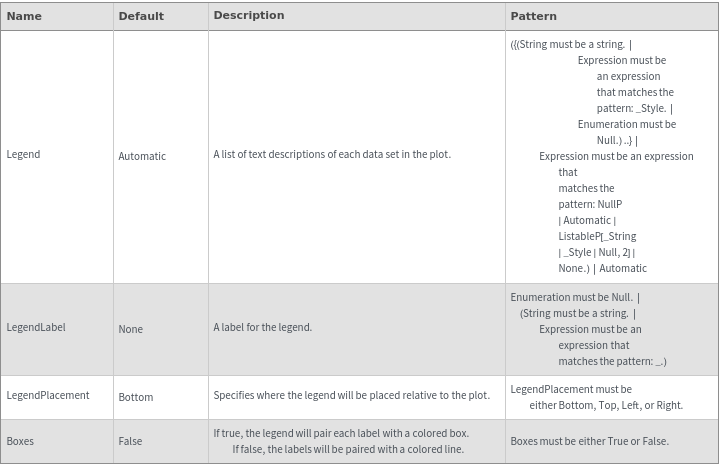
Legend Options
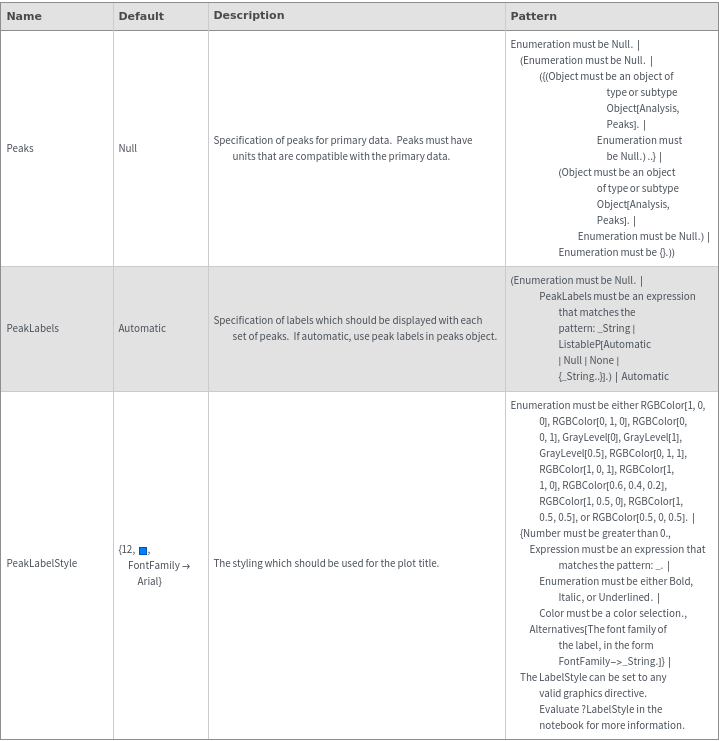
Peaks Options
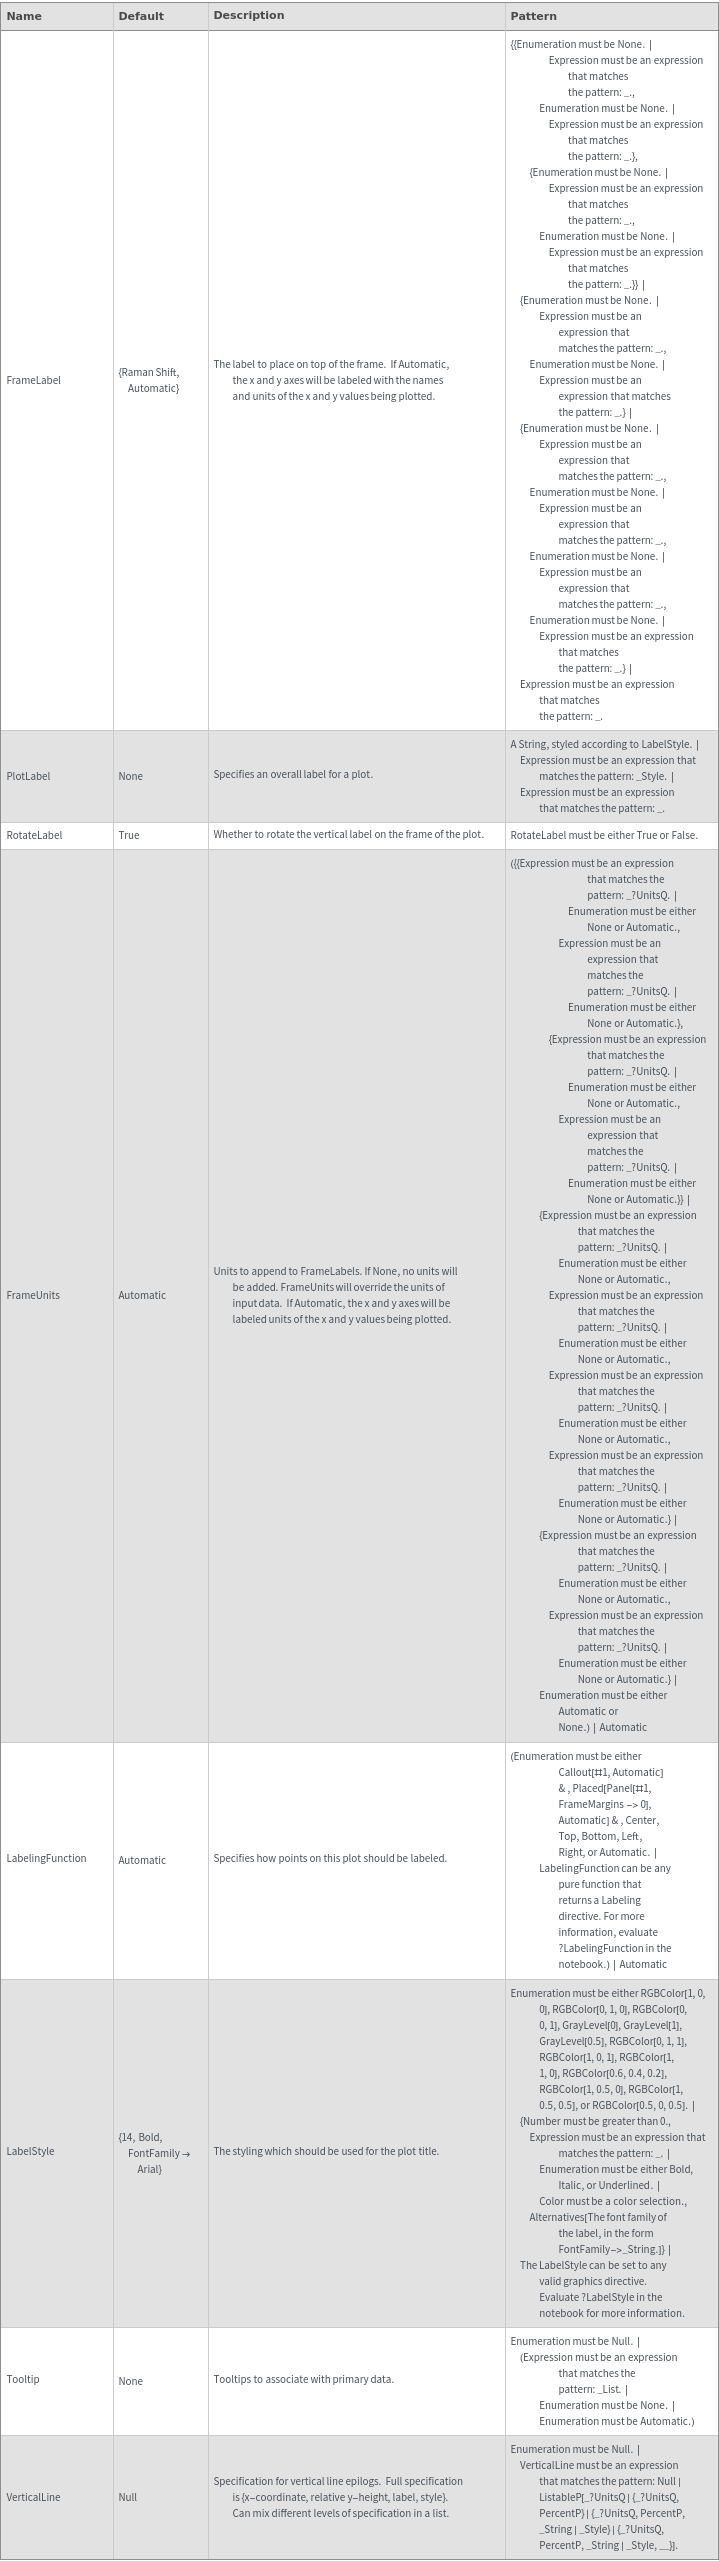
Plot Labeling Options
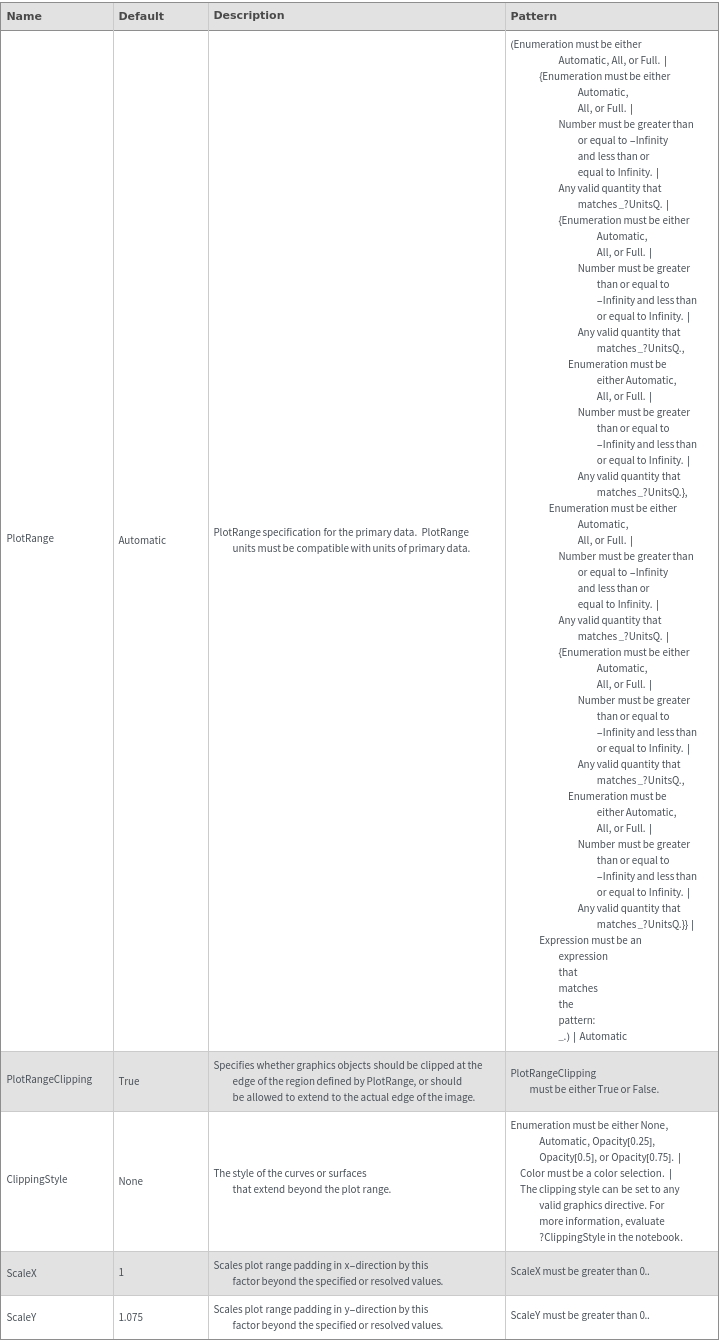
Plot Range Options
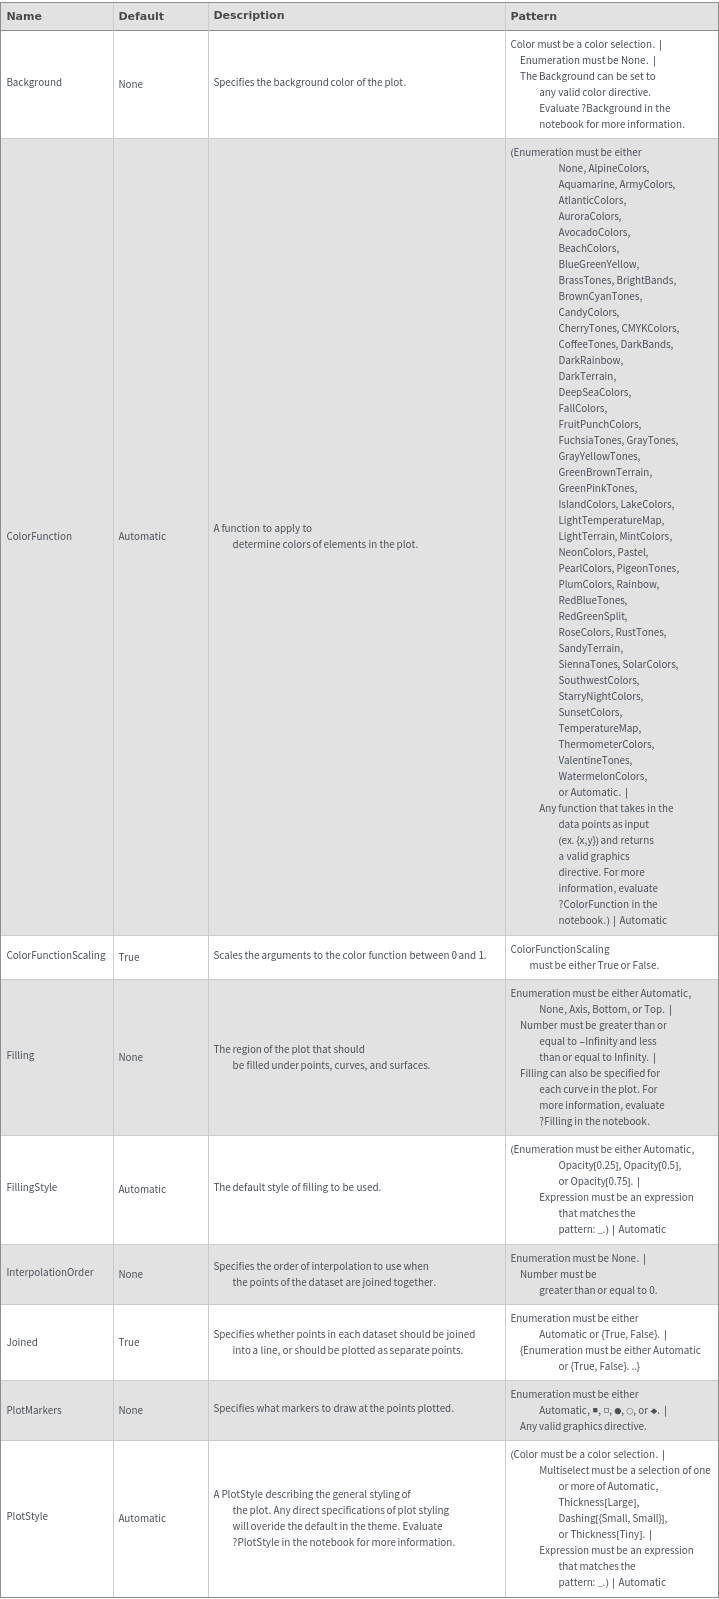
Plot Style Options
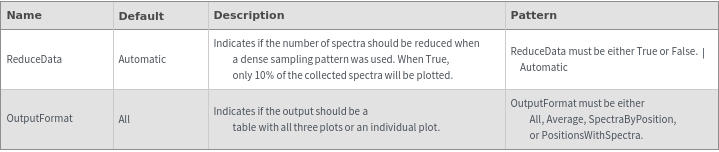
Raman Options
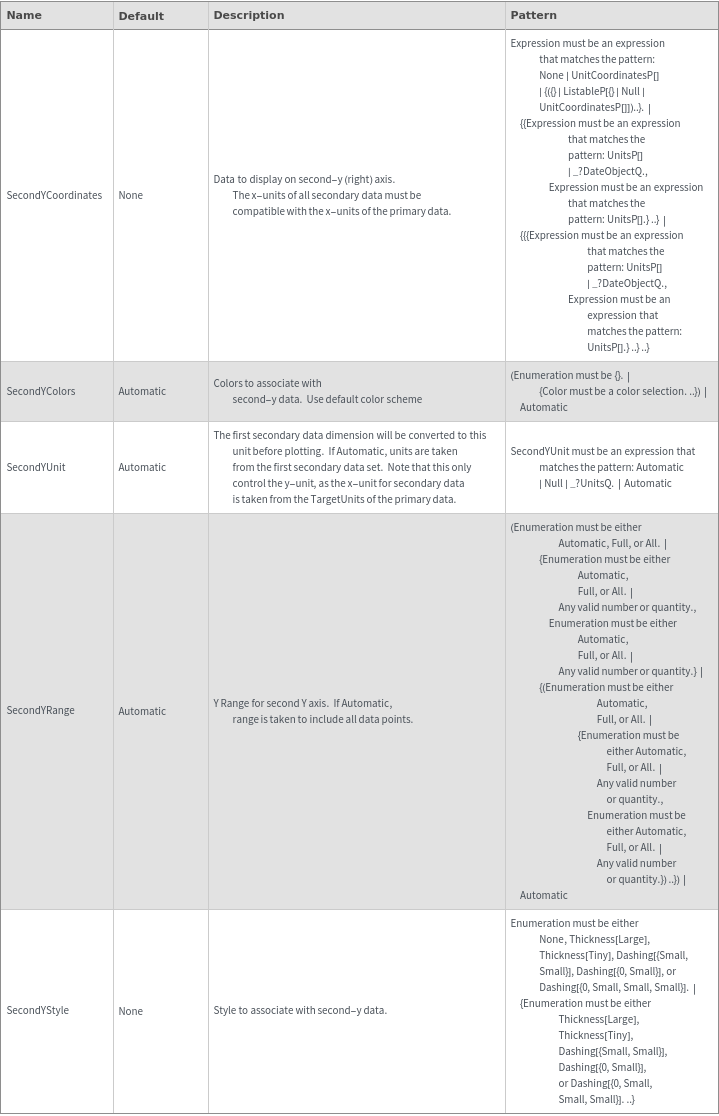
Secondary Data Options
General Options