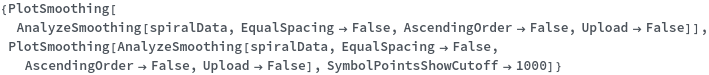
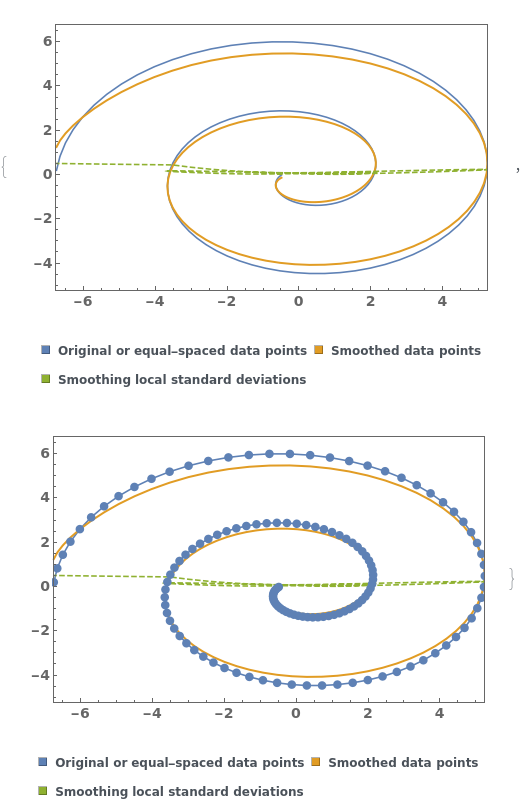
PlotSmoothing
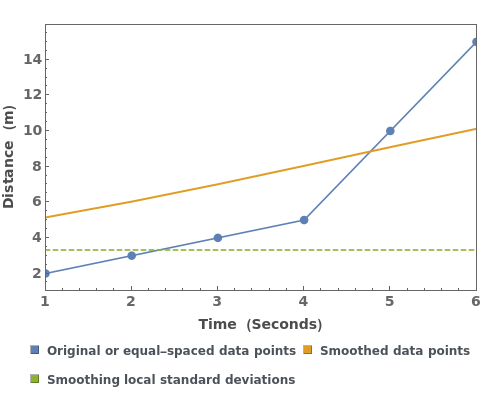
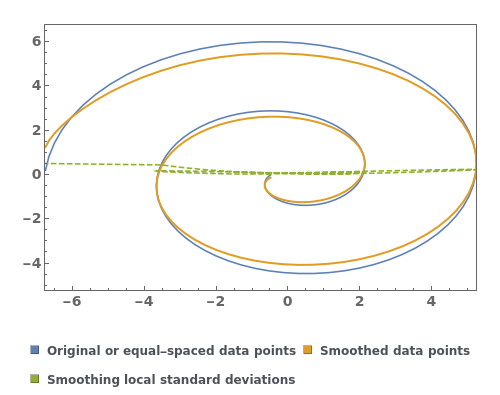
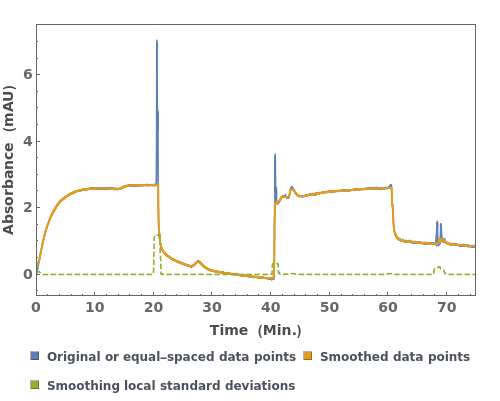
PlotSmoothing[smoothingObject]⟹plot
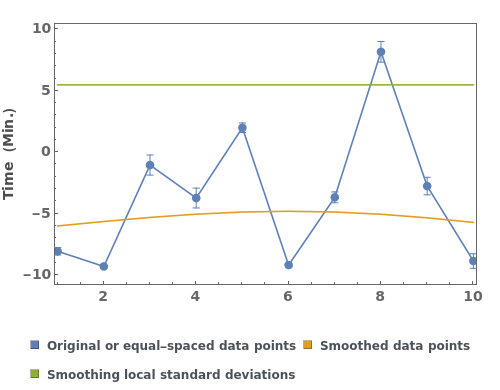
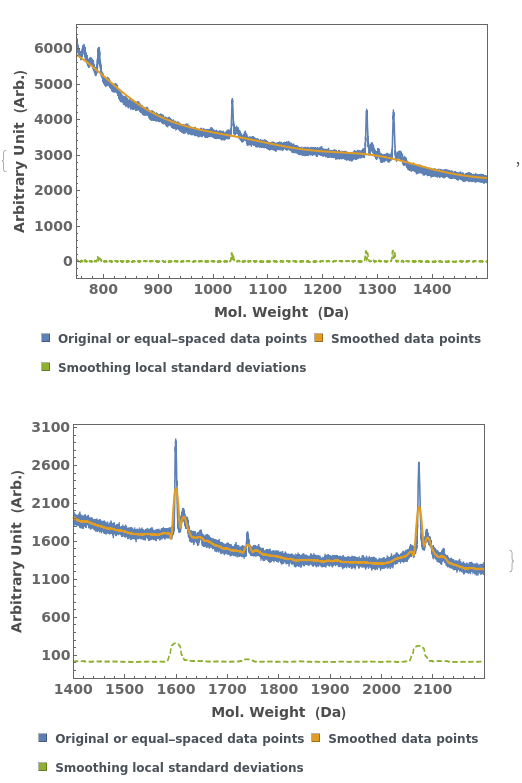
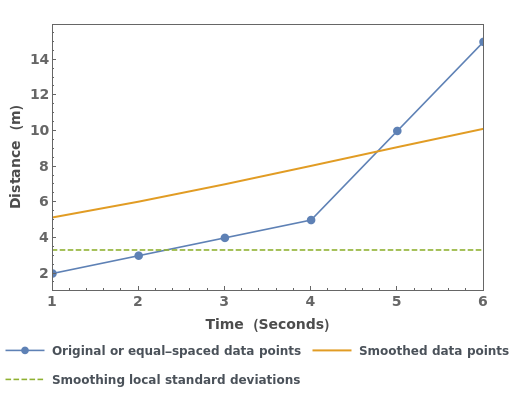
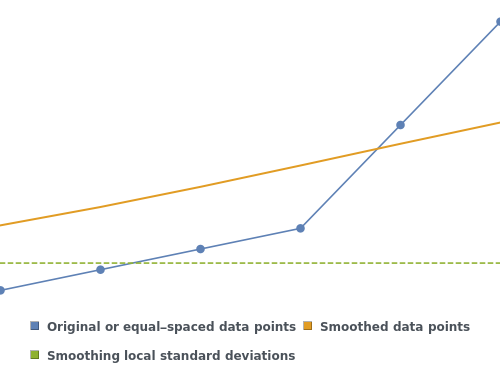
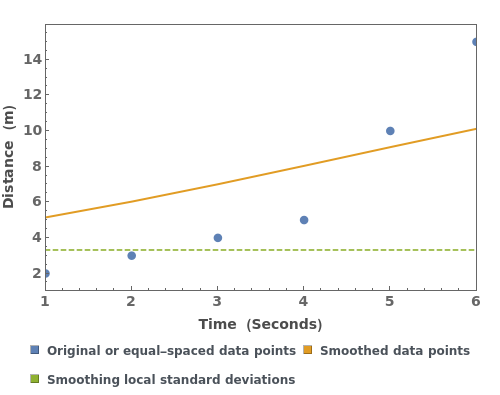
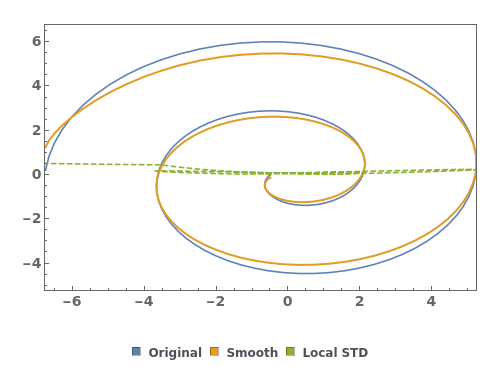
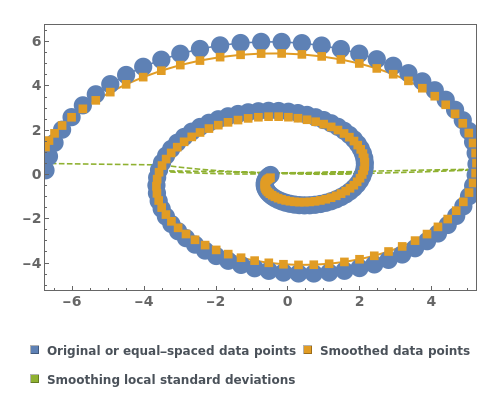
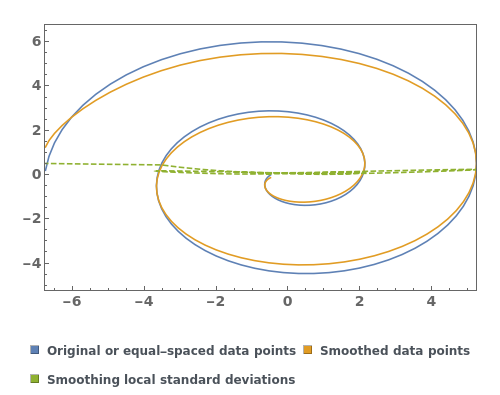
this function plots the curves available in smoothingObject which contains curves that are used for smoothing analysis overlaid with the smoothed curves and the local standard deviation of smoothed and original curve difference.
Details
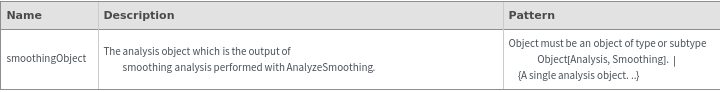
Input
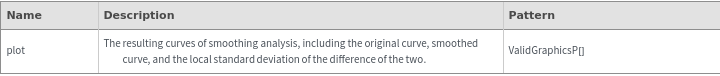
Output
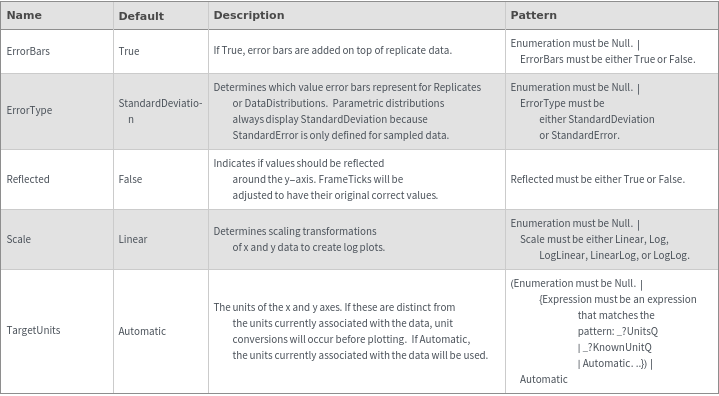
Data Specifications Options
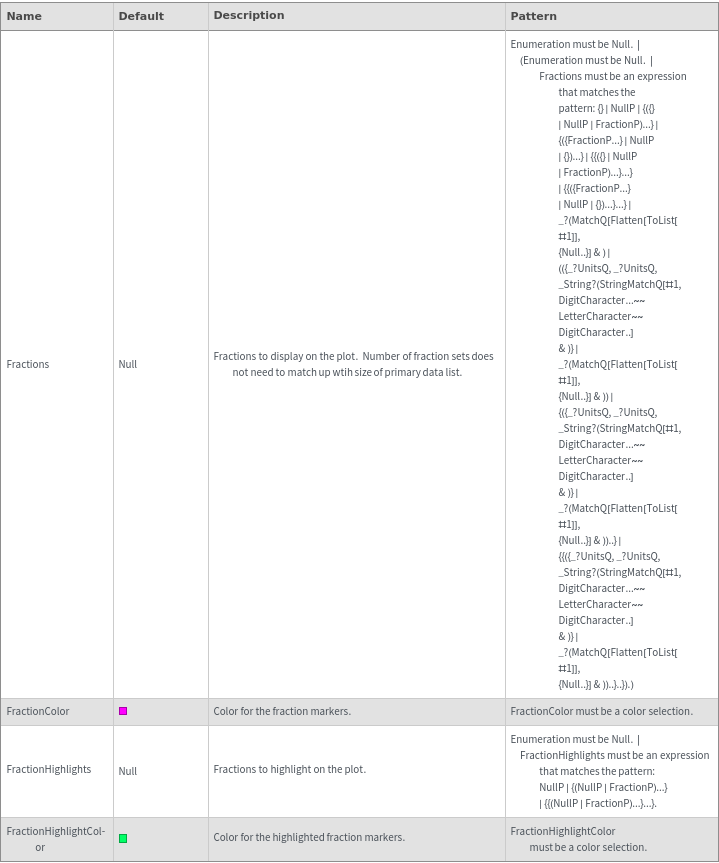
Fractions Options
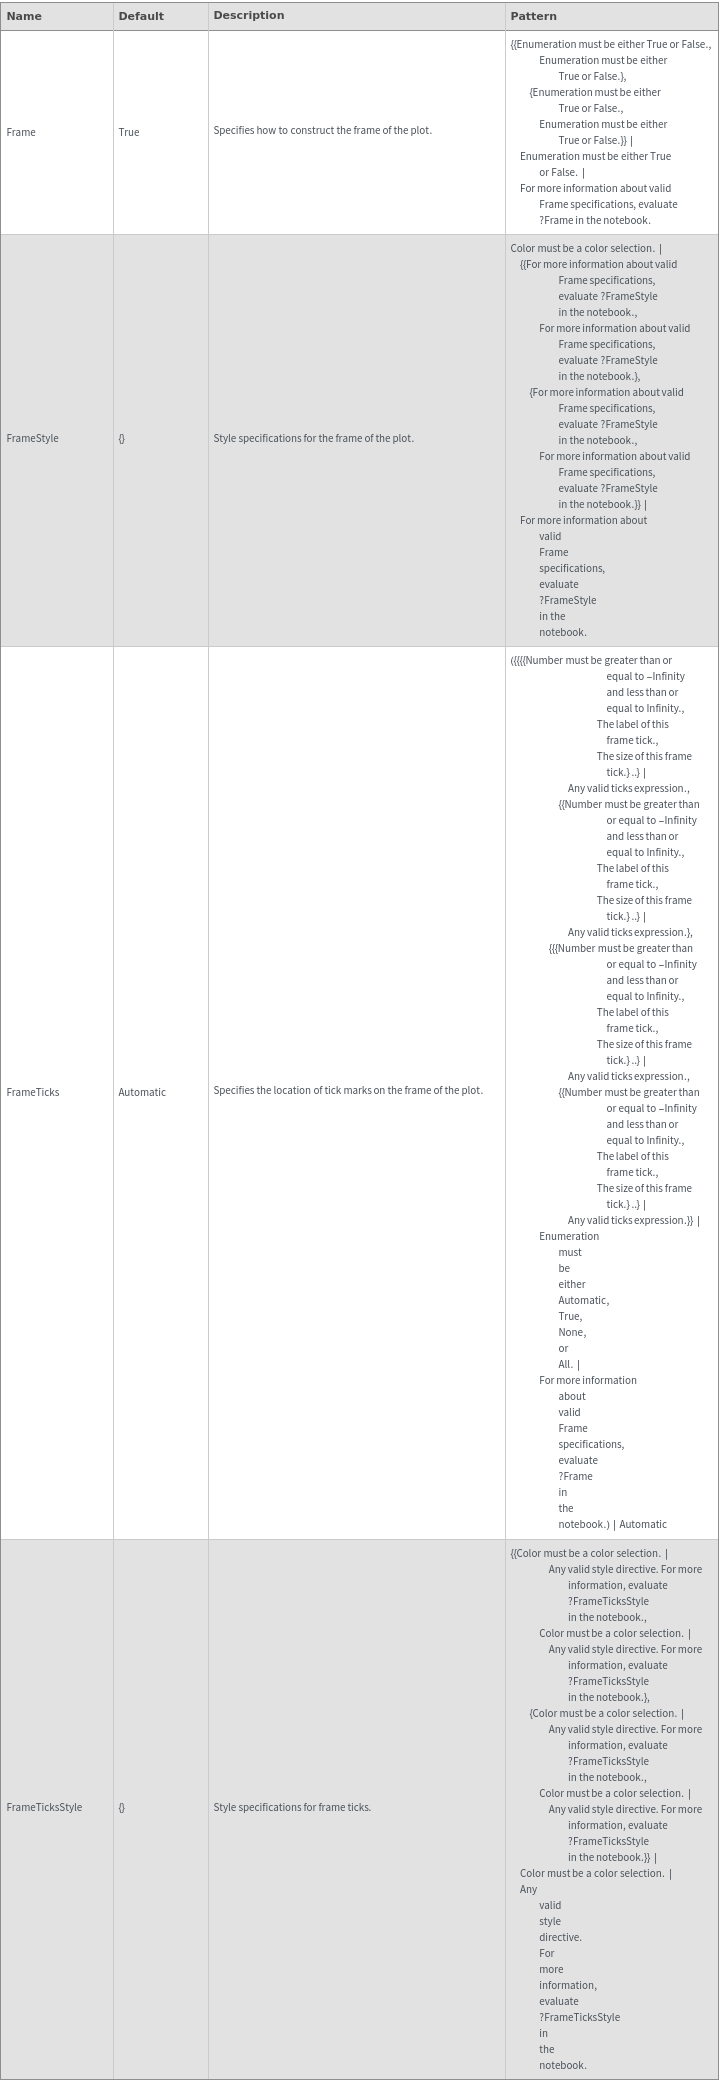
Frame Options
Grid Options
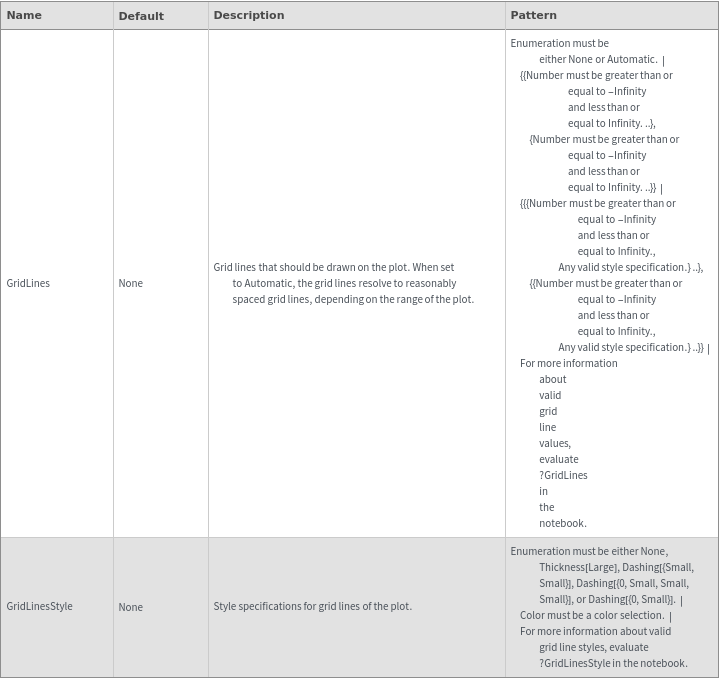
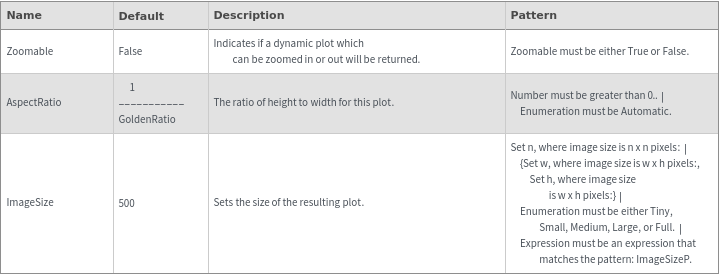
Image Format Options
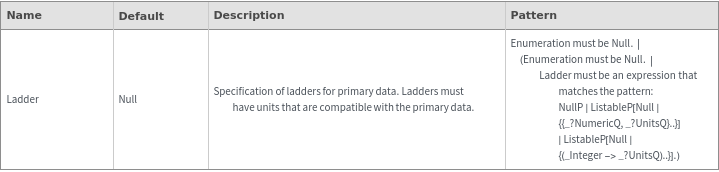
Ladder Options
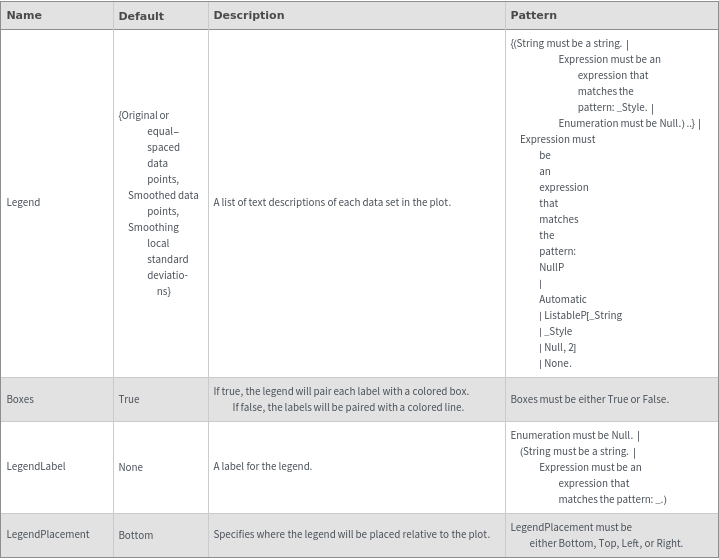
Legend Options
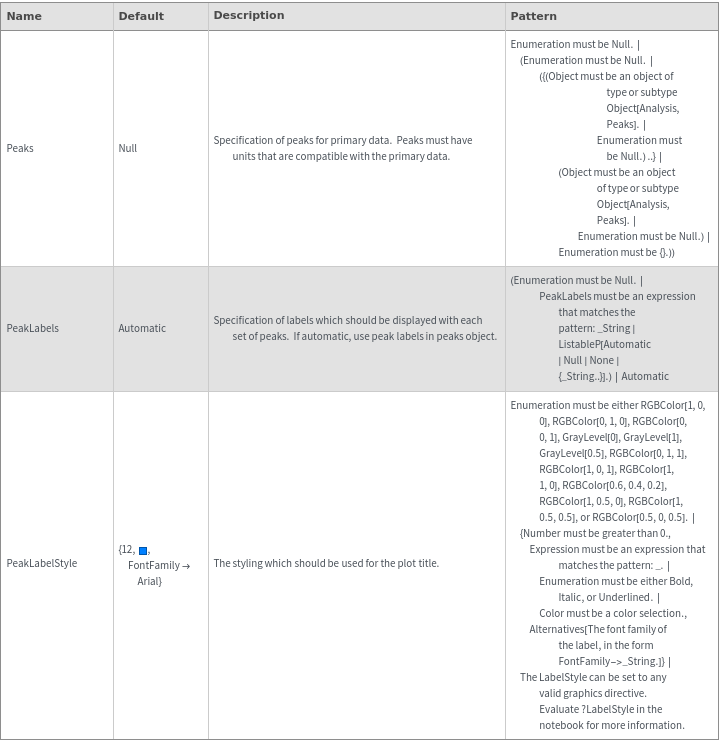
Peaks Options
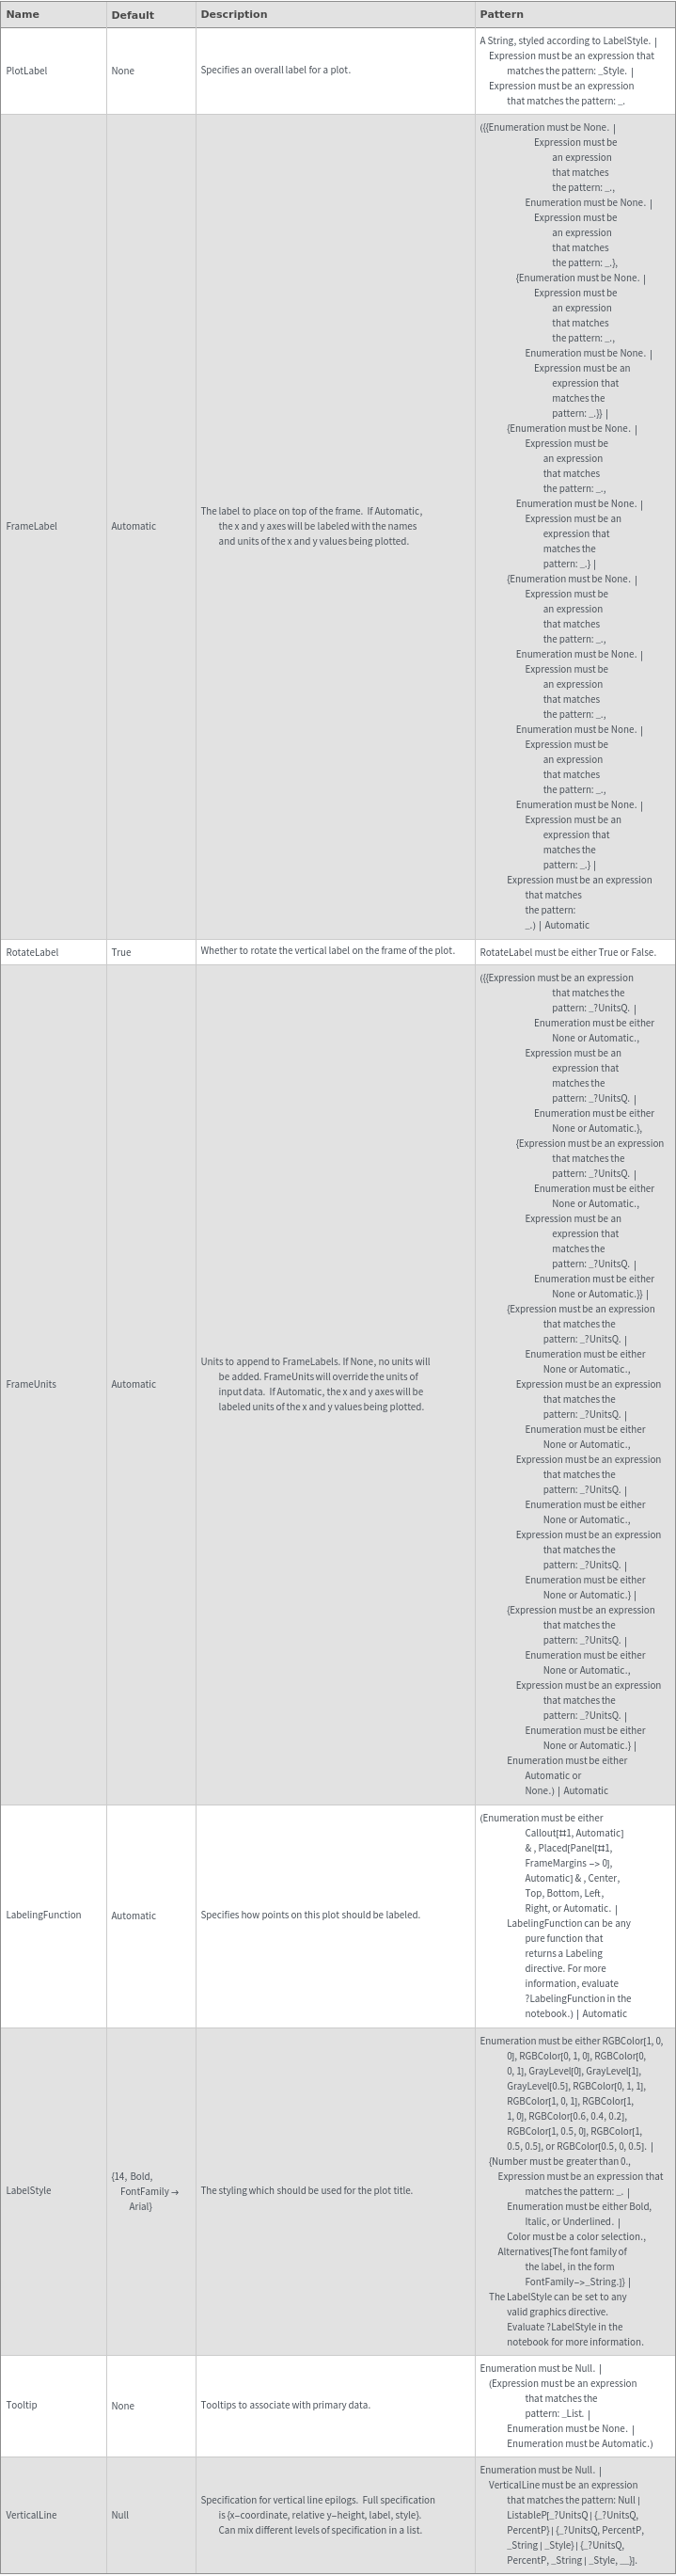
Plot Labeling Options
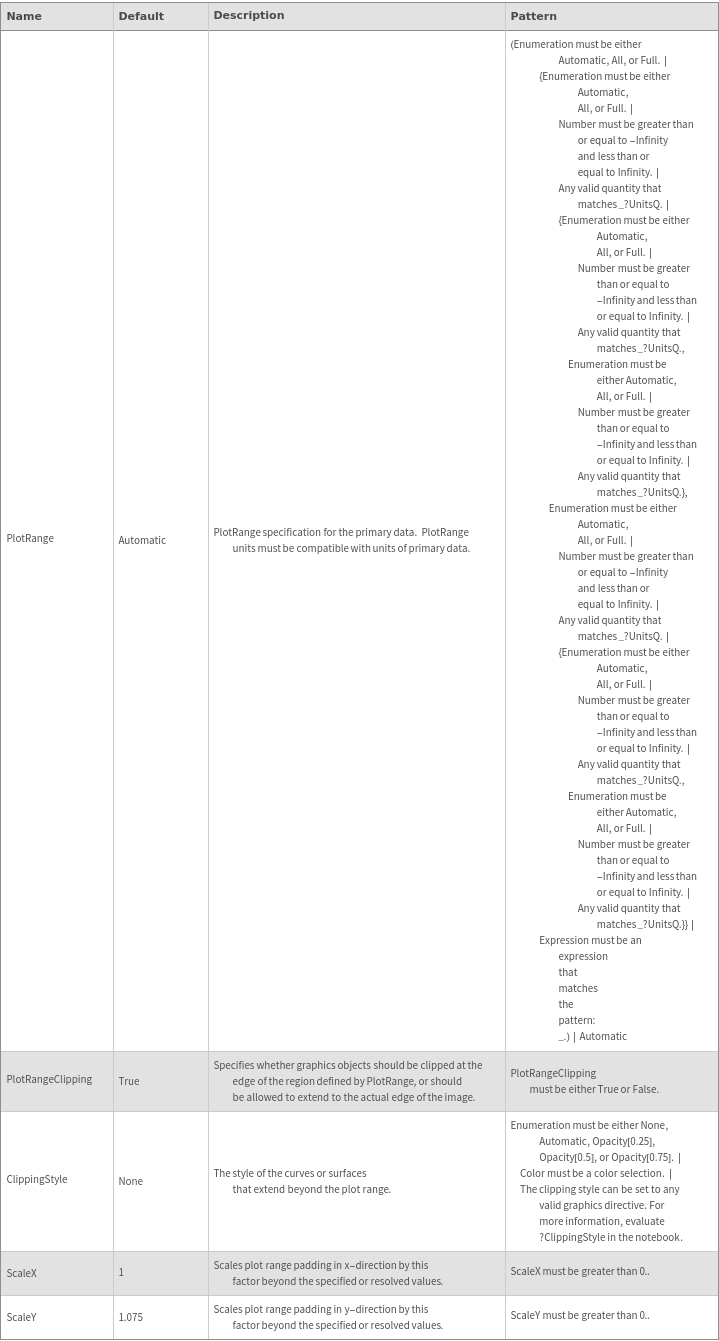
Plot Range Options
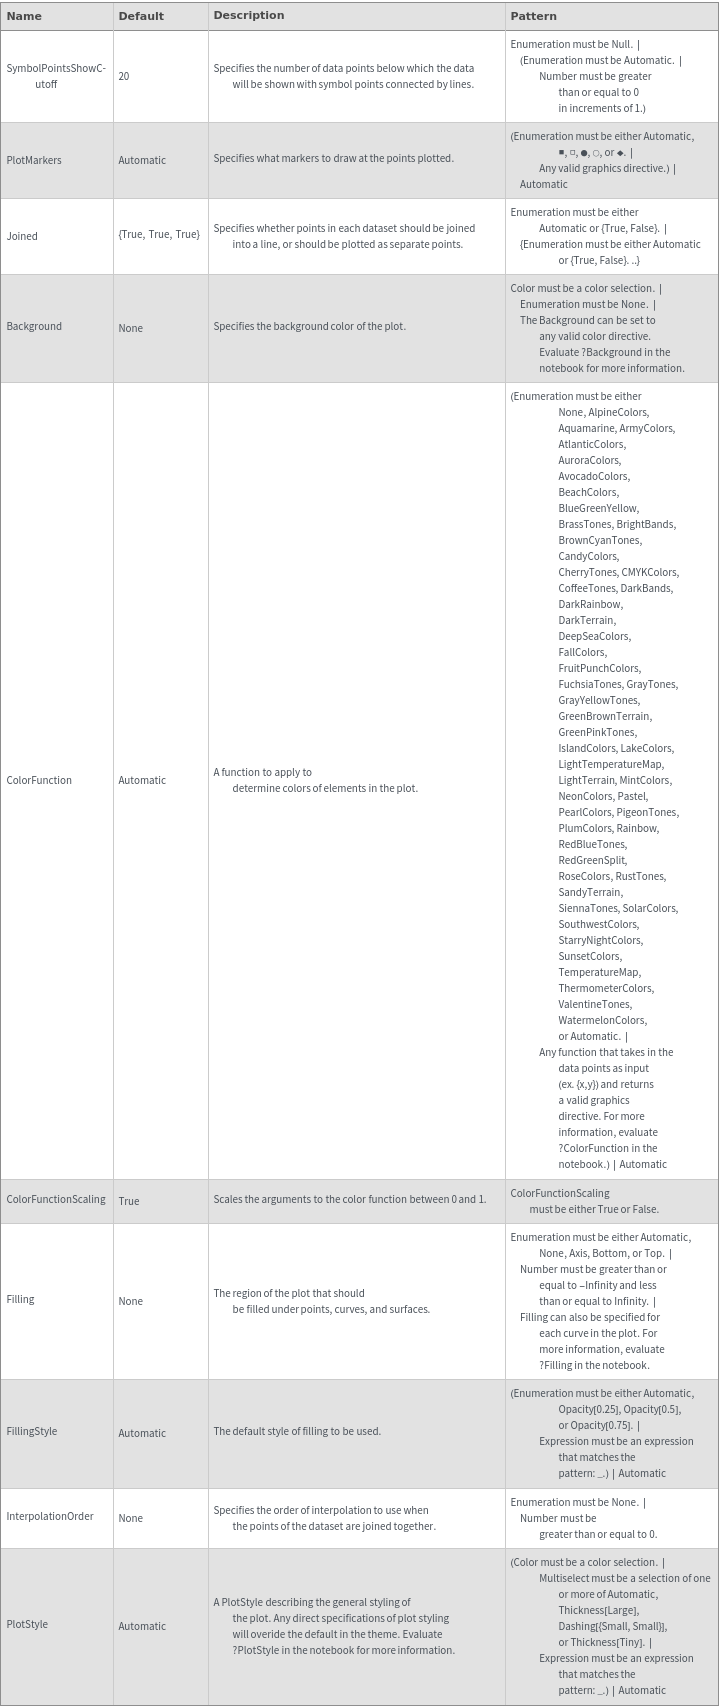
Plot Style Options
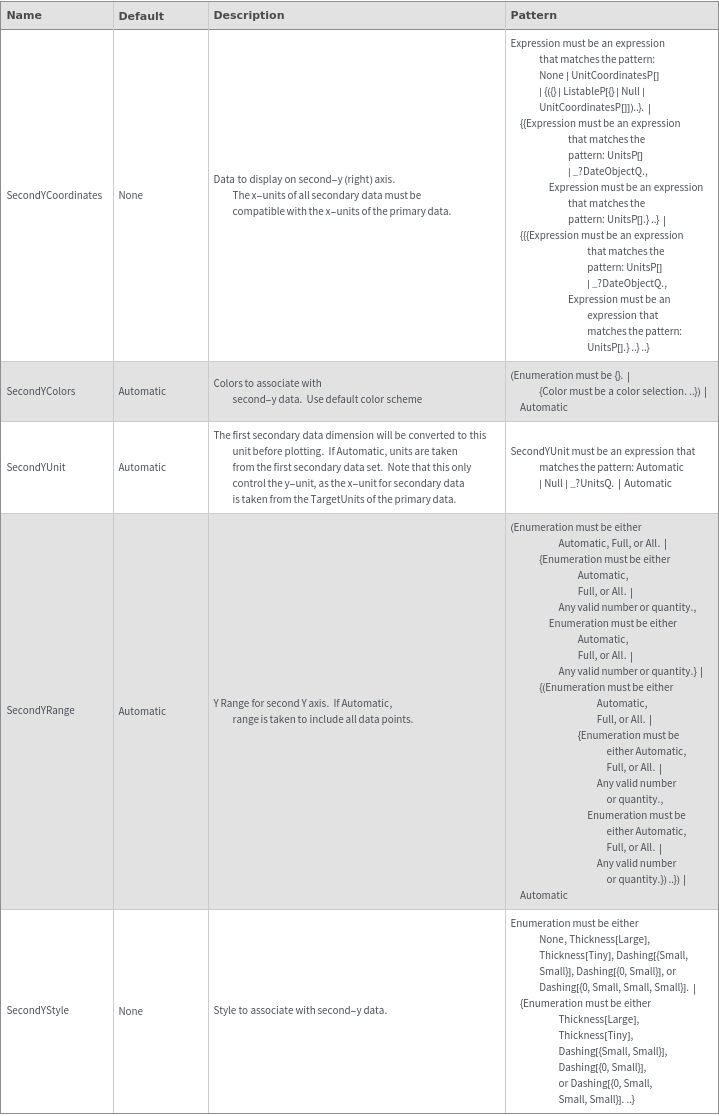
Secondary Data Options
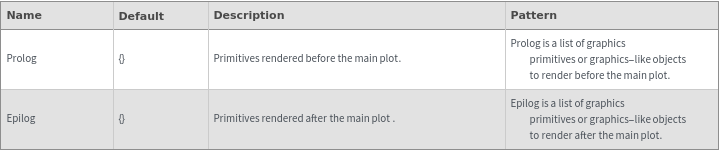
General Options