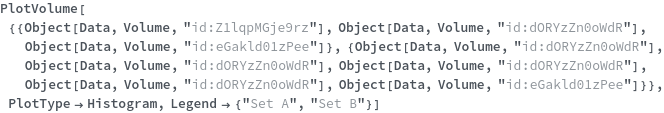
PlotVolume
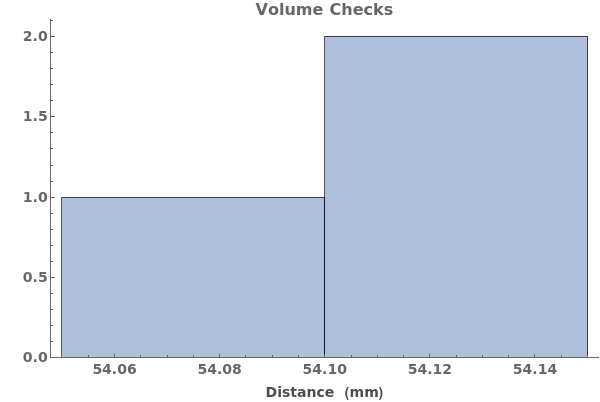
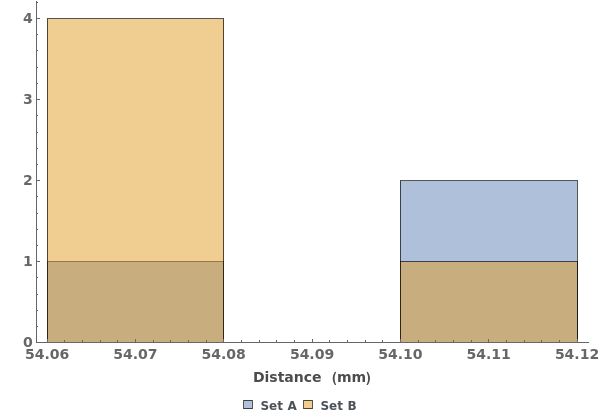
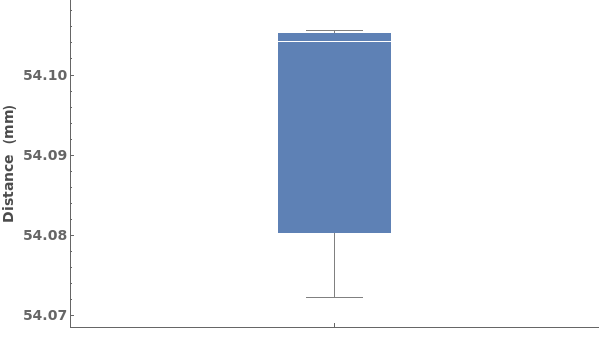
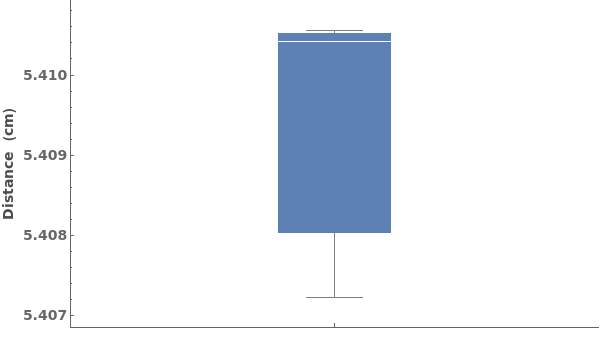
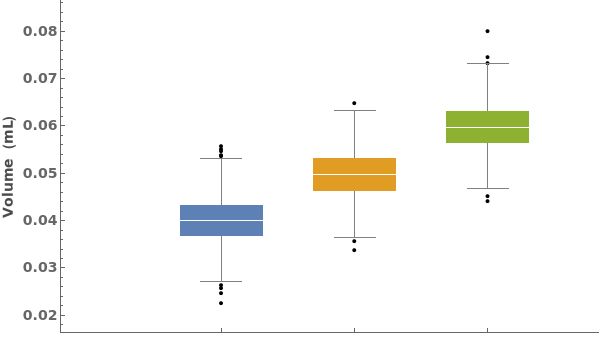
PlotVolume[volumeCheckData]⟹plot
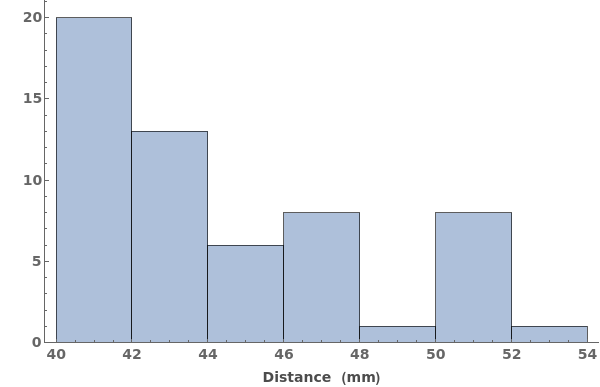
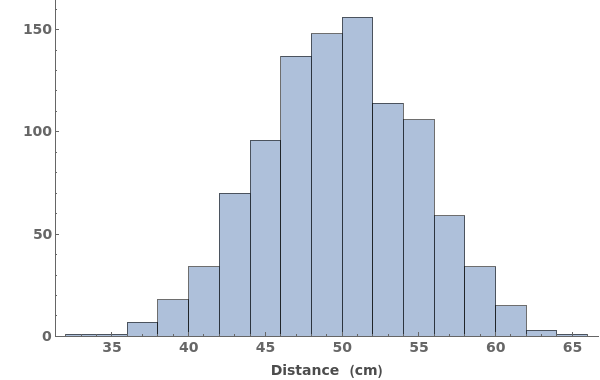
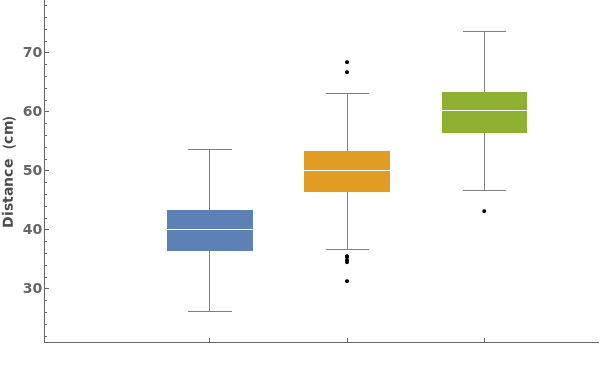
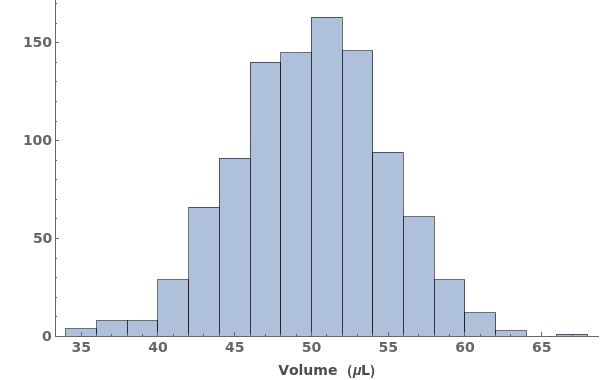
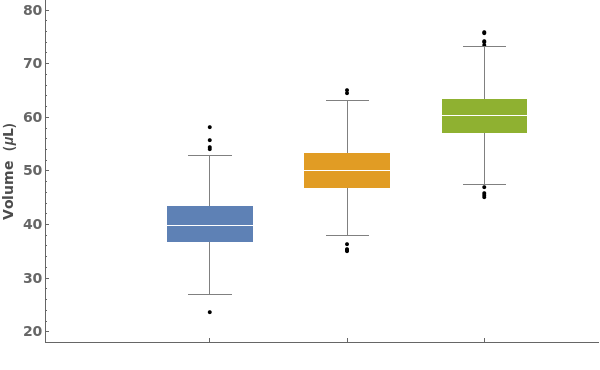
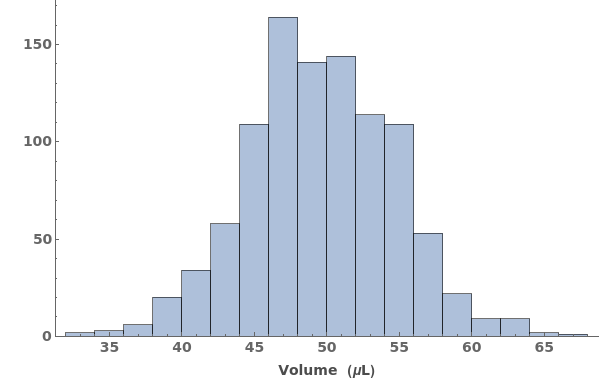
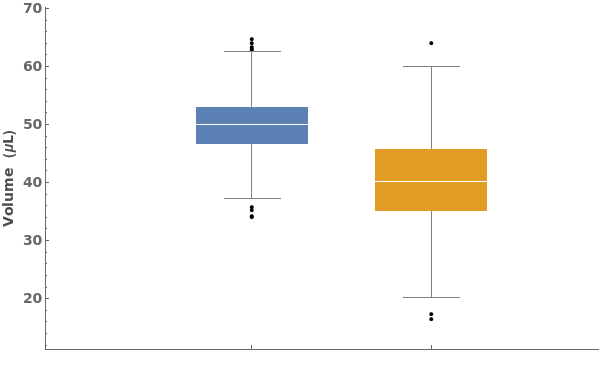
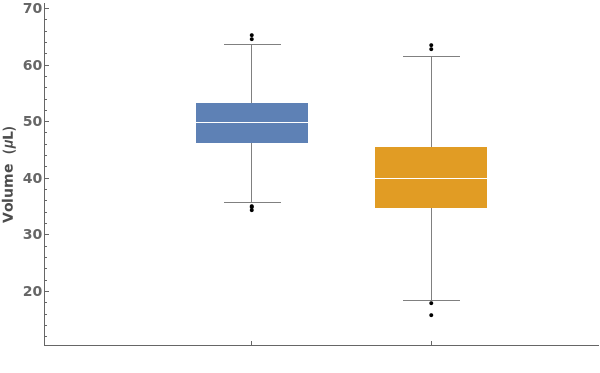
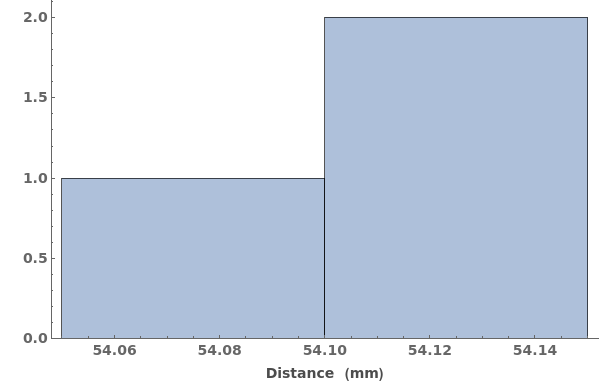
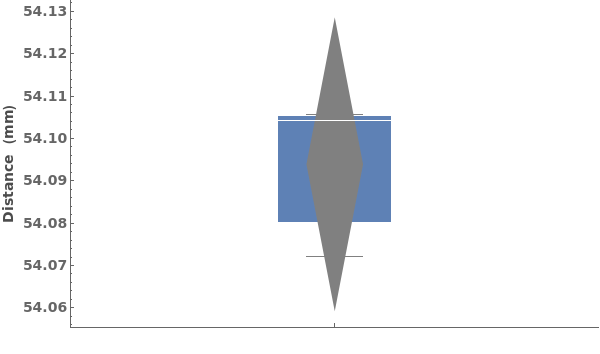
provides a graphical plot the provided Volume data's distributions either in the form of a histogram or a box and wisker plot.
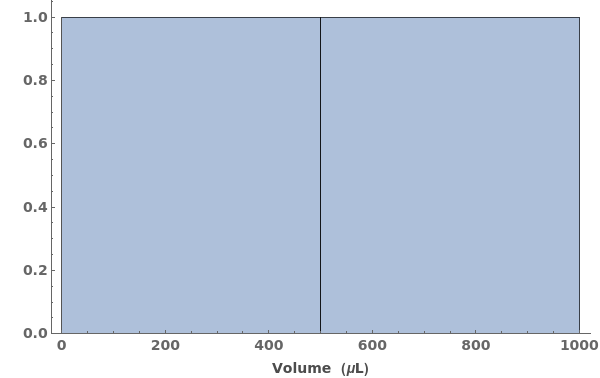
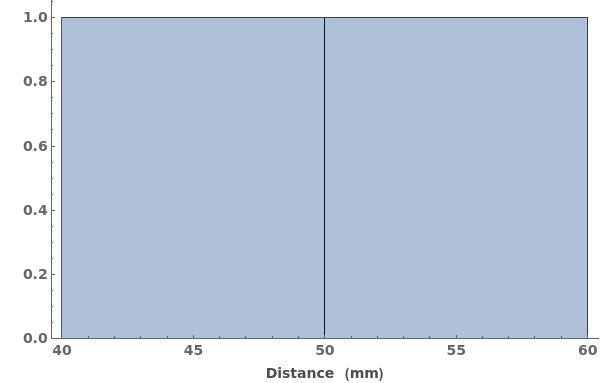
PlotVolume[readings]⟹plot
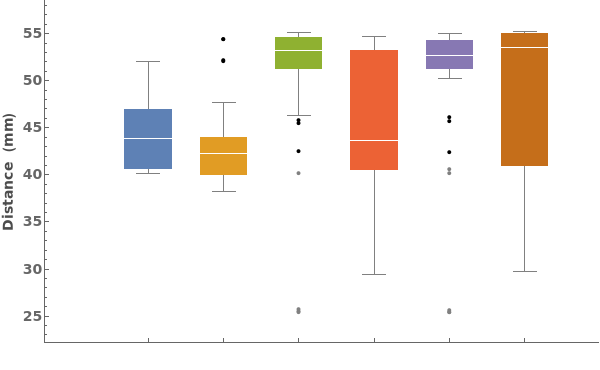
provides a graphical plot the provided Volume data's distributions either in the form of a histogram or a box and wisker plot.
Details
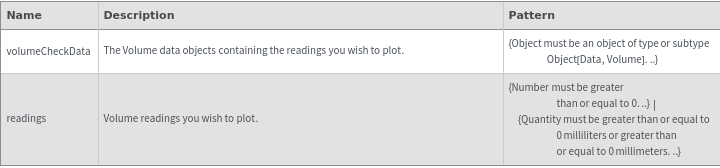
Input
Output

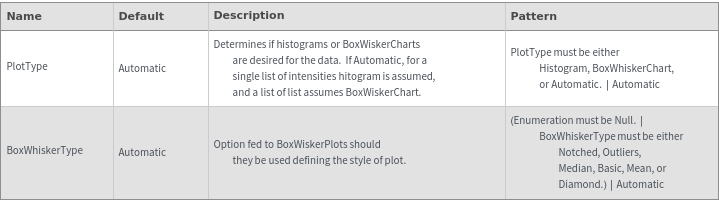
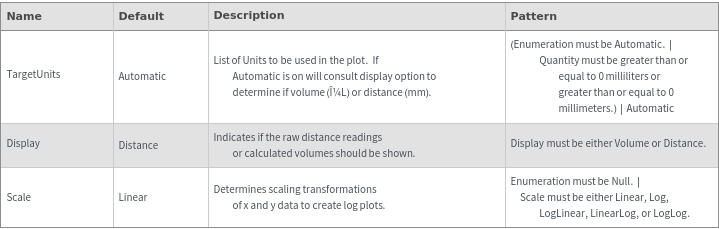
Data Specifications Options
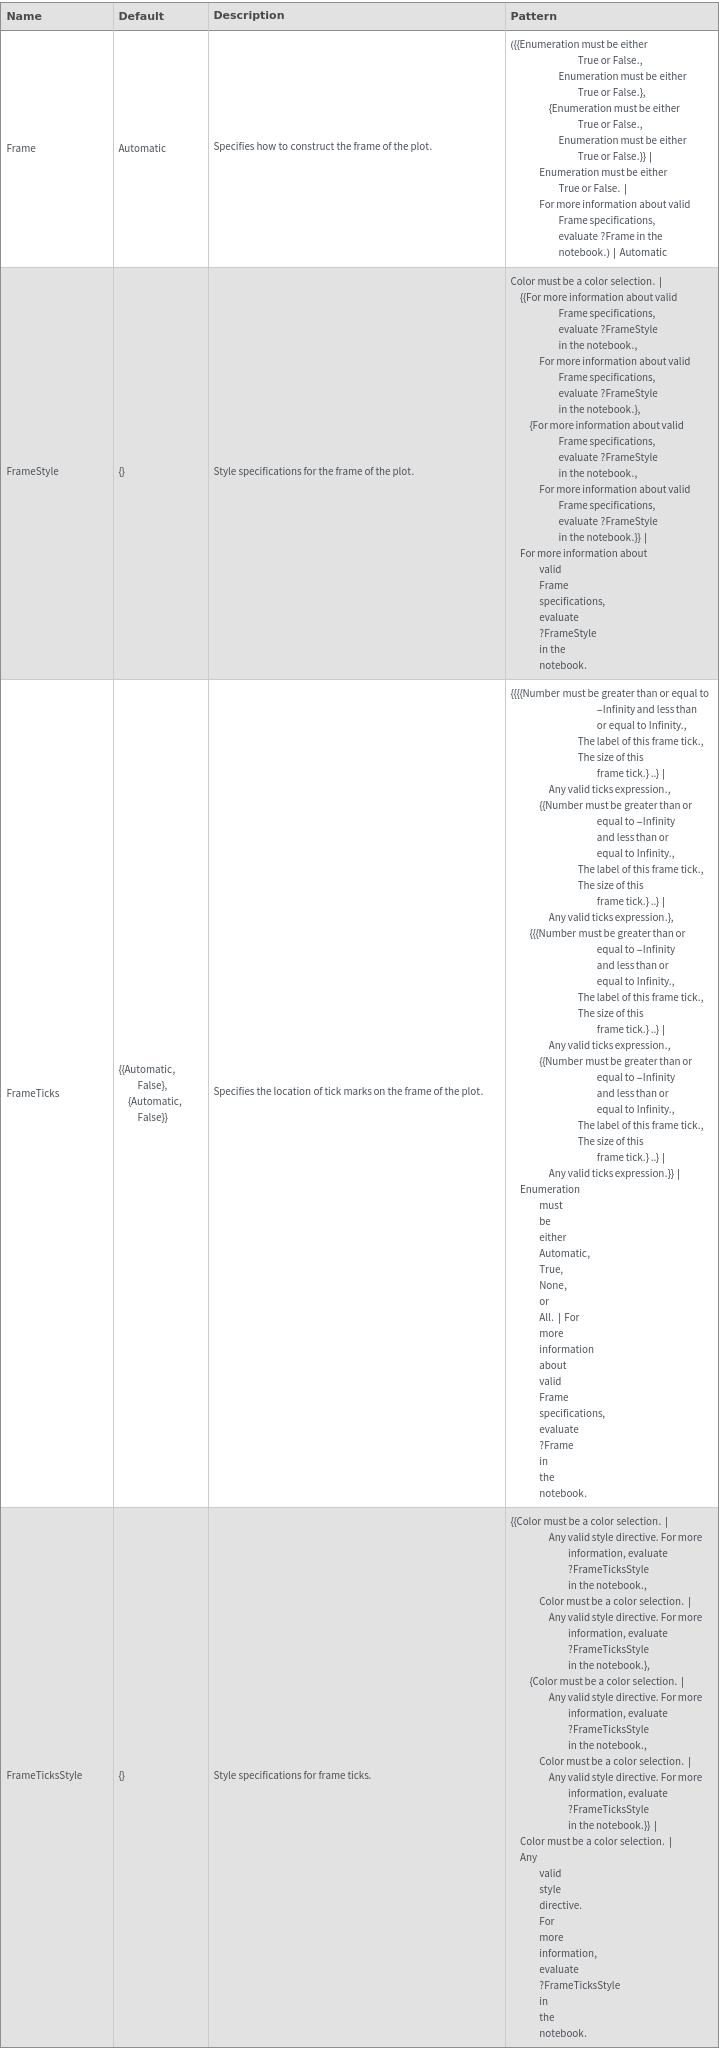
Frame Options
Grid Options
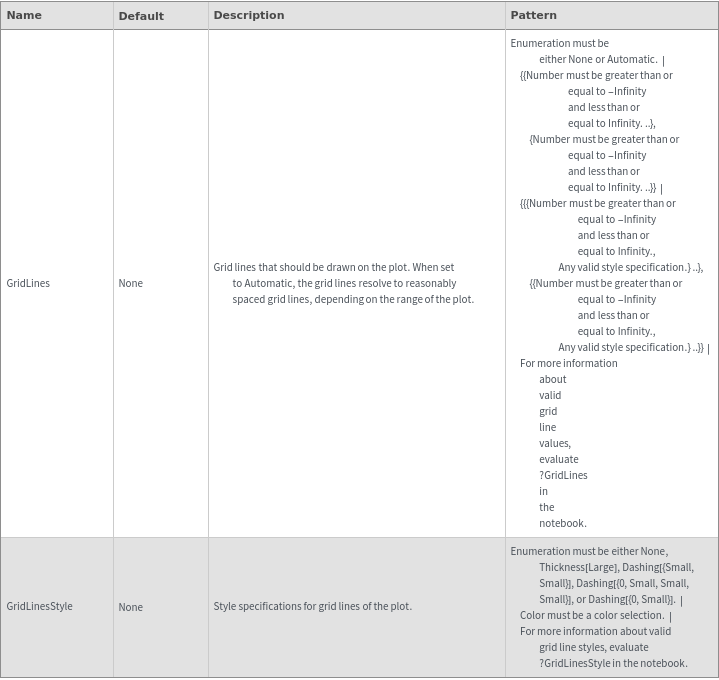
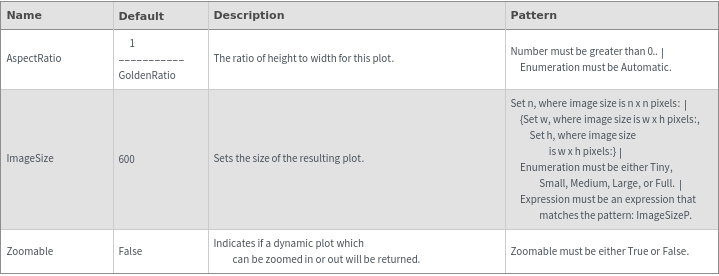
Image Format Options
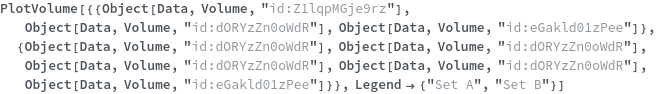
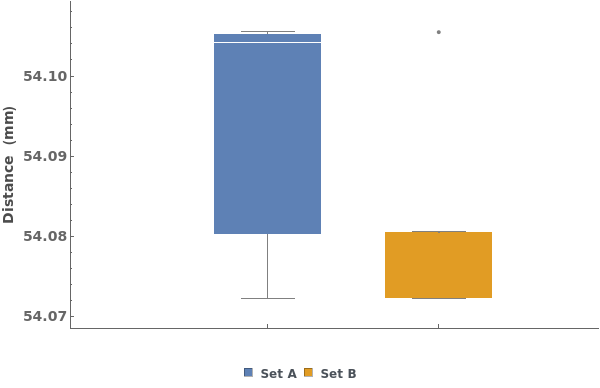
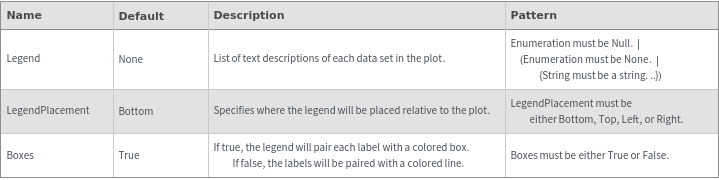
Legend Options
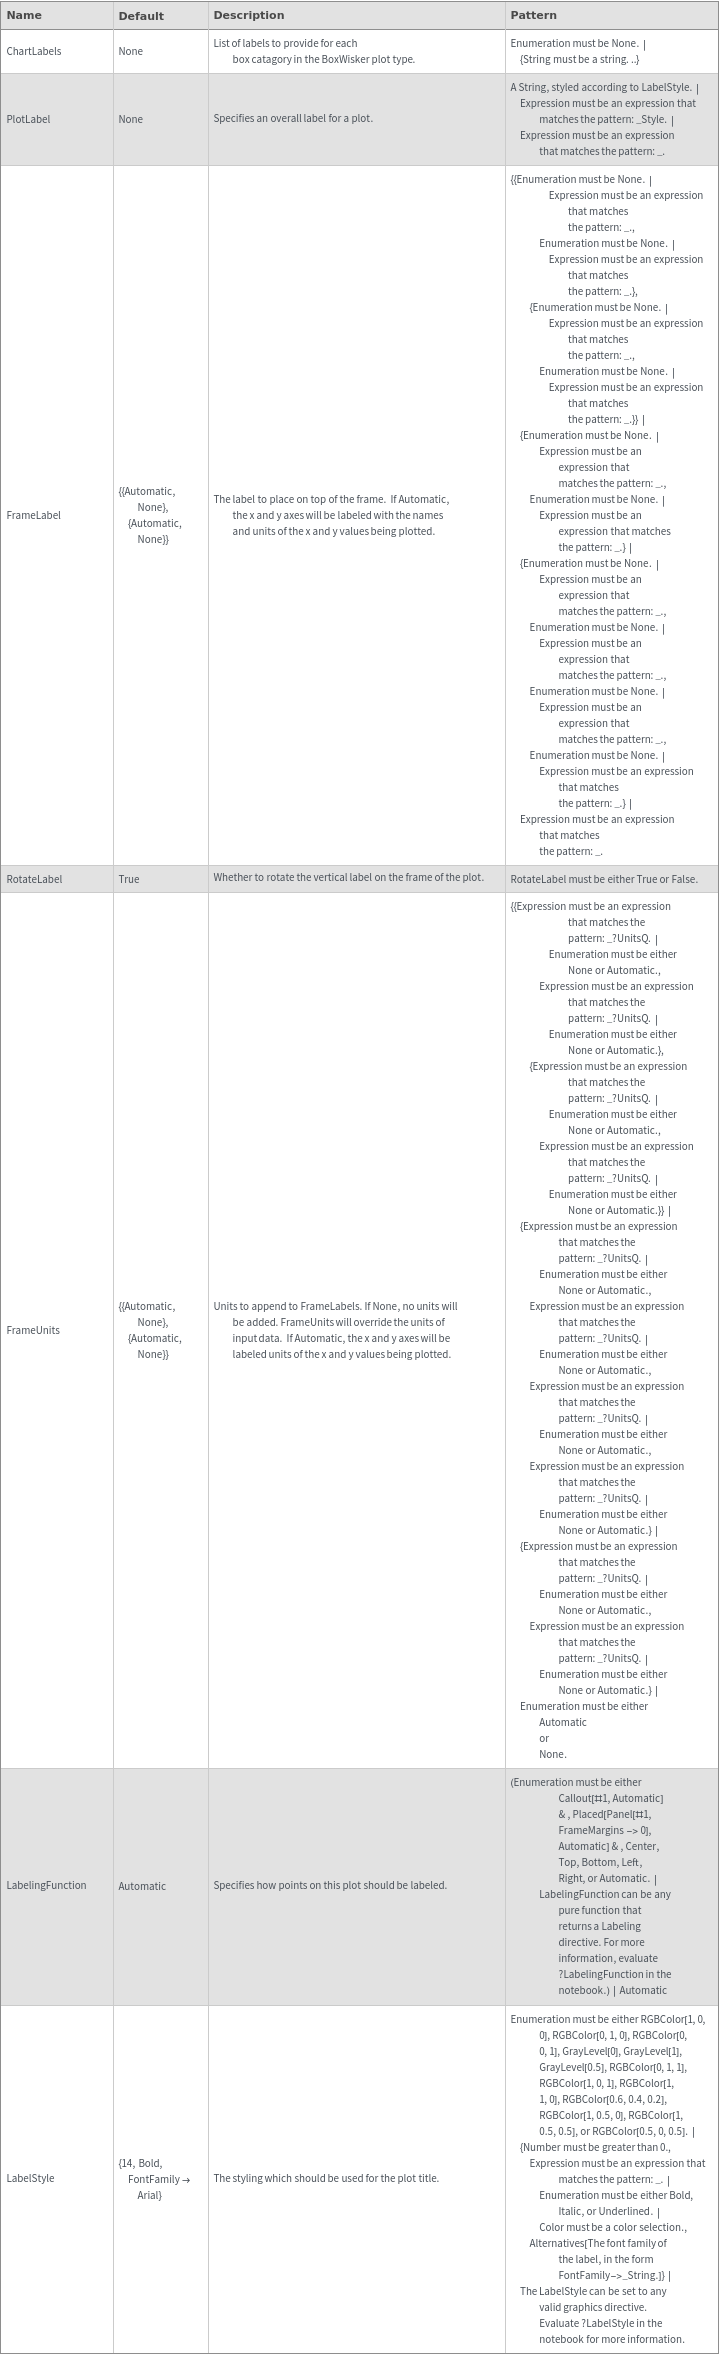
Plot Labeling Options
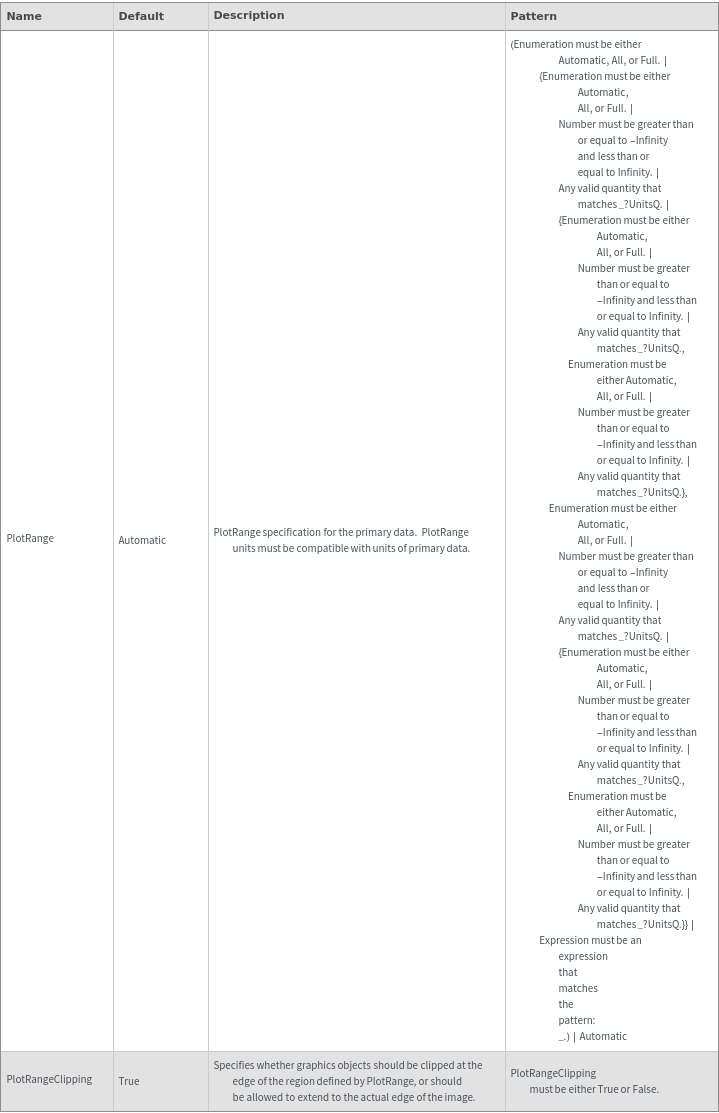
Plot Range Options
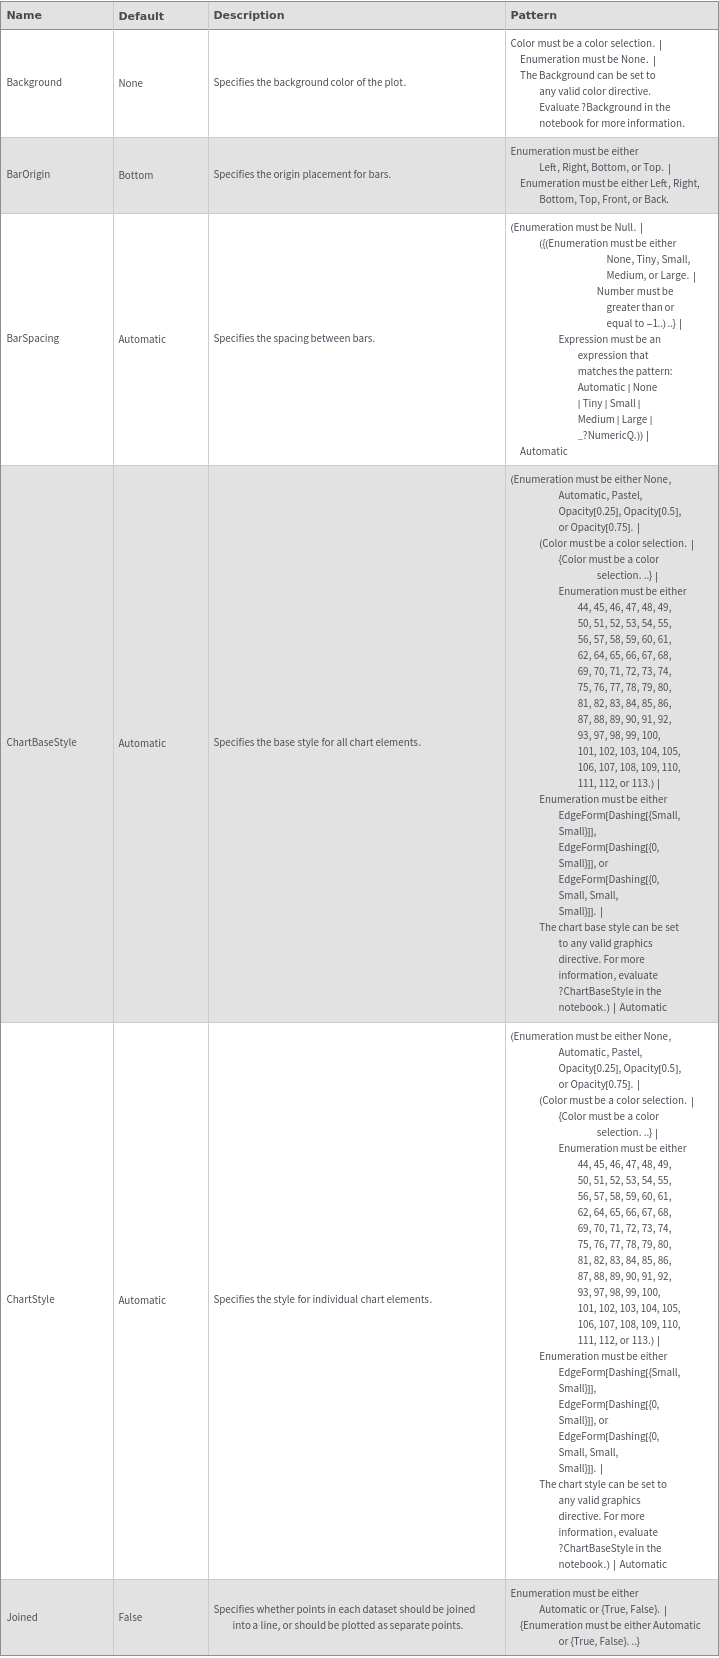
Plot Style Options
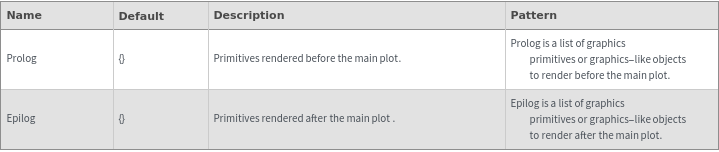
General Options
Method Options