PlotWestern
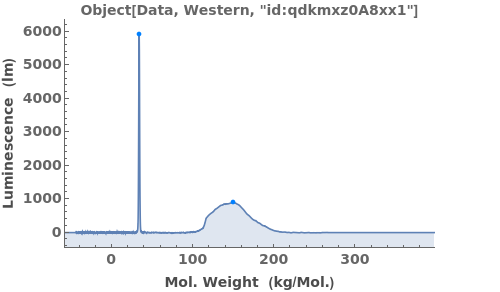
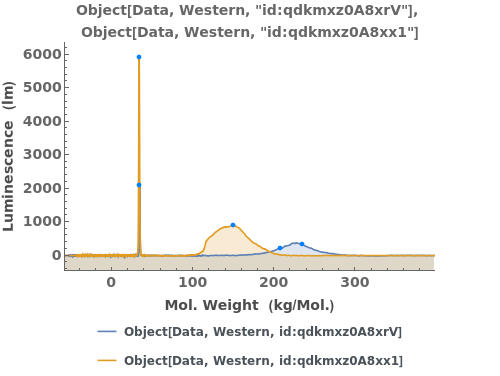
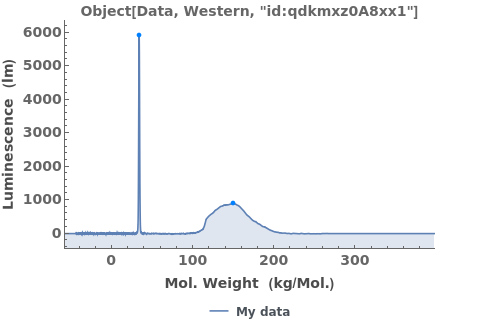
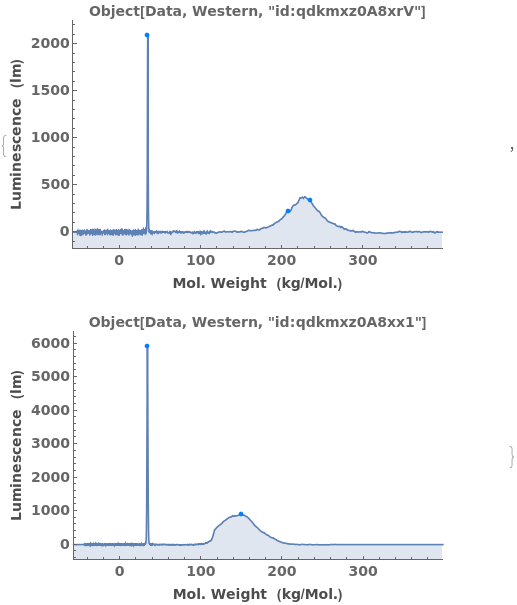
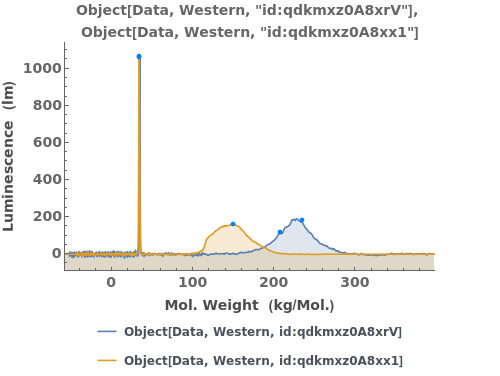
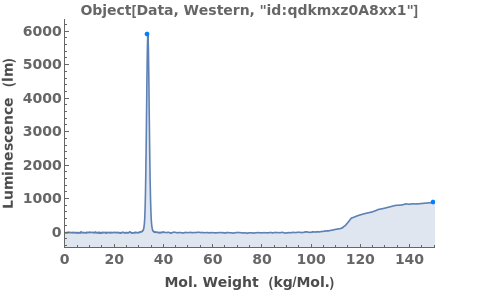
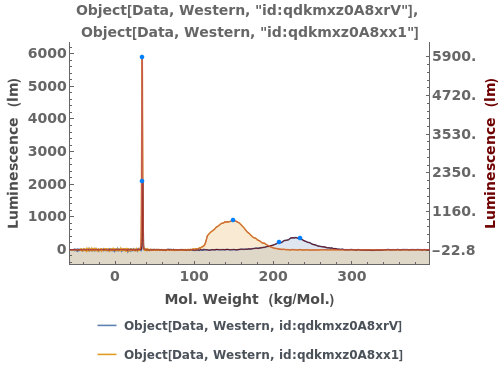
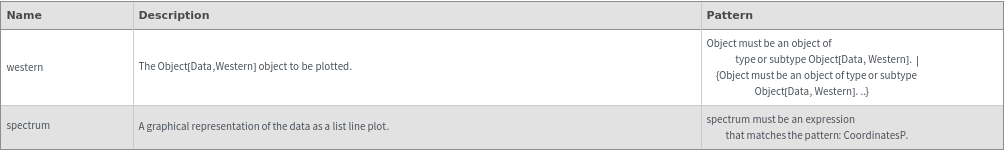
PlotWestern[western]⟹spectralPlot
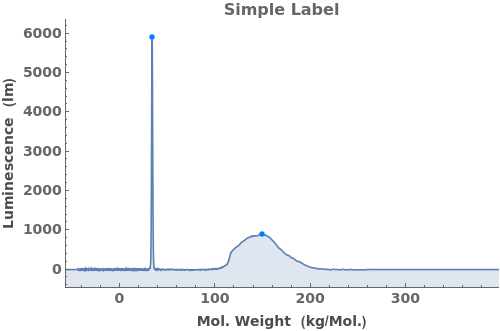
plots the western MassSpectrum as a list line plot.
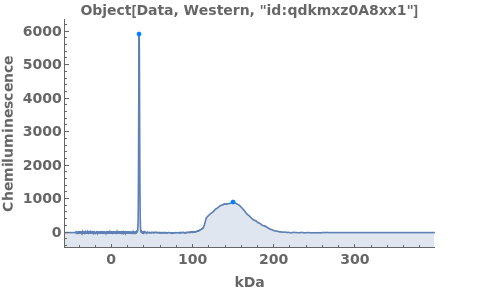
PlotWestern[spectrum]⟹spectralPlot
plots the spectrum as a list line plot.
Details
Input
Output

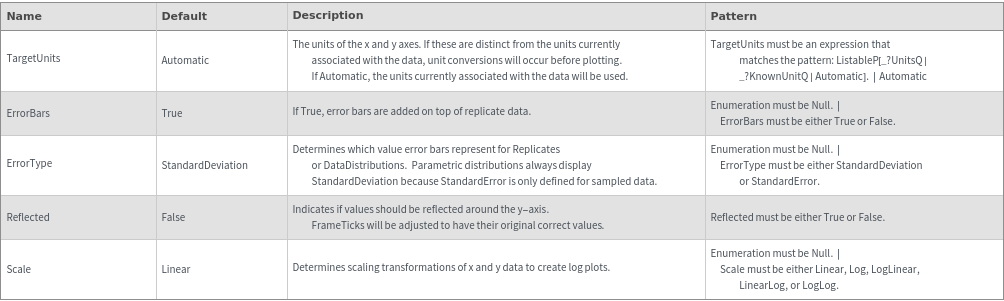
Data Specifications Options
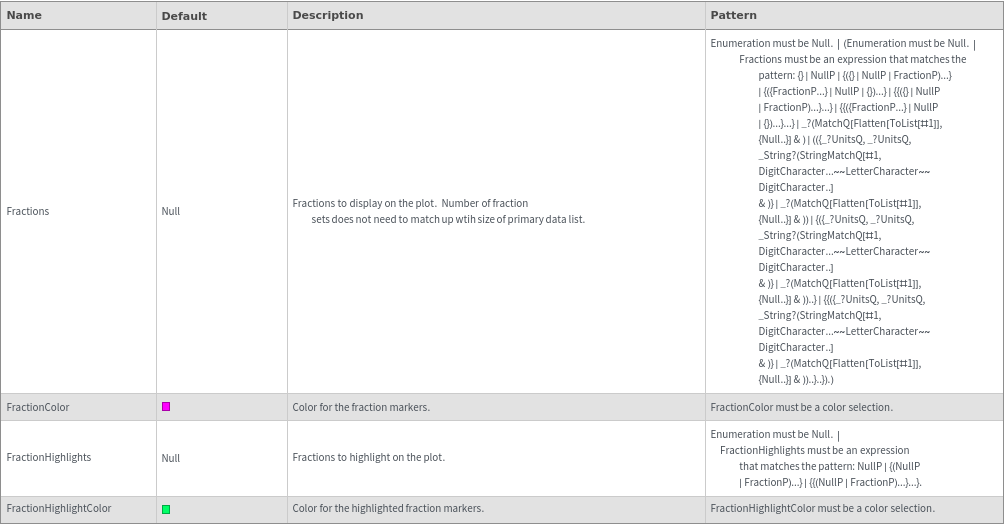
Fractions Options
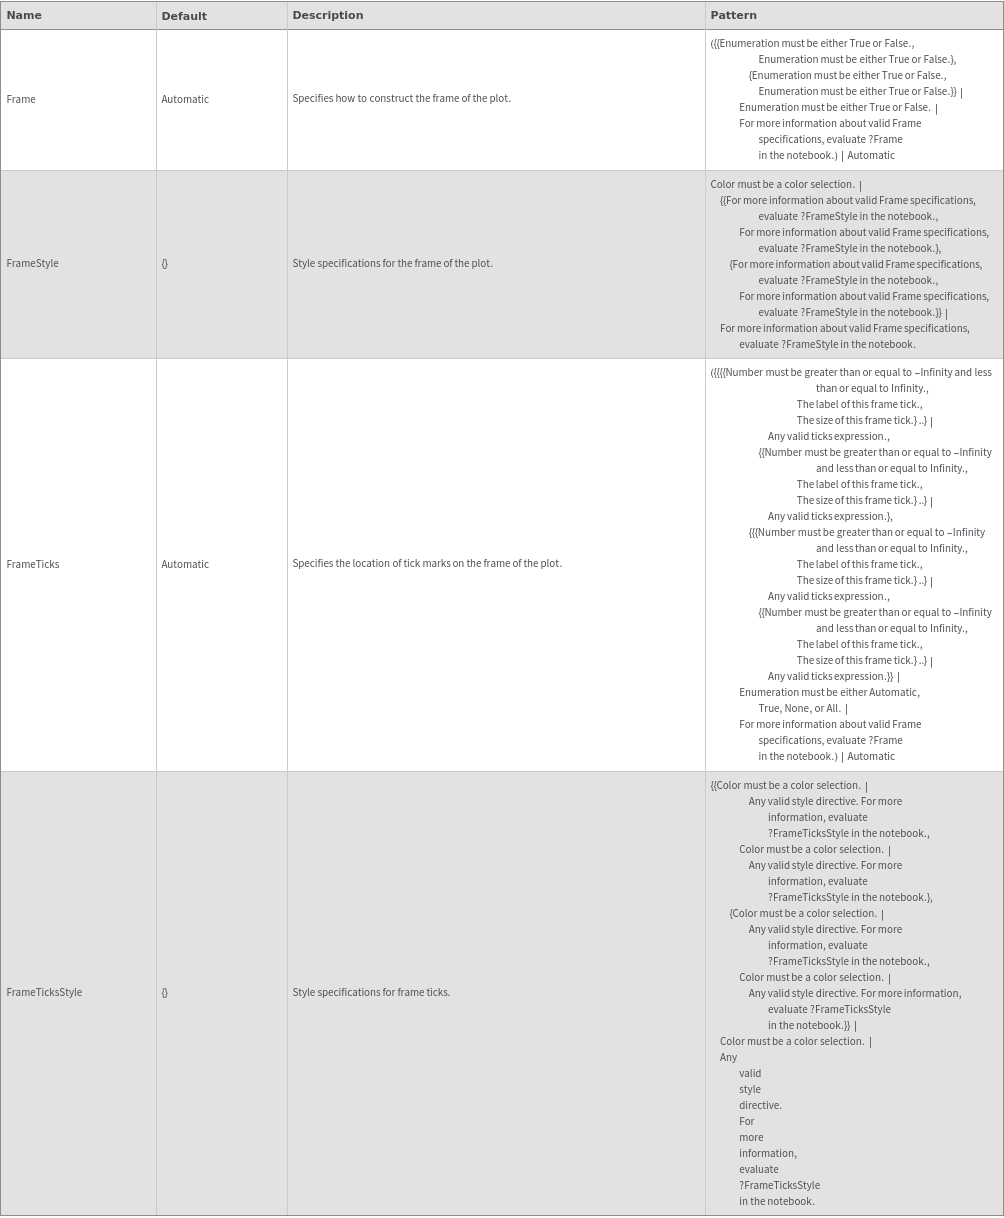
Frame Options
Grid Options
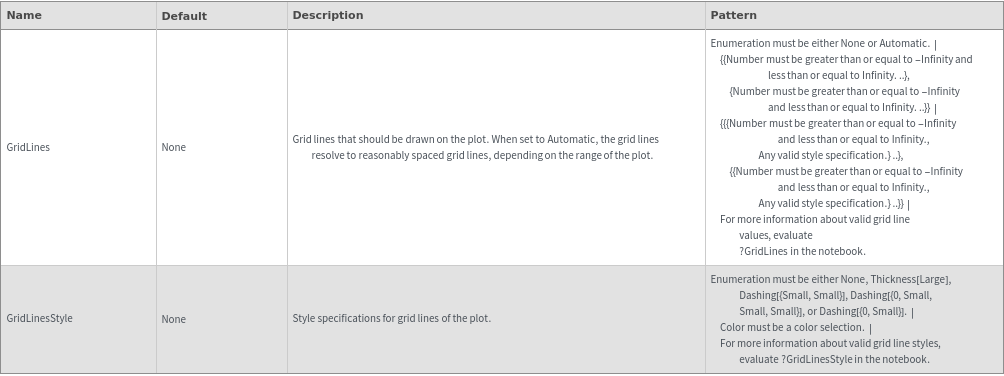
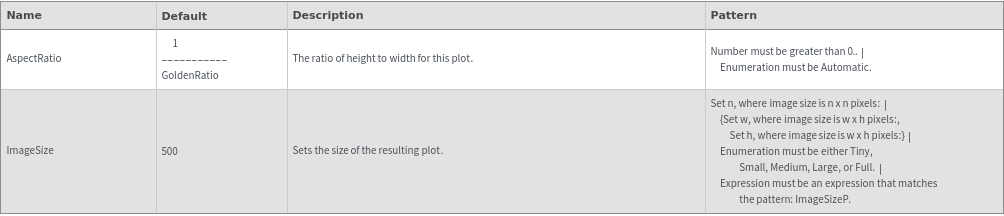
Image Format Options
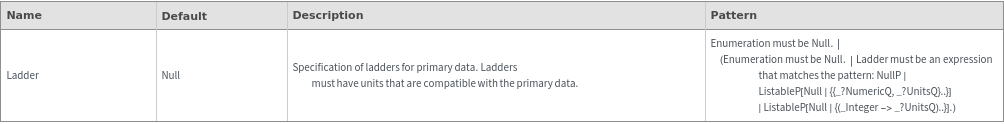
Ladder Options
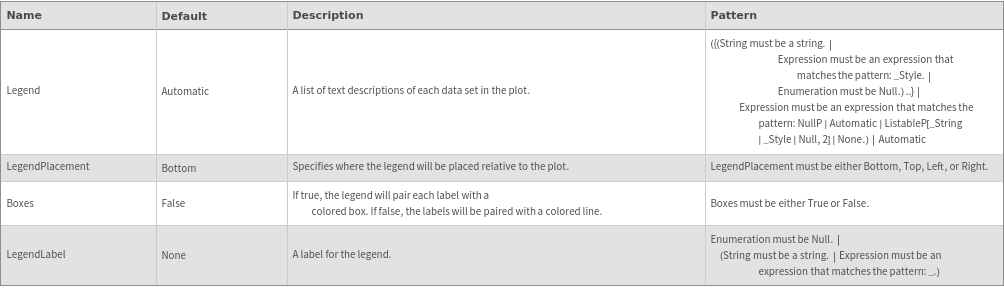
Legend Options
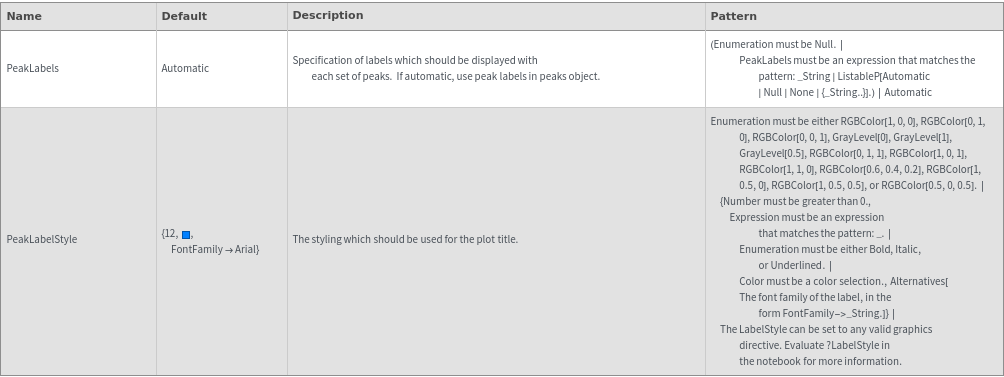
Peaks Options
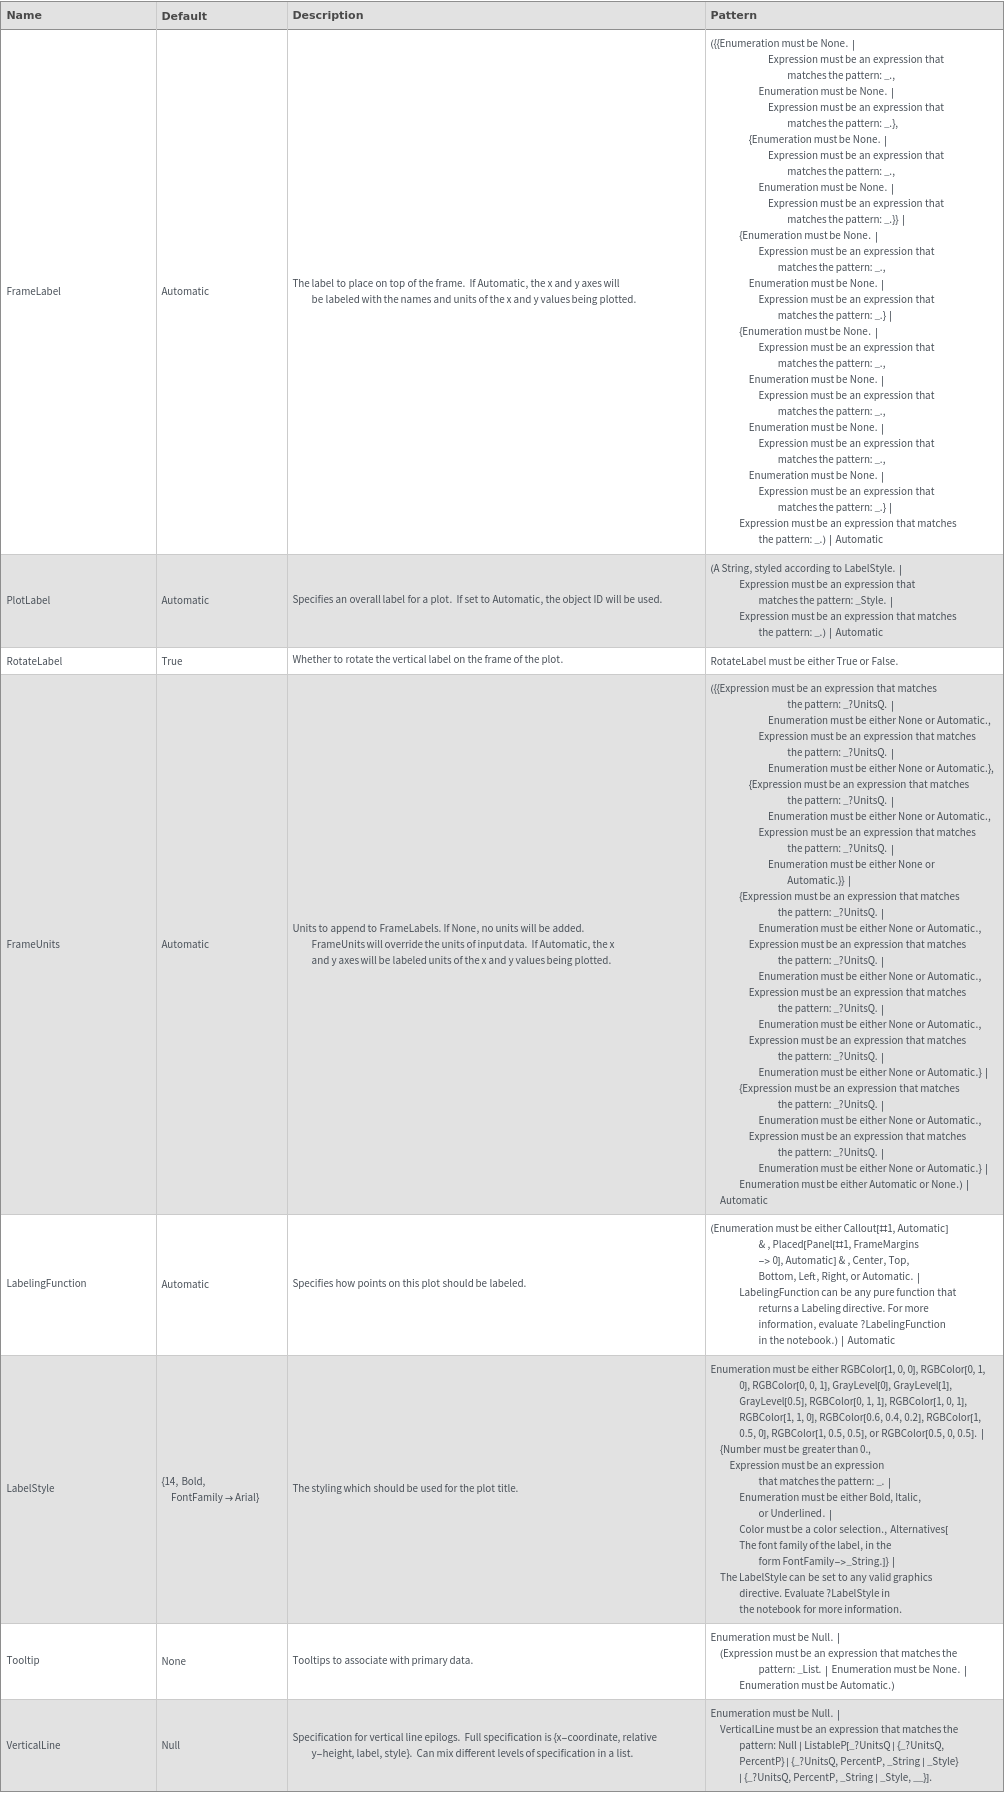
Plot Labeling Options
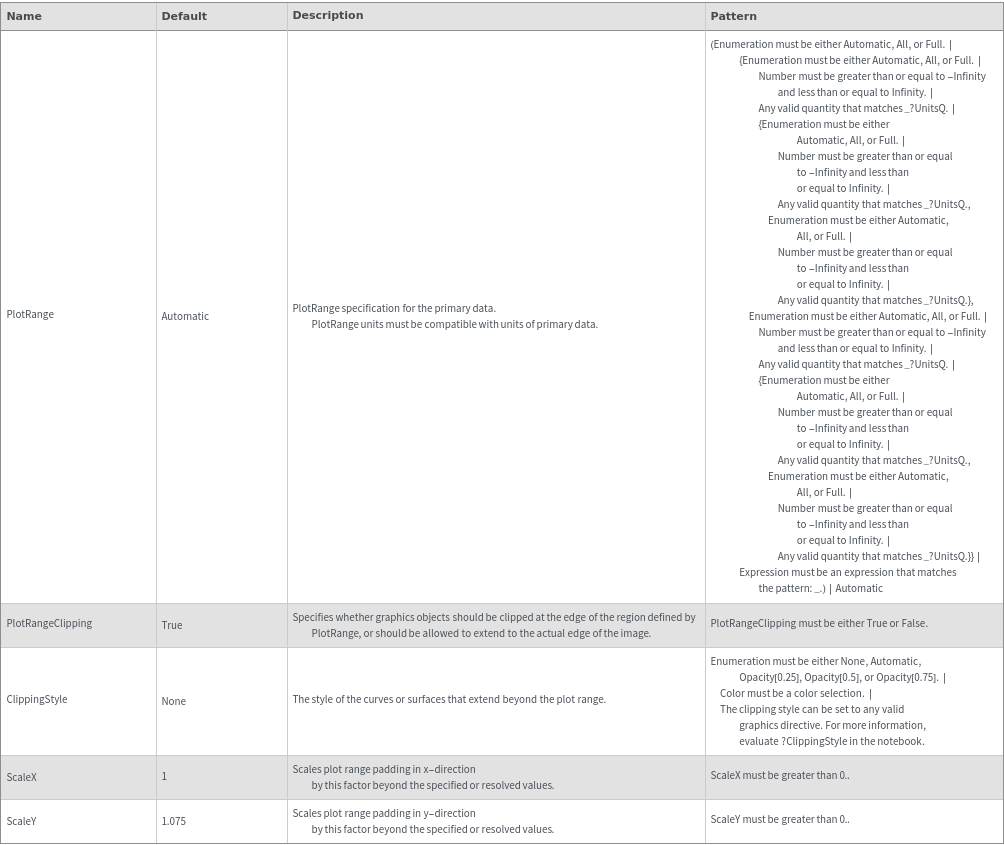
Plot Range Options
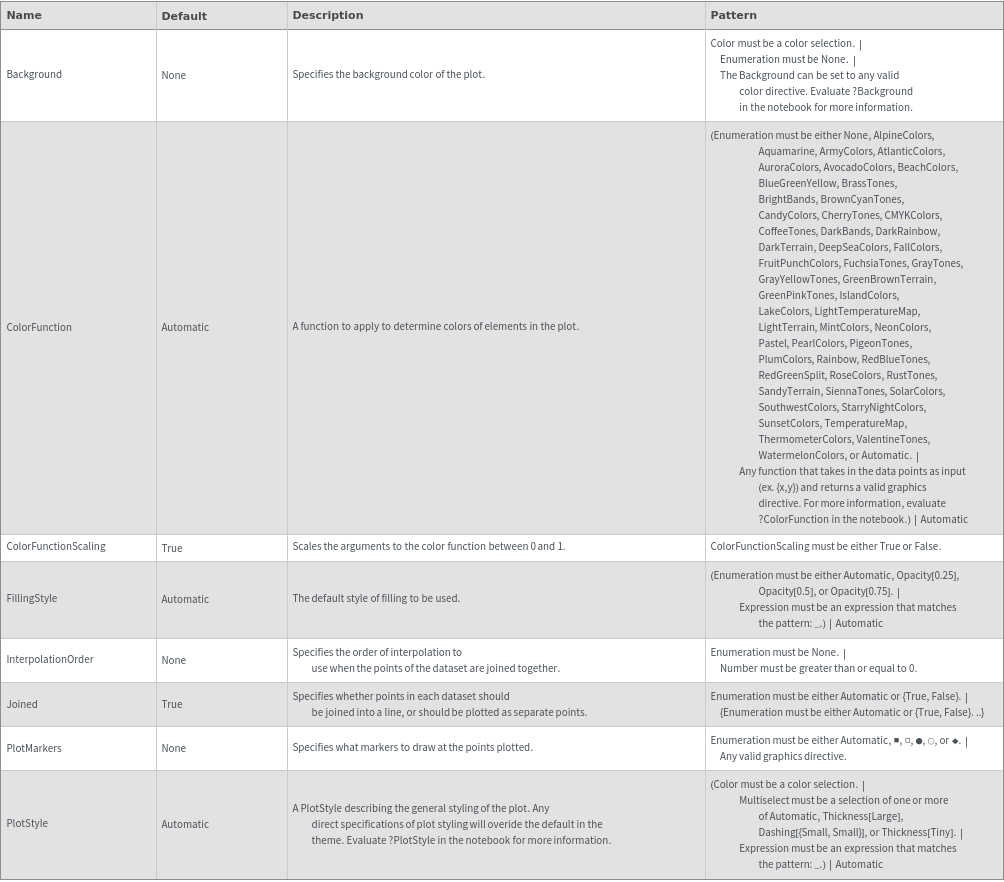
Plot Style Options
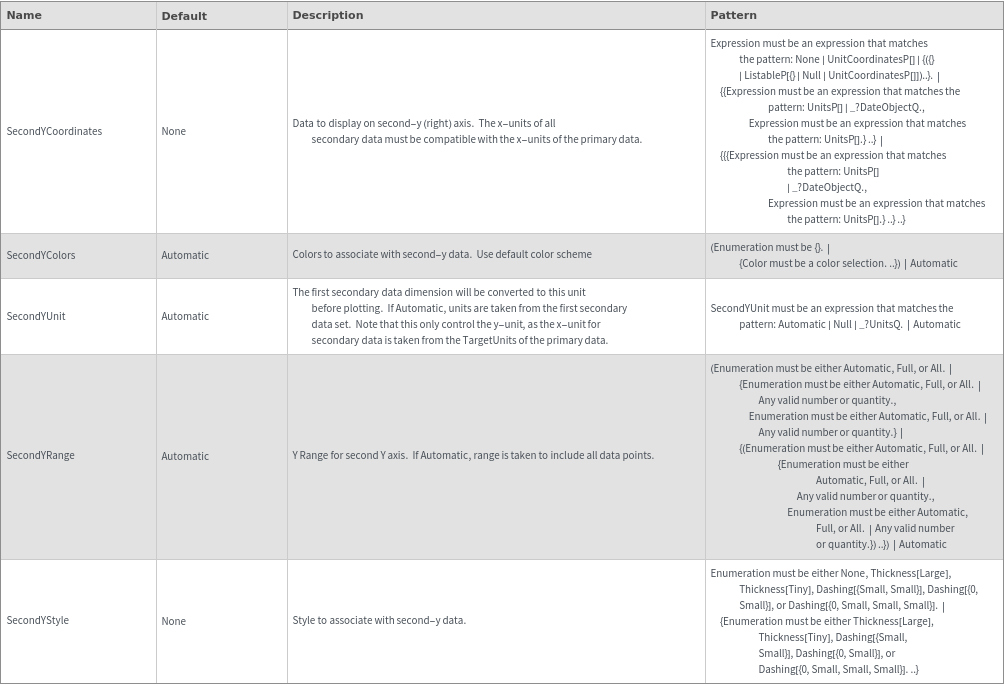
Secondary Data Options
General Options