AnalyzeParallelLine
AnalyzeParallelLine[StandardXY, AnalyteXY]⟹Object
calculate the relative potency ratio between EC50 values in two dose-response fitted curves.
Details
- This function uses Four Parameter Logistic Regression method to analyze dose-response curves, as described in Object[Report,Literature,"id:4pO6dM55jxYr"]: Gottschalk, P.D. and Dunn, J.R. 2005. Measuring parallelism, linearity, and relative potency in bioassay and immunoassay data. Journal of Biopharmaceutical Statistics 15(3): 437-463..
Input

Output

General Options
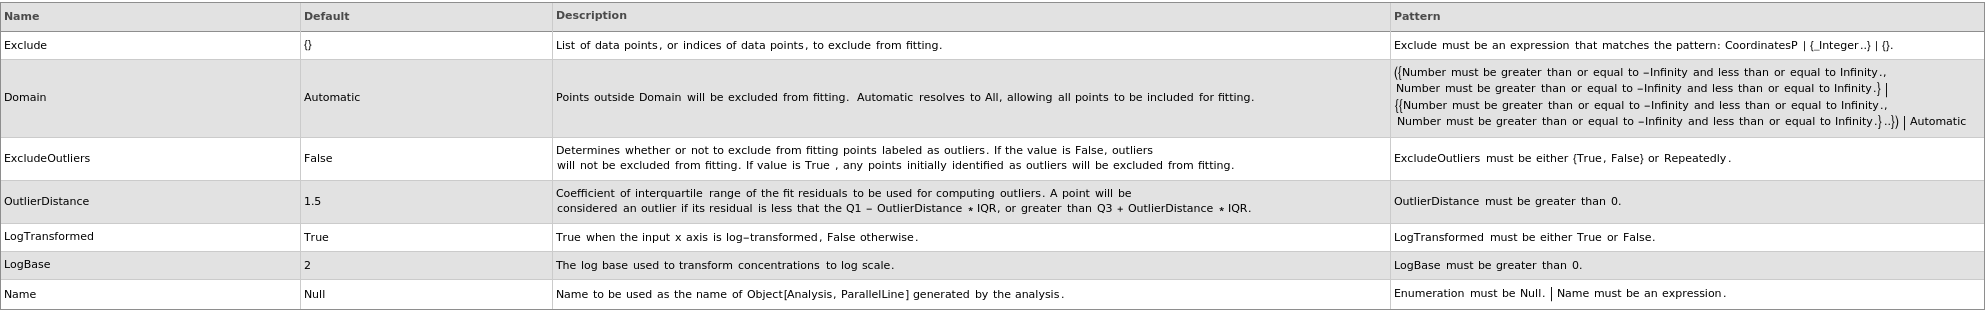
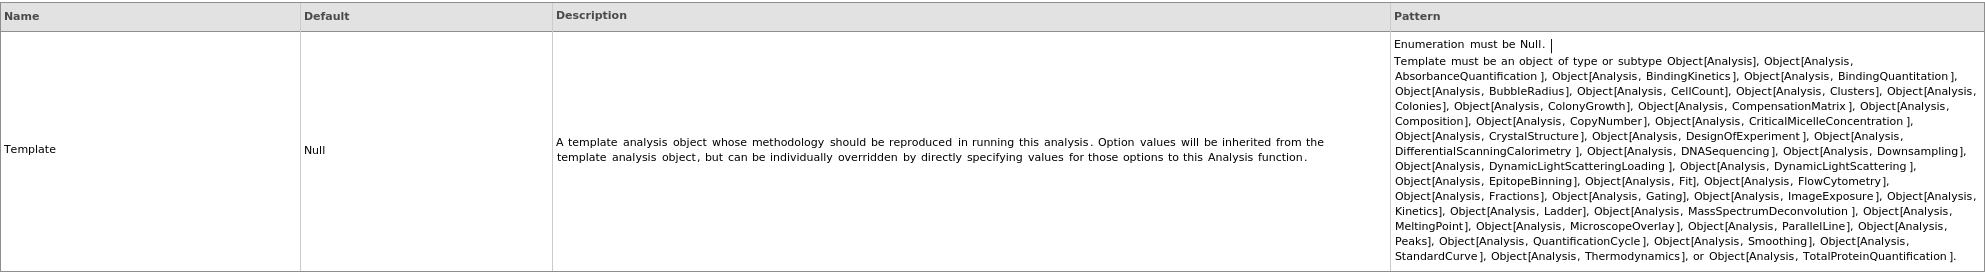
Method Options
Examples
open allclose allBasic Examples (4)
Options (8)
Exclude (1)
ExcludeOutliers (1)
Last modified on Thu 18 Sep 2025 09:37:15