PlotIRSpectroscopy
PlotIRSpectroscopy[IRData]⟹Plot
generates a graphical plot of the spectrum stored in the input IR spectroscopy data object.
PlotIRSpectroscopy[Protocol]⟹Plot
creates a Plot of the IR spectroscopy data found in the Data field of Protocol.
Details
Input

Output

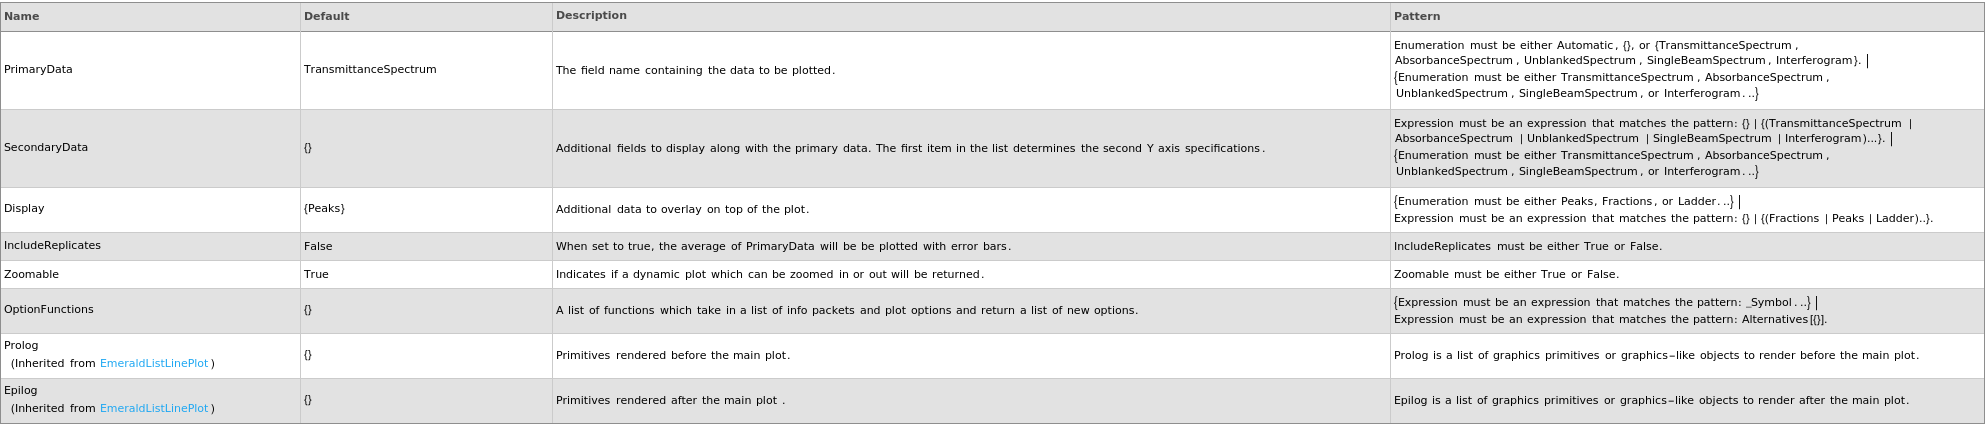
Data Specifications Options
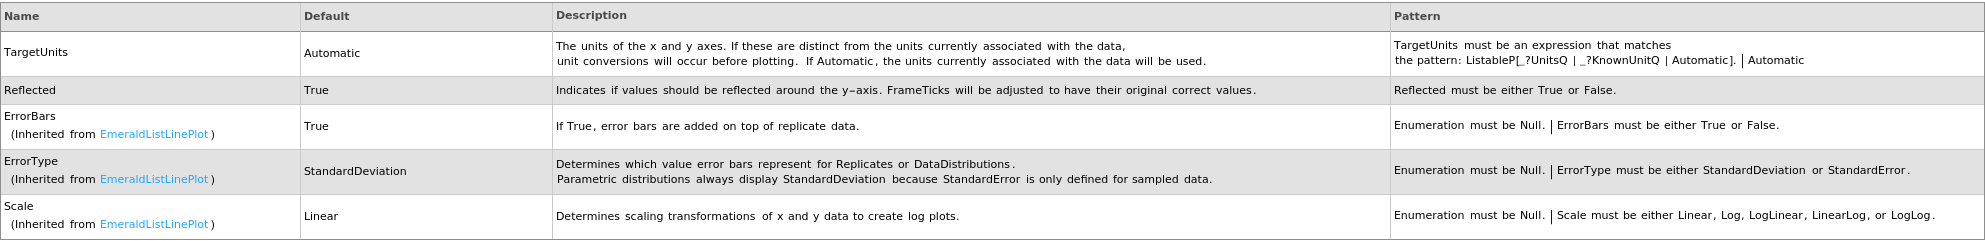
Fractions Options
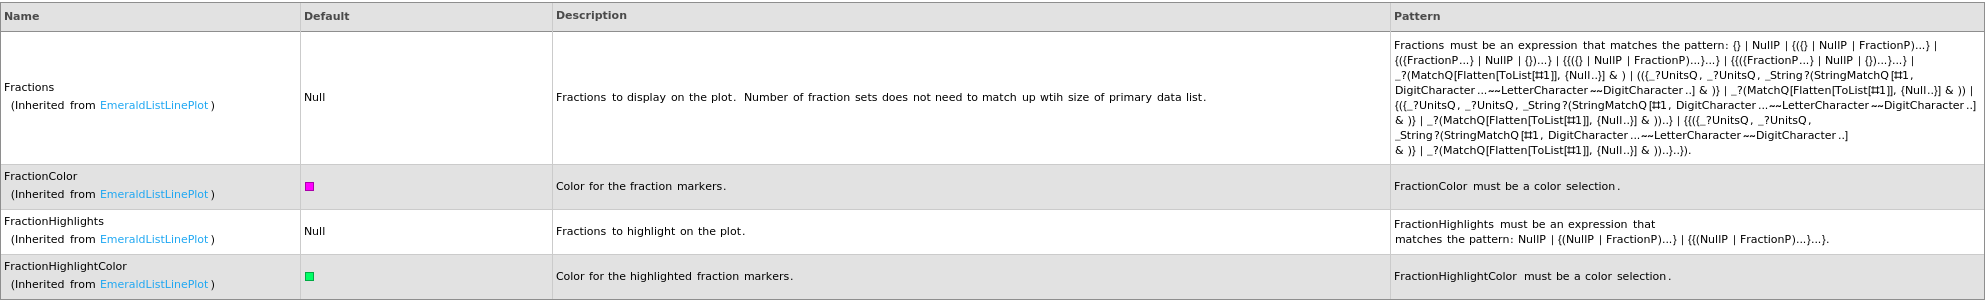
Frame Options
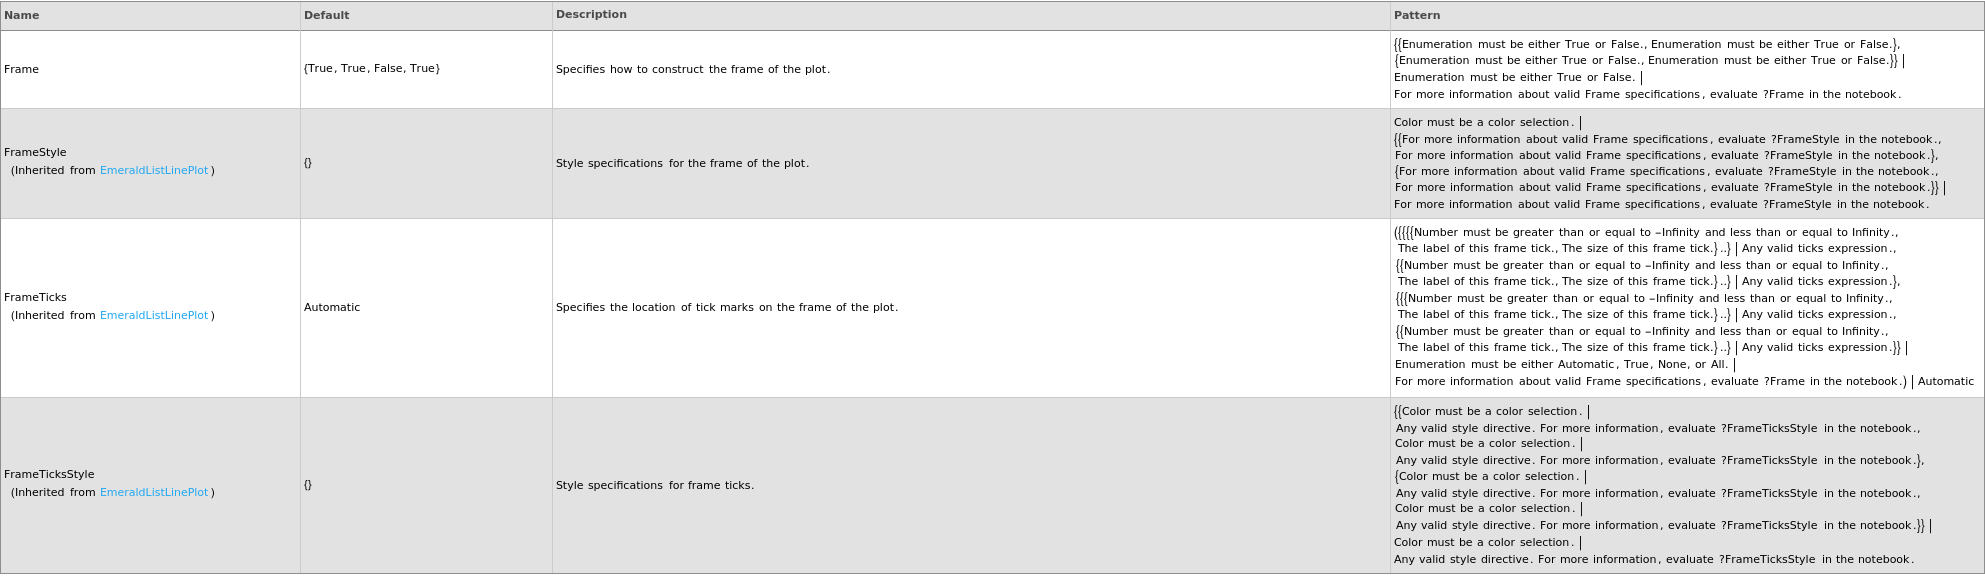
Grid Options
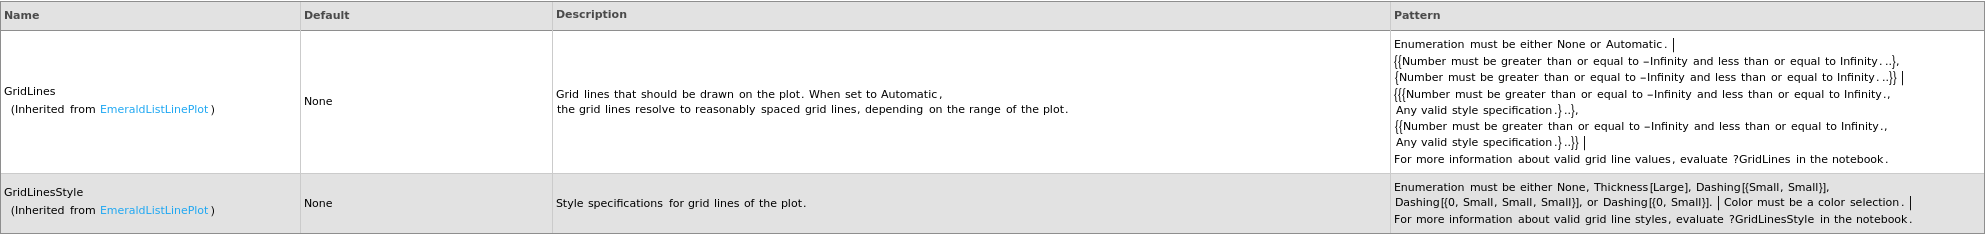
Image Format Options

Ladder Options

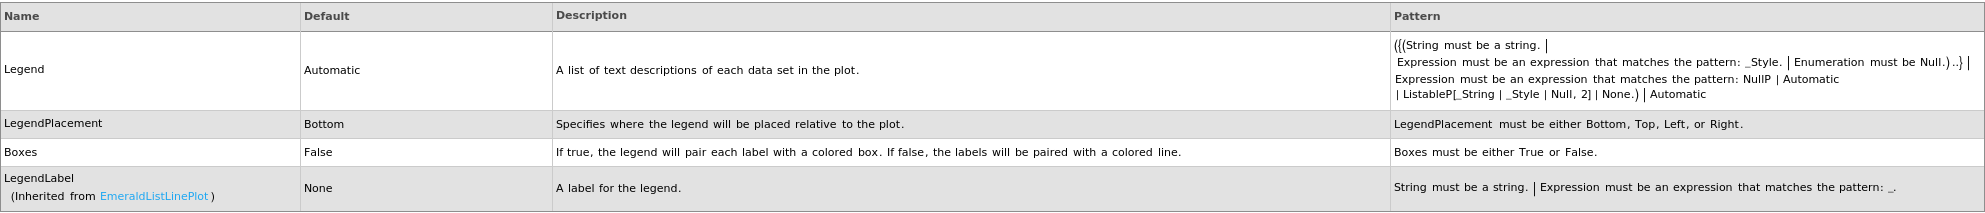
Legend Options
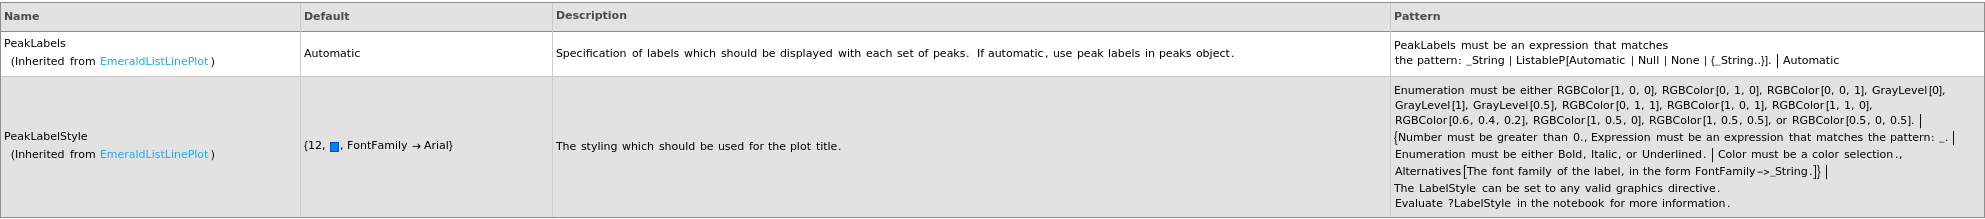
Peaks Options
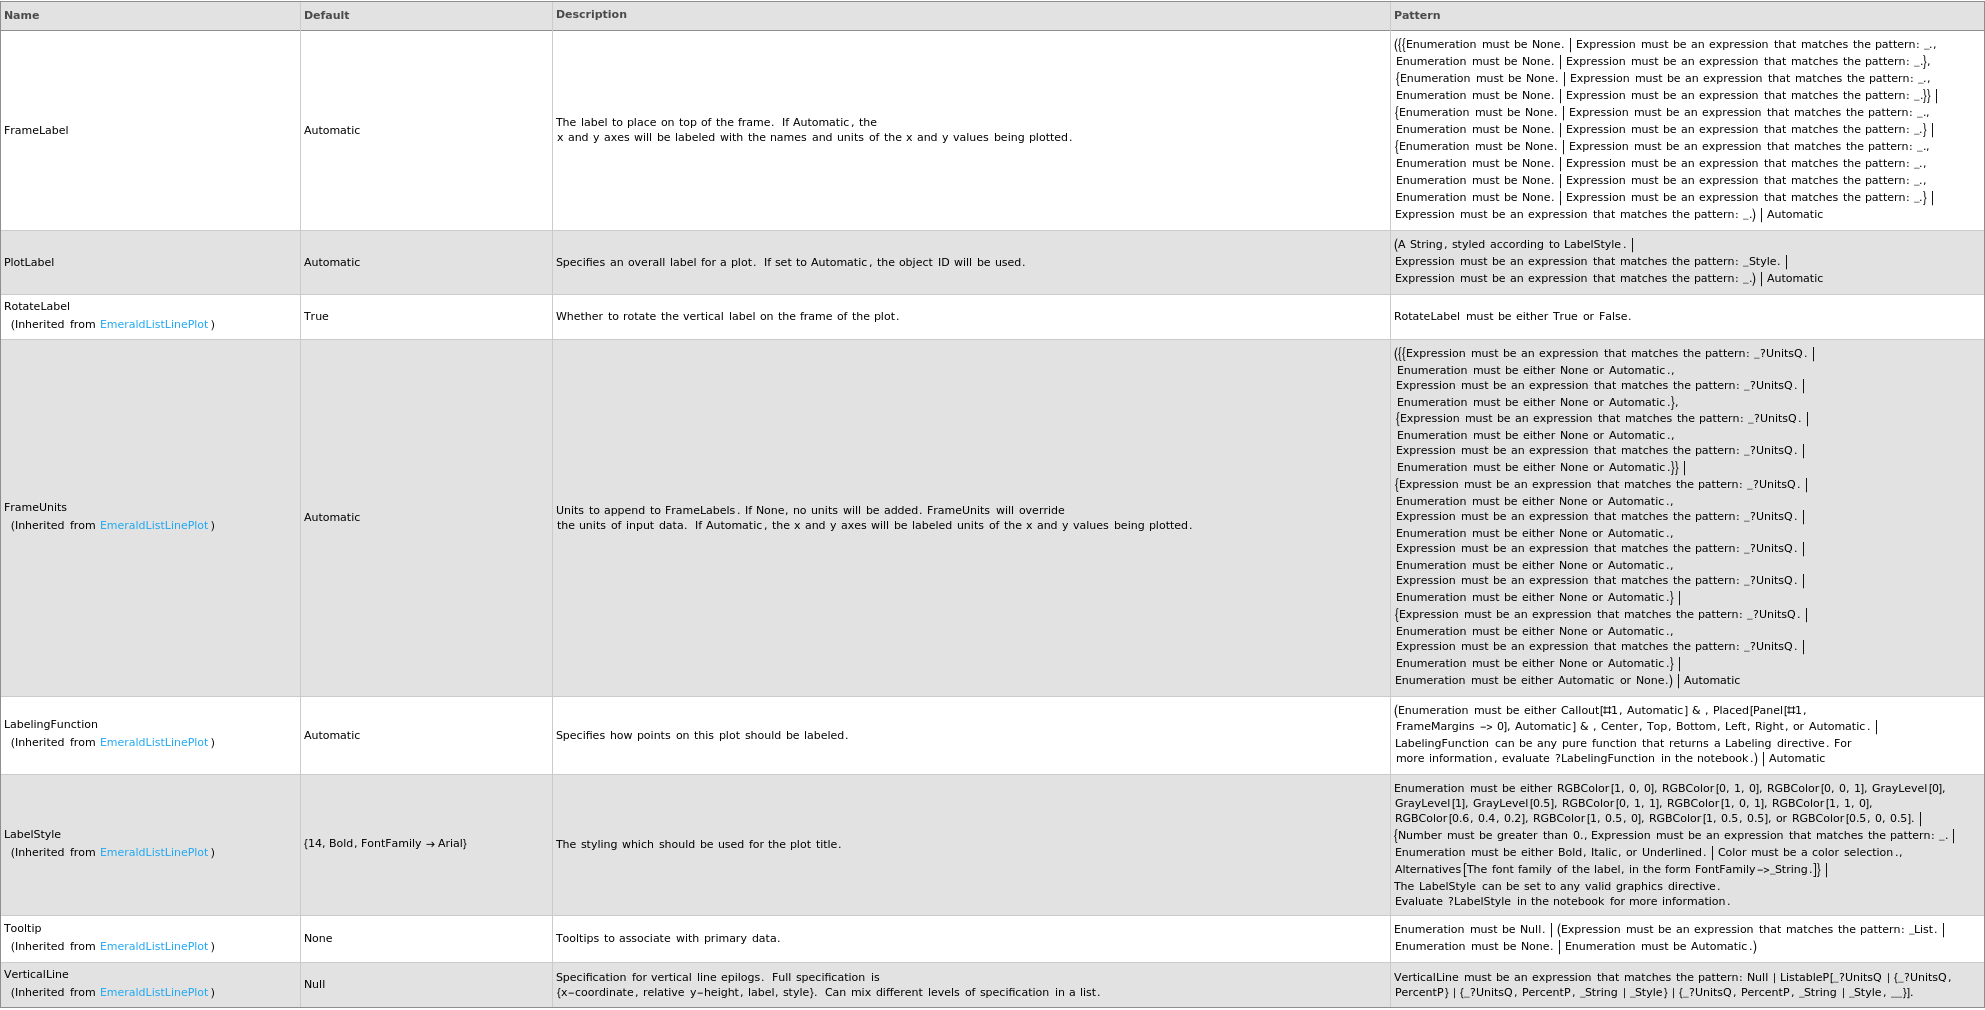
Plot Labeling Options
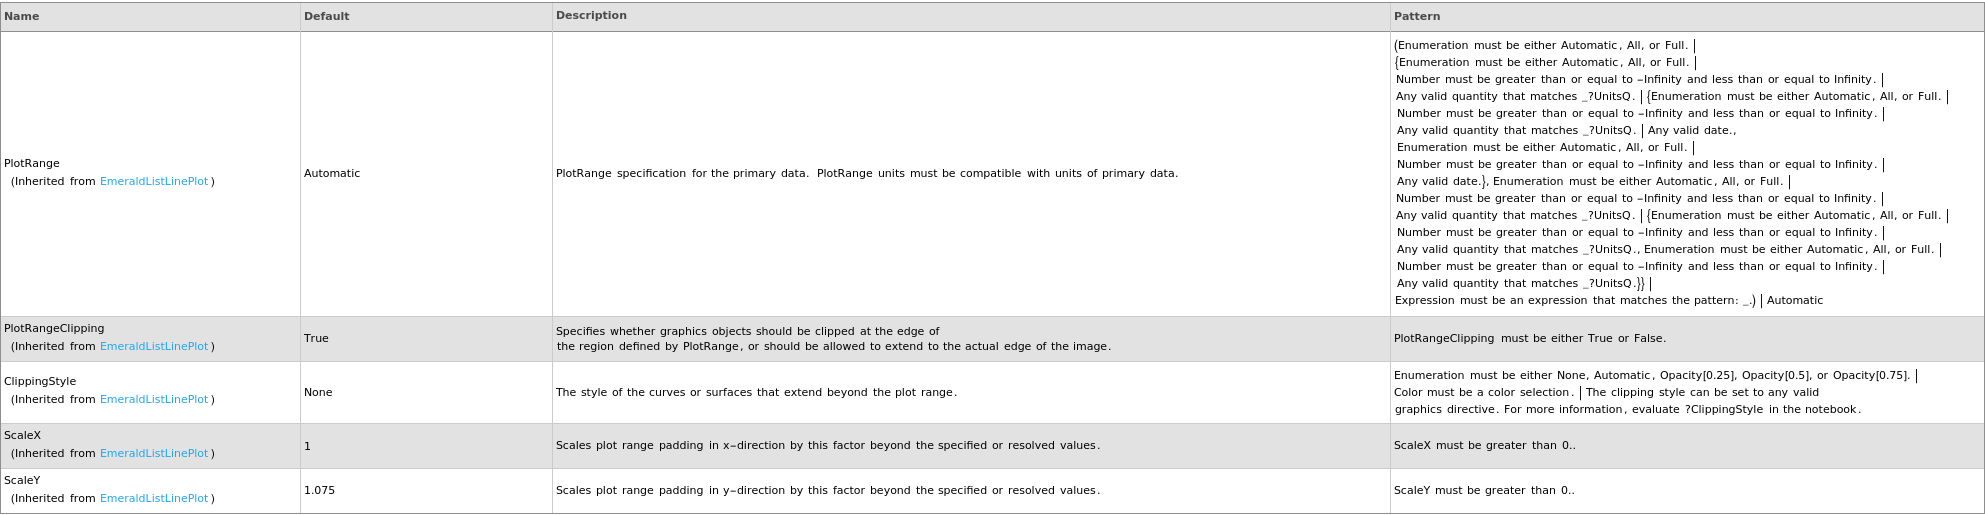
Plot Range Options
Plot Style Options
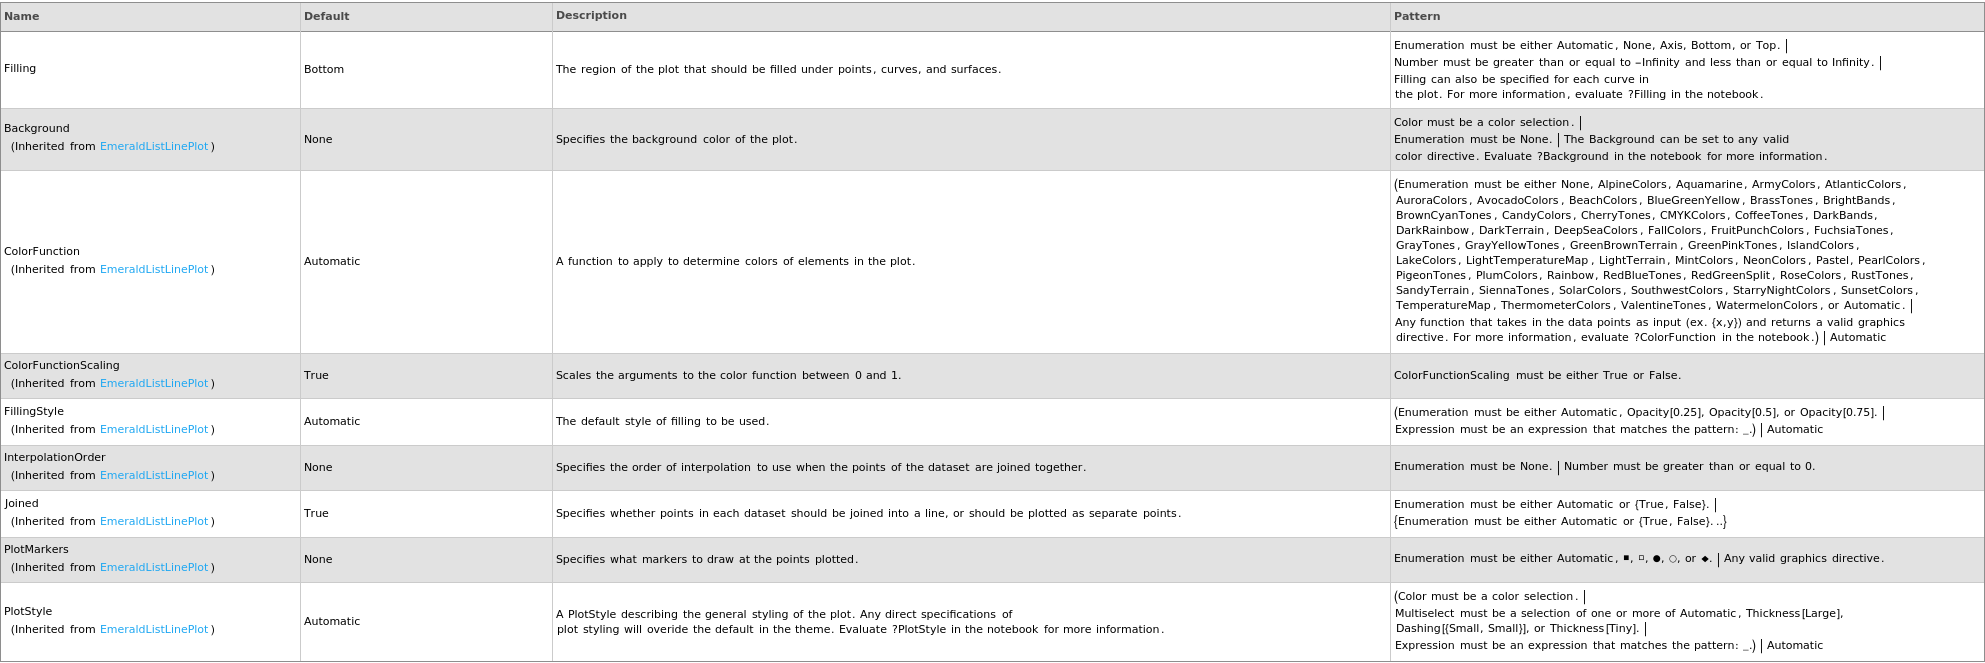
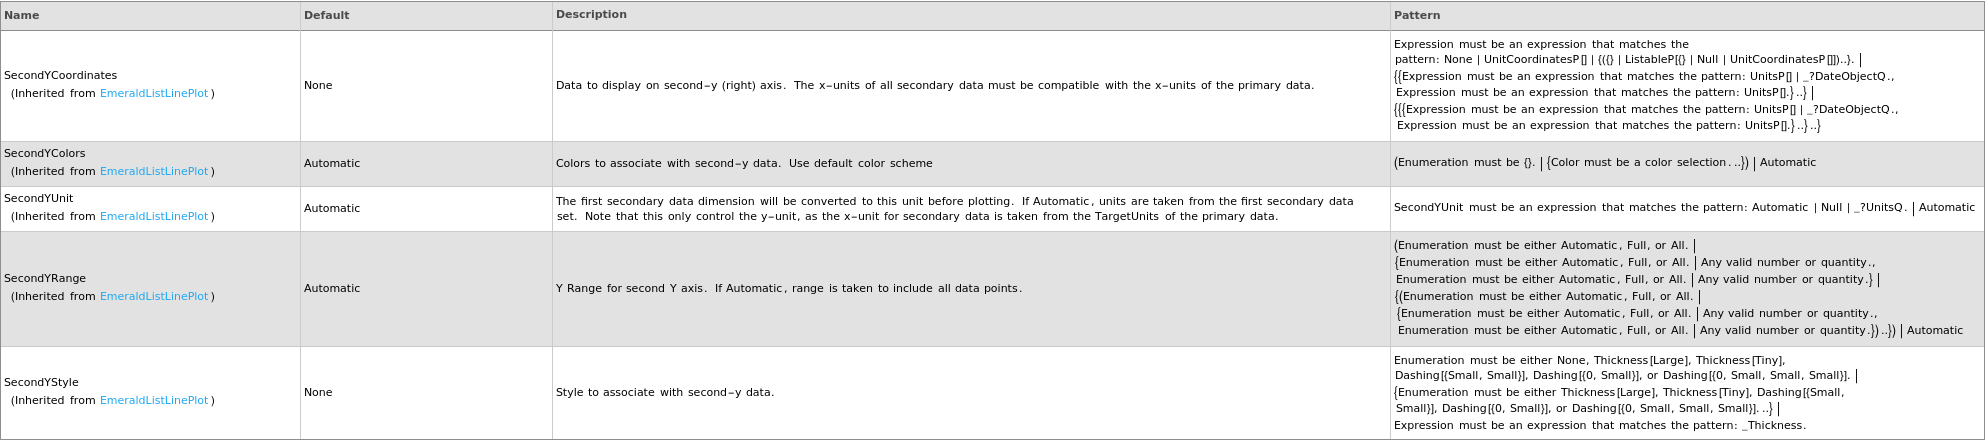
Secondary Data Options
General Options
Examples
open allclose allBasic Examples (4)
Options (21)
Boxes (1)
IncludeReplicates (1)
Last modified on Wed 8 Oct 2025 10:00:47