PlotLuminescenceKinetics
PlotLuminescenceKinetics[LuminescenceKineticsData]⟹Plot
displays emission trajectories from the supplied LuminescenceKineticsData.
PlotLuminescenceKinetics[Protocol]⟹Plot
creates a Plot of the emission trajectories found in the Data field of Protocol.
PlotLuminescenceKinetics[EmissionTrajectoryData]⟹Plot
displays luminescence vs time when given a set of raw 'emissionTrajectories'.
Details
Input

Output

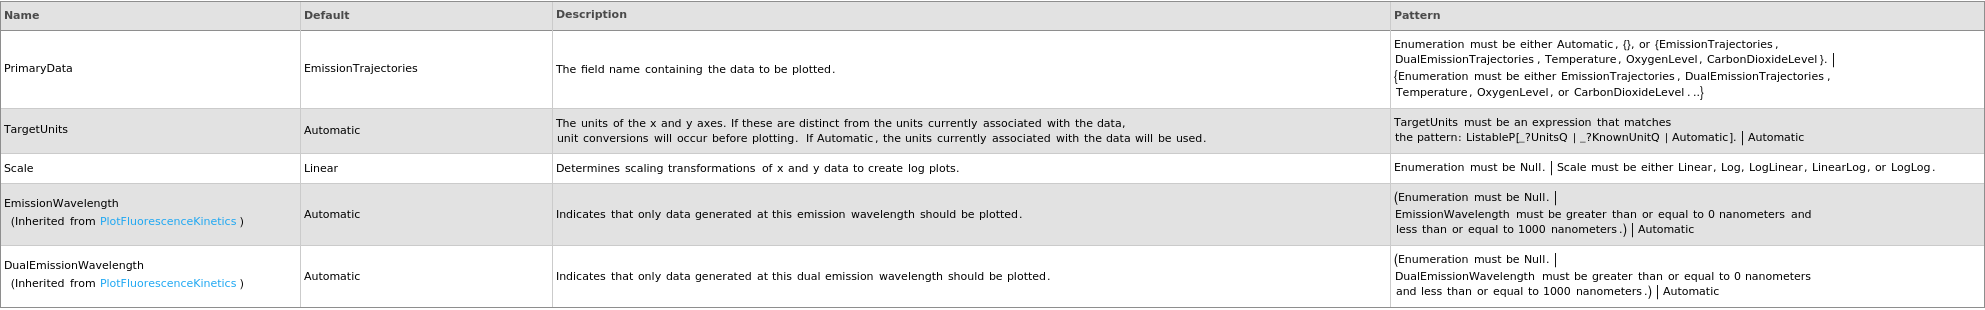
Data Specifications Options
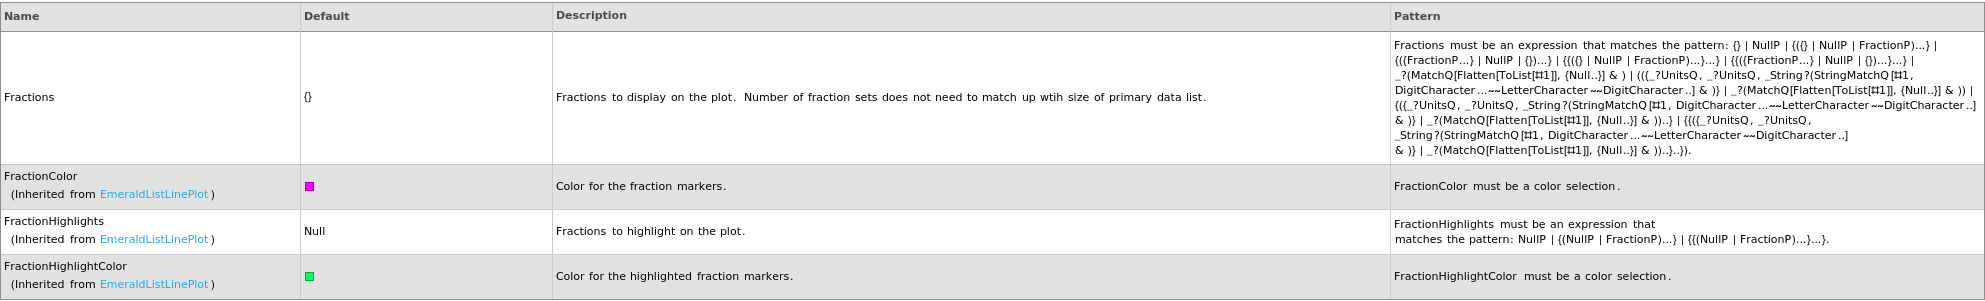
Fractions Options
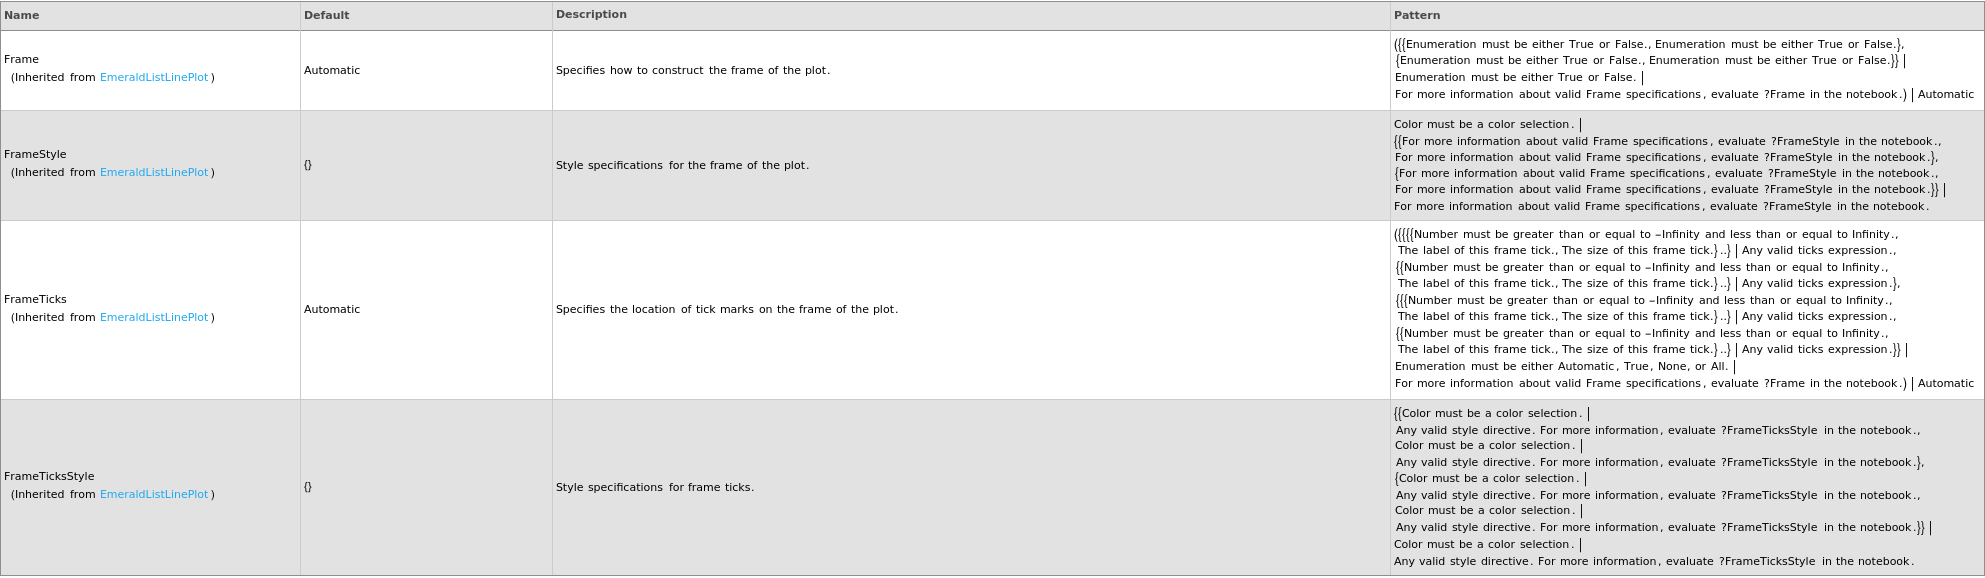
Frame Options
Grid Options
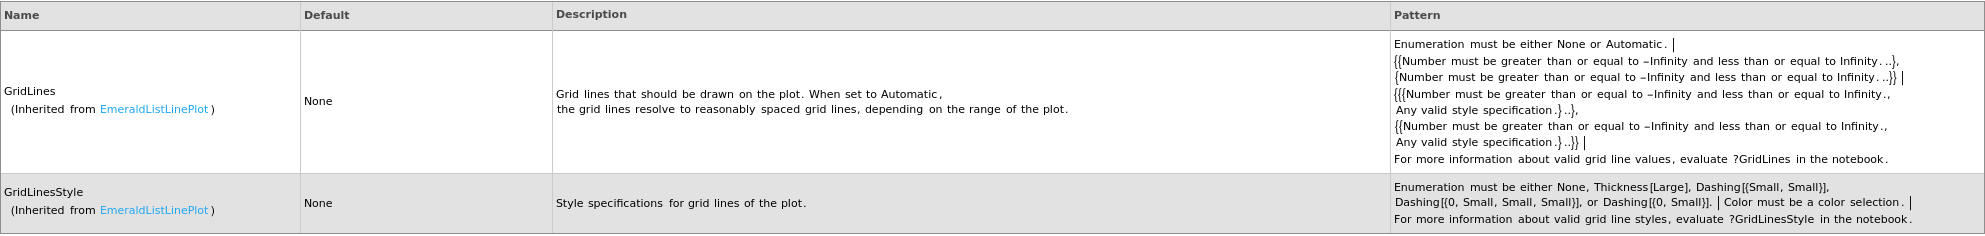
Image Format Options

Legend Options

Plot Labeling Options
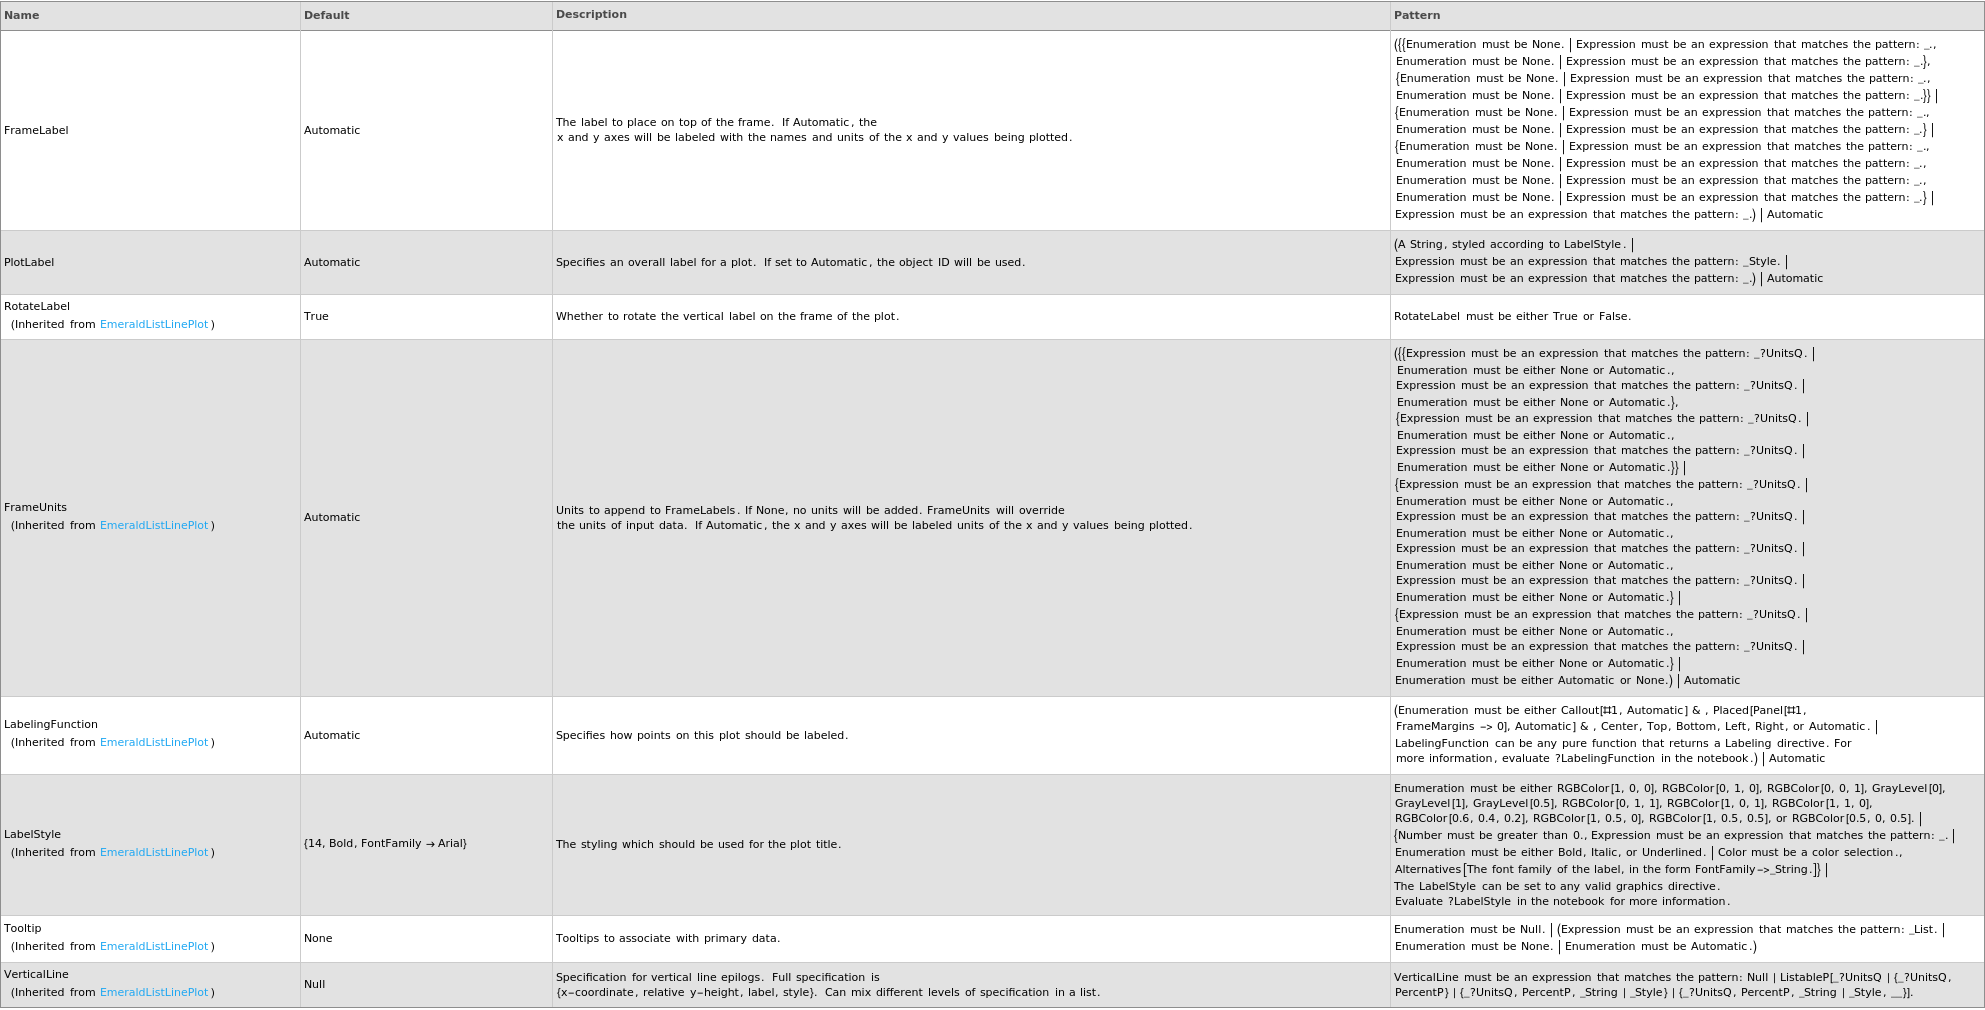
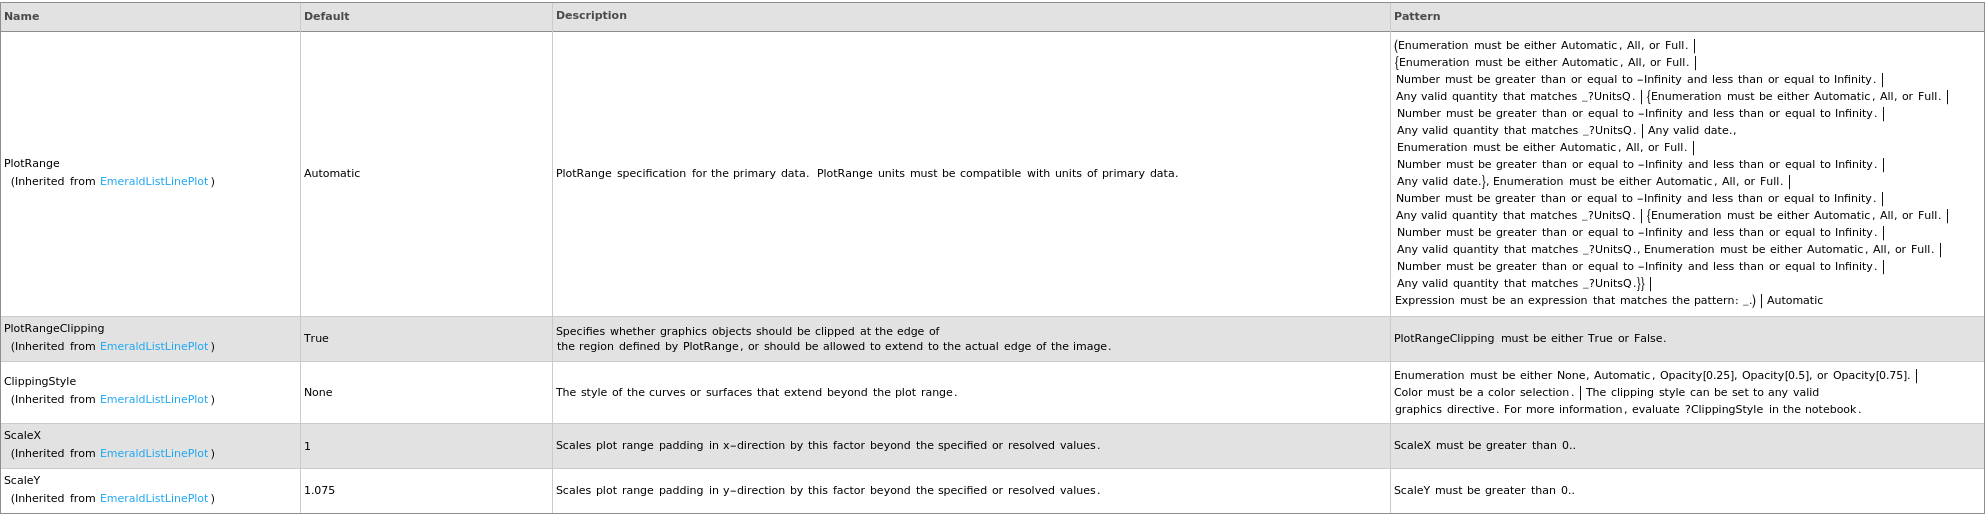
Plot Range Options
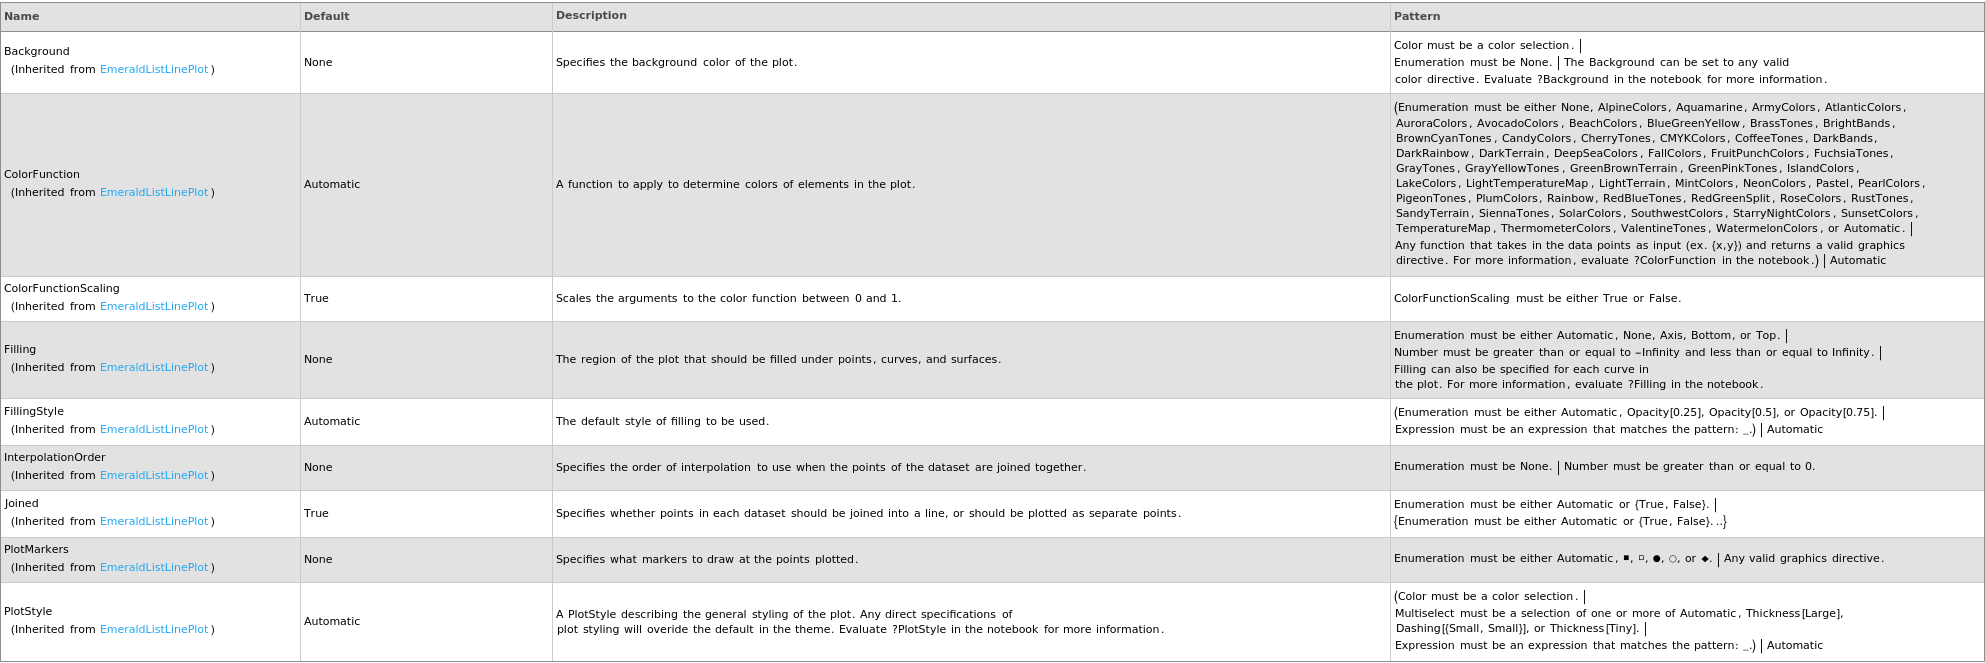
Plot Style Options
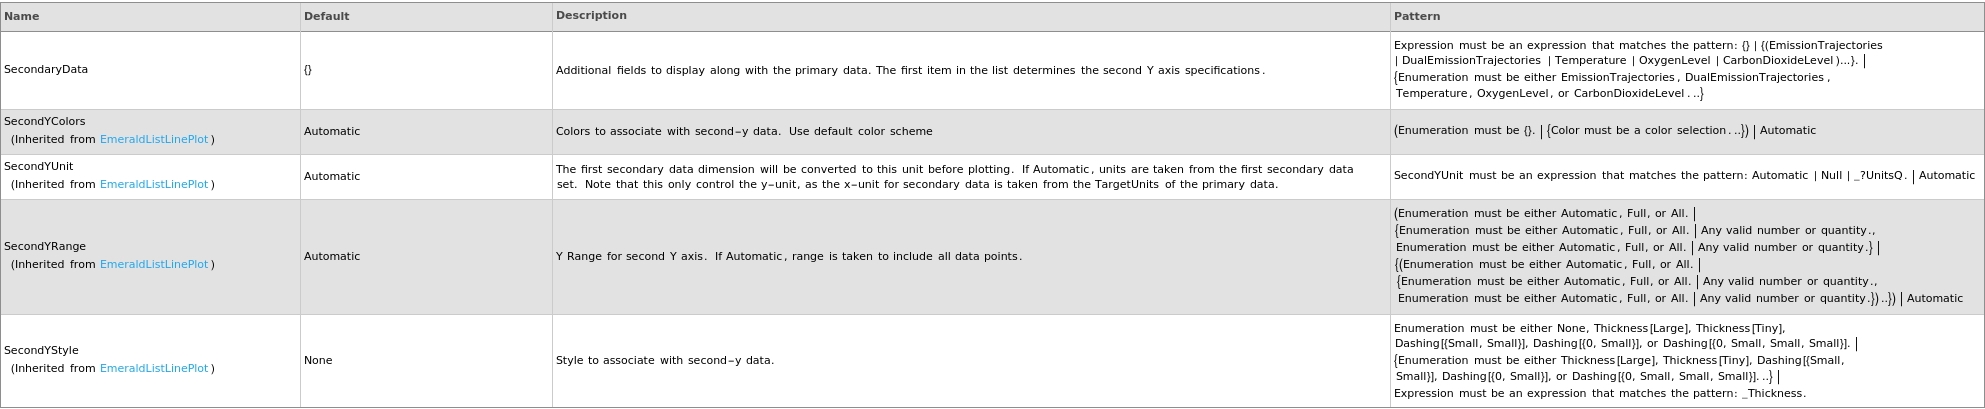
Secondary Data Options
General Options

Examples
open allclose allBasic Examples (6)
Plot a raw emission trajectory:
Plot multiple raw emission trajectories:
Plot the luminescence trajectory and temperature trace of the data of interest:
Plot the luminescence trajectory for a given data object:
Plot the luminescence trajectory for data objects linked to a LuminescenceKinetics protocol object:
Options (22)
Boxes (1)
DualEmissionTrajectories (1)
EmissionTrajectories (1)
IncludeReplicates (1)
PlotTheme (1)
Last modified on Wed 20 Aug 2025 22:43:00