PlotObject
PlotObject[Object]⟹Fig
creates a plot of the information in Object using a style determined by the SLL Type of Object.
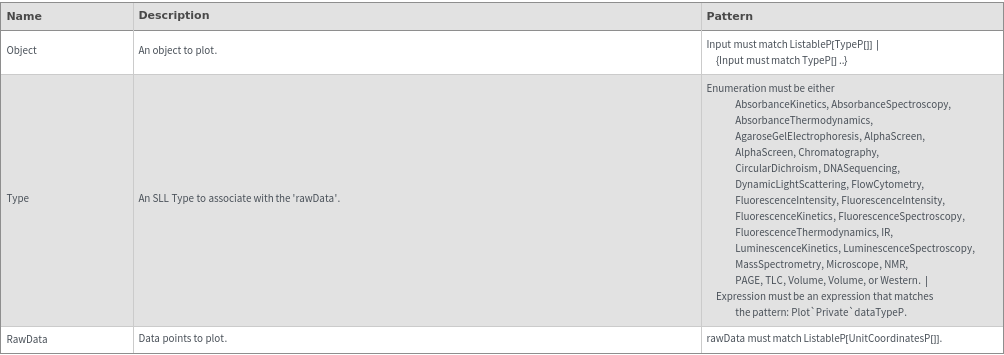
PlotObject[Type,RawData]⟹Fig
plots RawData in the appropriate plot style for Type.
Details
- Given a Constellation object as input, PlotObject automatically determines the appropriate function to plot the object.
- To check which plot function PlotObject redirects to, please run PlotObjectFunction[myInput] in the notebook.
- See the Examples below for a list of possible plot functions, and links to their respective documentation pages.
-
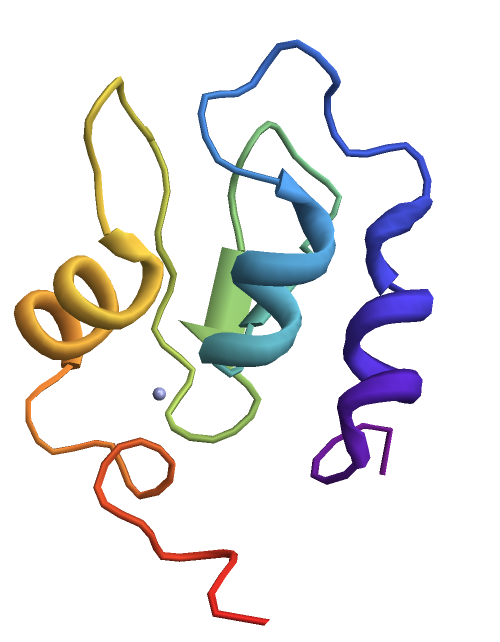
NoStructureAvailable No Molecule or StructureImageFile is set for `1`
Input
Output

Messages
Examples
PlotAbsorbanceQuantification (3)
PlotAbsorbanceQuantification Documentation
Plot absorbance spectroscopy data from a link:

Plot the Object[Data,AbsorbanceSpectroscopy] associated with an Object[Analysis,AbsorbanceQuantification] object:

Plot the Object[Data,AbsorbanceSpectroscopy] associated with an protocol[AbsorbanceQuantification] object:


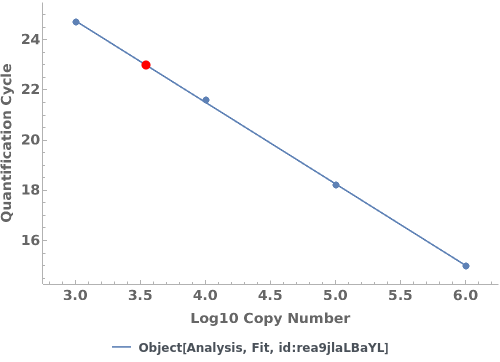
PlotCopyNumber (2)


PlotFractions (4)


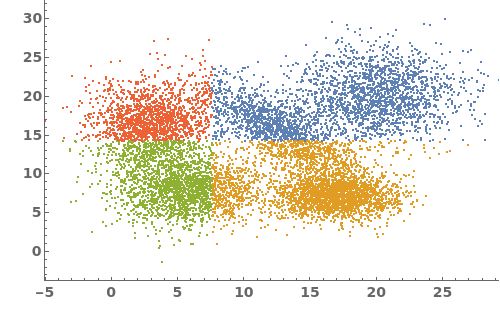
PlotGating (3)


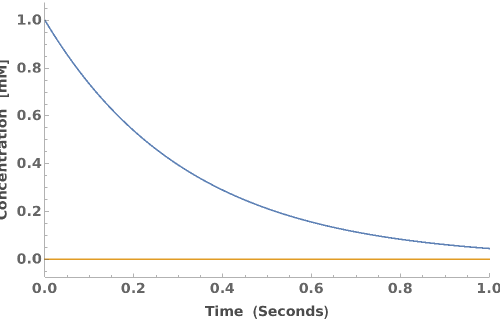
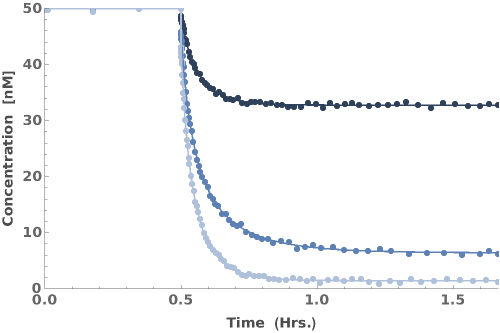
PlotKineticRates (1)

PlotLadder (2)


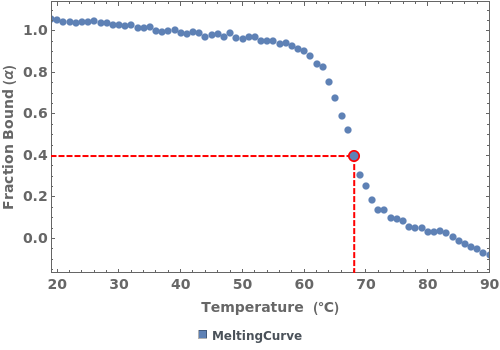
PlotMeltingPoint (3)


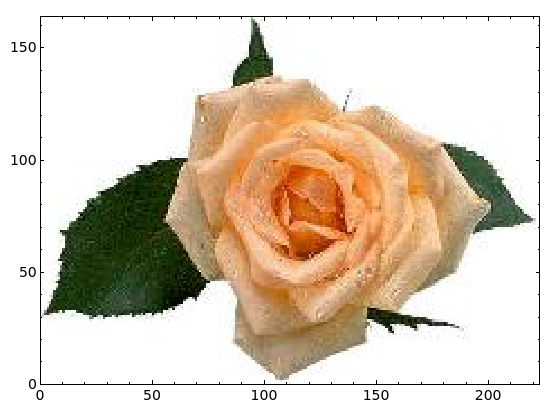
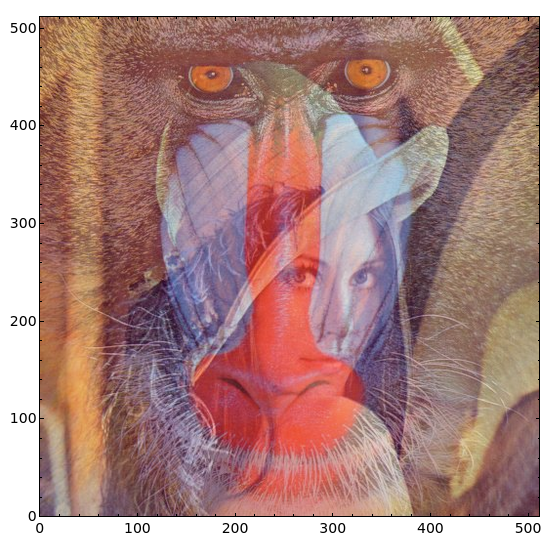
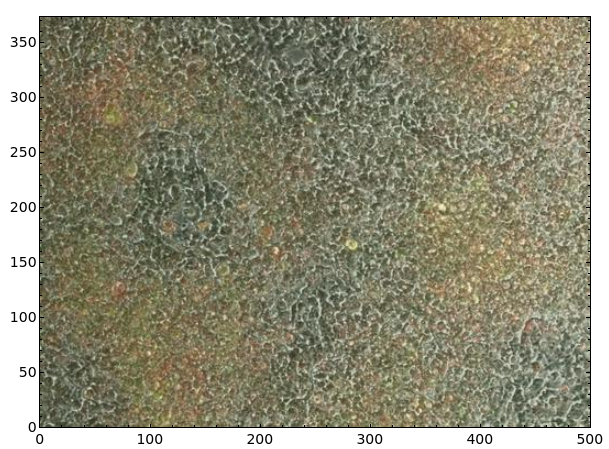
PlotMicroscopeOverlay (2)


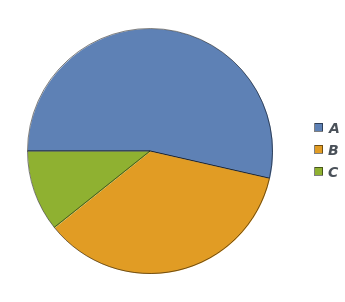
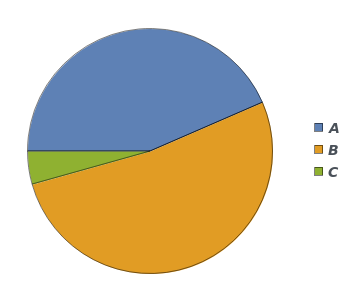
PlotPeaks (5)
Plot peak analysis from a link:


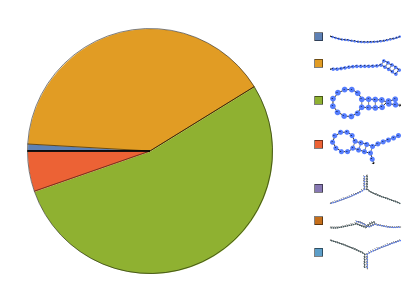
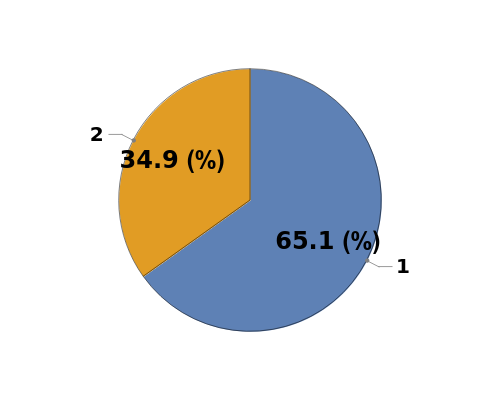
Plot the areas of a set of peak purities as a labeled pie chart:

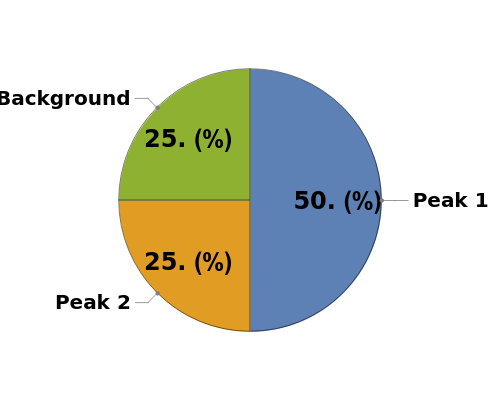
Plot the peak purity from an Object[Analysis,Peaks] Object as a pie chart:

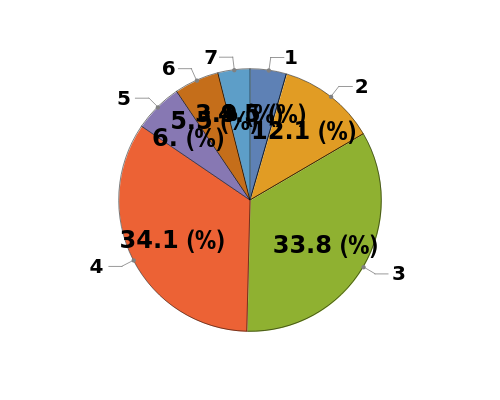
Plot the peaks associated with a single Object[Data,Chromatography] object as a pie chart of peak purity:

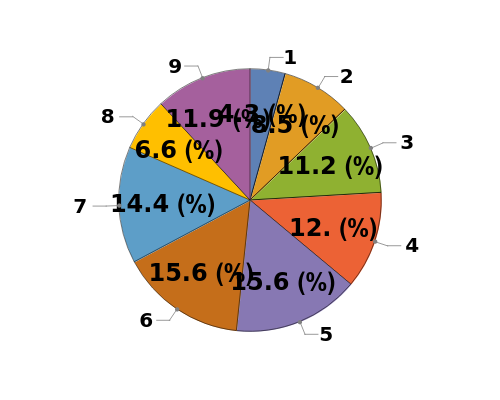
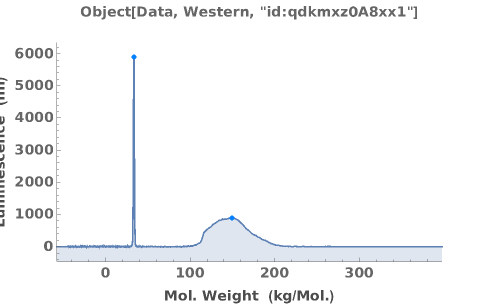
Plot the peaks associated with a single Object[Data,Western] object as a pie chart of peak purity:

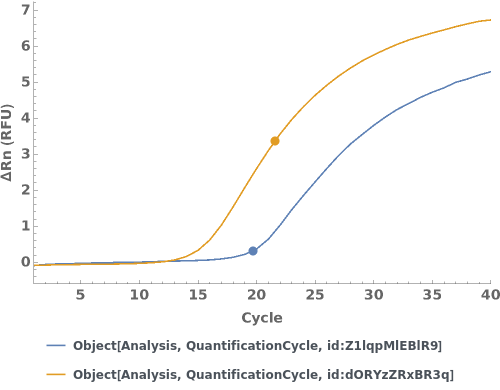
PlotQuantificationCycle (2)
PlotQuantificationCycle Documentation
Given a quantification cycle analysis object, creates a plot for the analysis object:

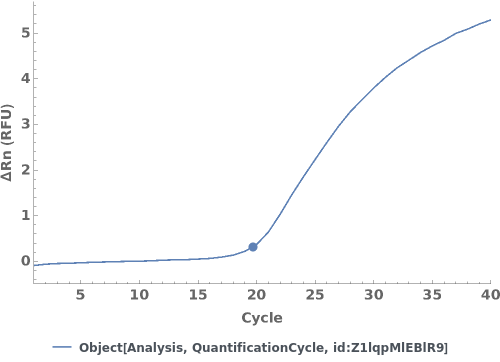
Given multiple quantification cycle analysis objects, creates a plot for the analysis objects:

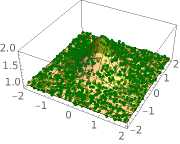
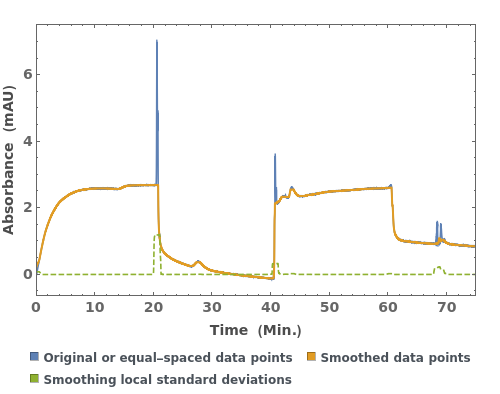
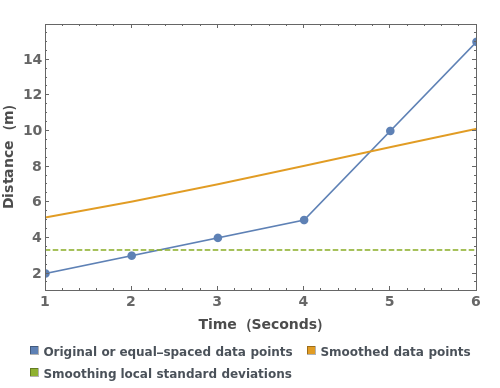
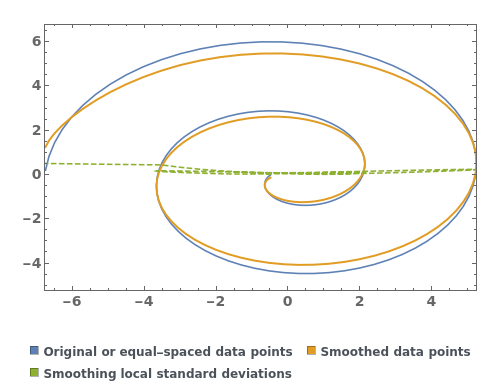
PlotSmoothing (3)


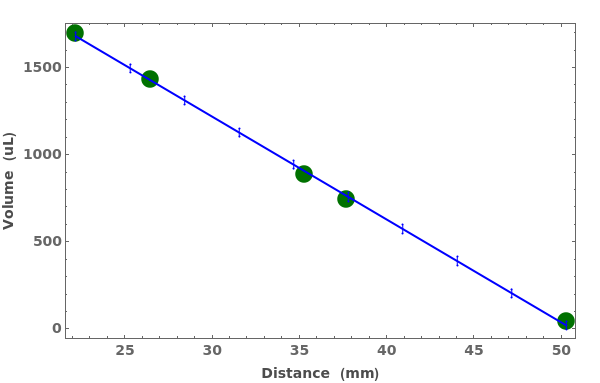
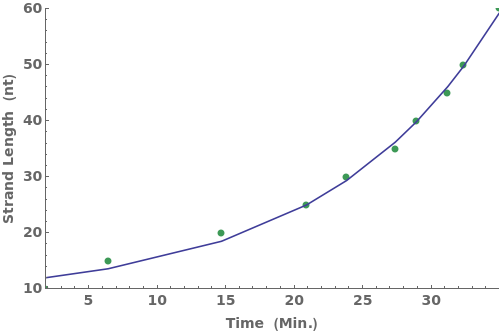
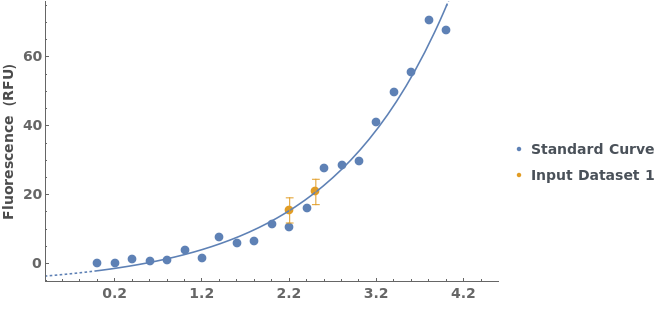
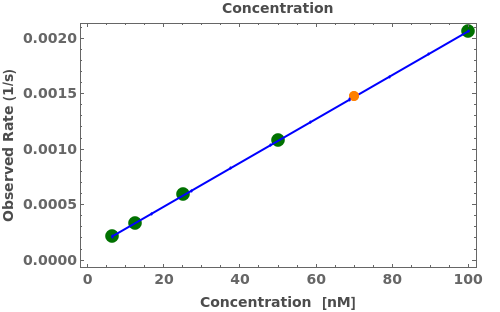
PlotStandardCurve (3)
PlotStandardCurve Documentation
Add a frame and a title to the plot of a standard curve analysis:

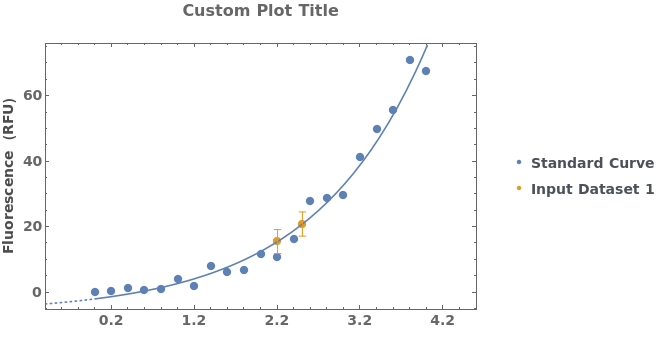
Given a list of standard curve analyses, generate a list of standard curve plots:

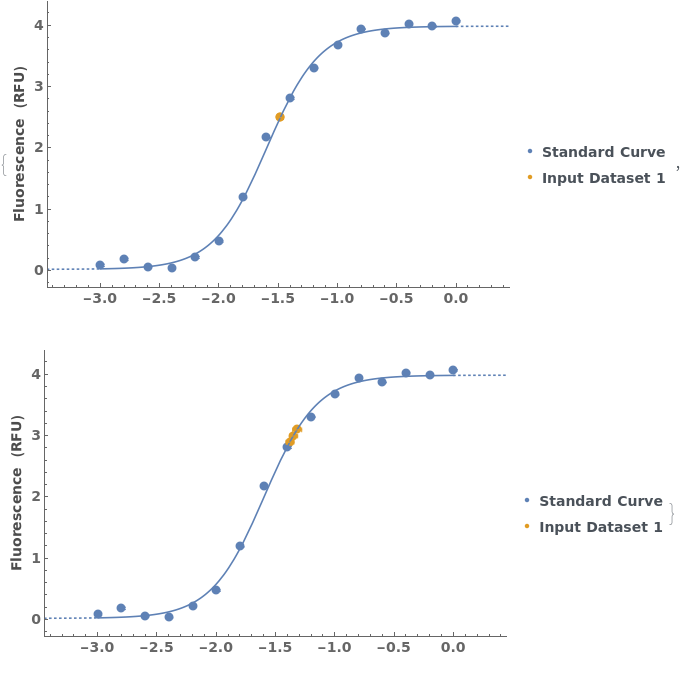
Plot the results of a standard curve analysis:

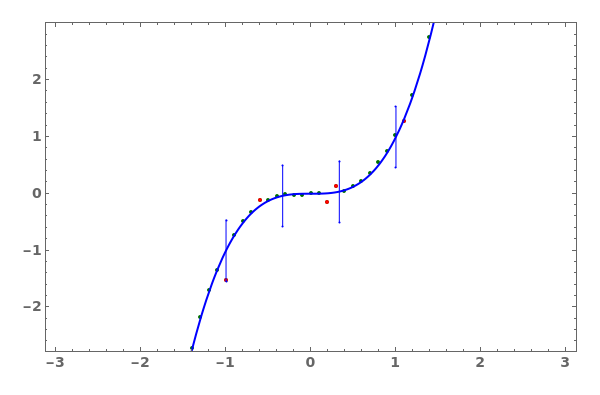
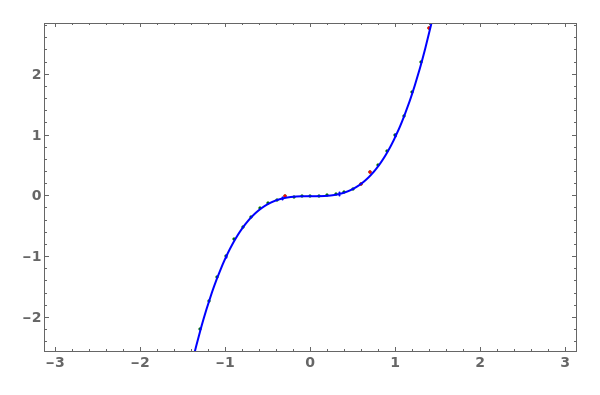
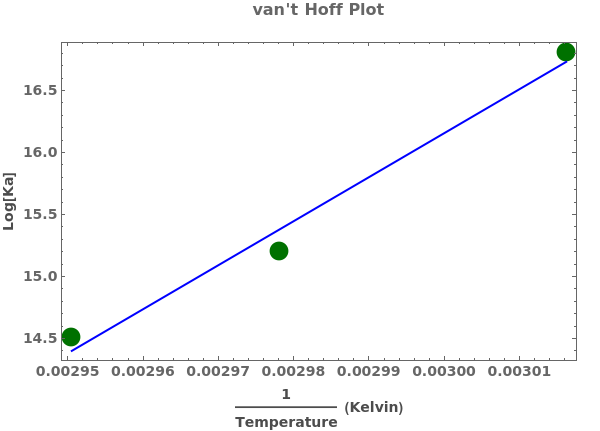
PlotThermodynamics (3)
PlotThermodynamics Documentation

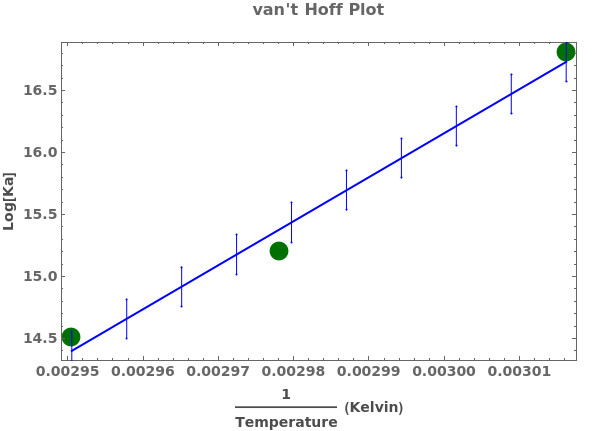
Plot a thermodynamics analysis object:

Plot a thermodynamics analysis object with only fitted curve and no errorbars:

PlotAbsorbanceKinetics (4)
PlotAbsorbanceKinetics Documentation
Plots absorbance kinetics data when given a list of XY coordinates representing the spectra:

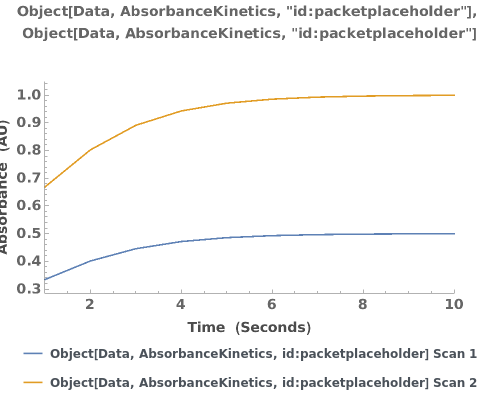
Plots absorbance kinetics data when given an AbsorbanceKinetics data link:

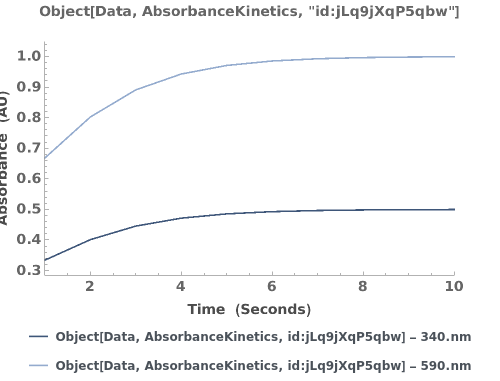
Plots multiple sets of data on the same graph:

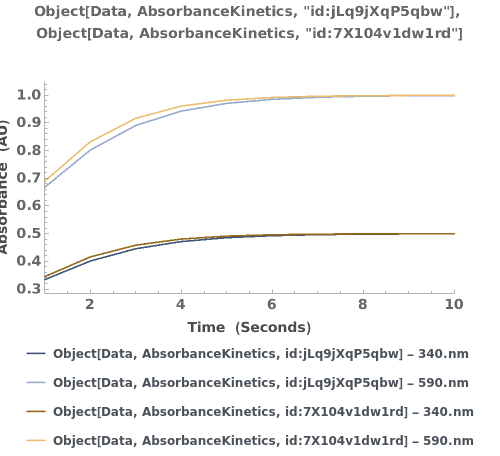
Plots the absorbance trajectory in an AbsorbanceKinetics data object:

PlotAbsorbanceSpectroscopy (4)
PlotAbsorbanceSpectroscopy Documentation
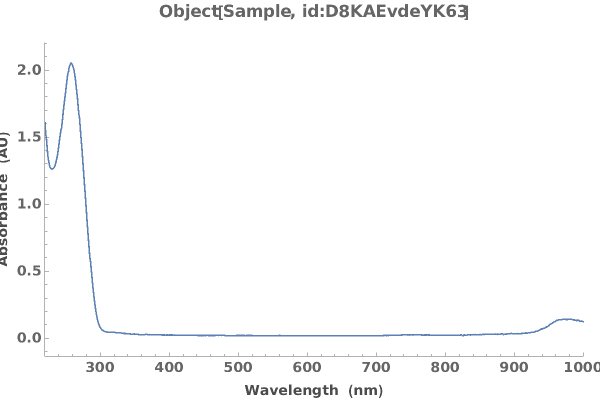
Plots absorbance spectroscopy data when given a list of XY coordinates representing the spectra:

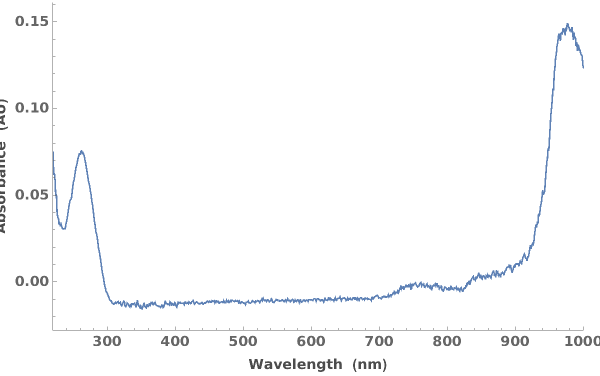
Plots absorbance spectroscopy data when given an AbsorbanceSpectroscopy data link:

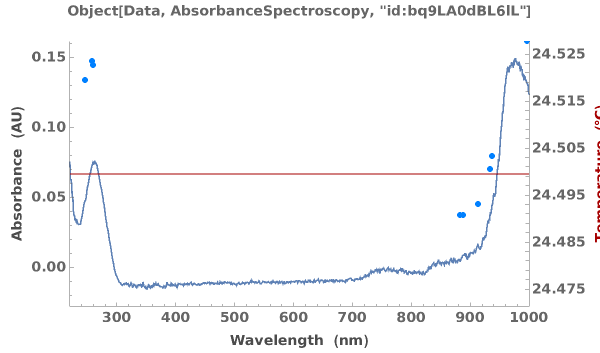
Plots absorbance spectroscopy data when given an AbsorbanceSpectroscopy data object:

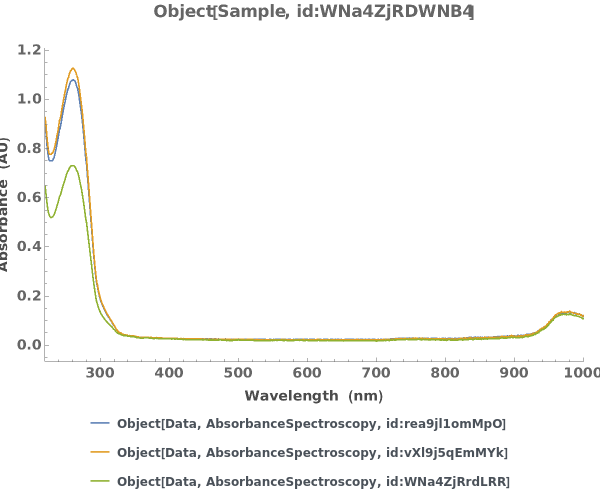
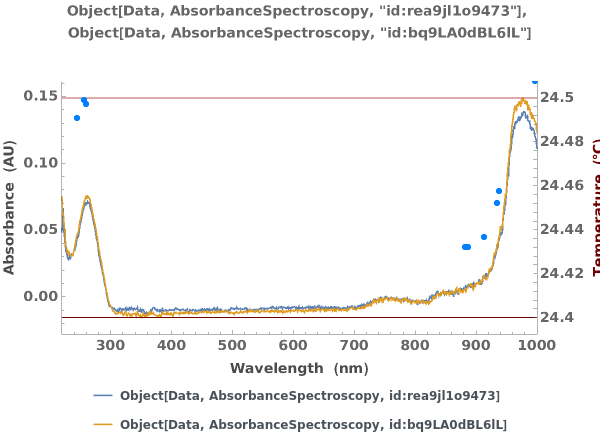
Plots multiple sets of data on the same graph:

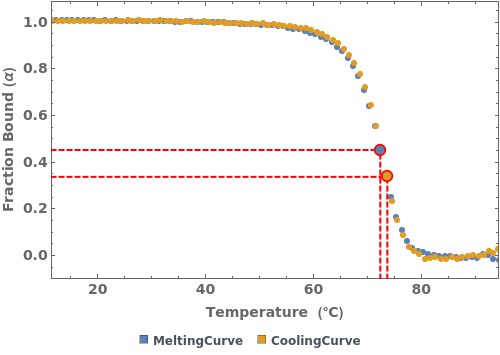
PlotAbsorbanceThermodynamics (5)
PlotAbsorbanceThermodynamics Documentation
Plot only the cooling curve from the data object:

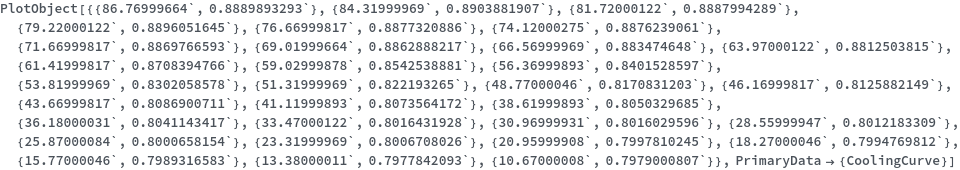
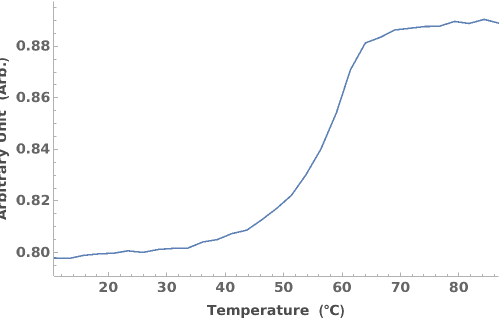
Plots absorbance thermodynamics object in a link:

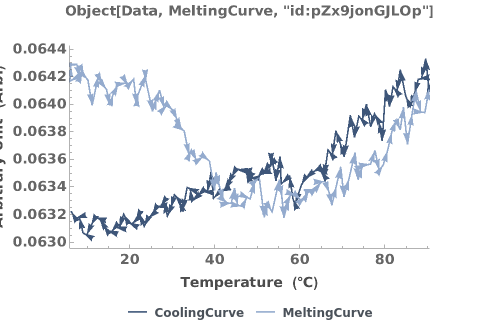
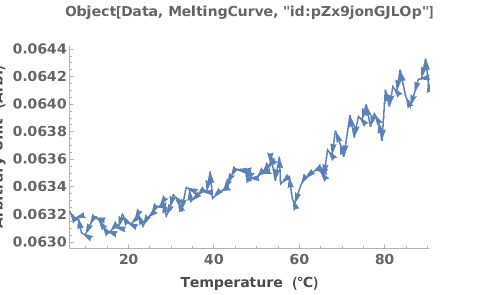
Plots all primary data fields present in the absorbance thermodynamics data object:

Plots the Melting and Cooling curve when both are present in the absorbance thermodynamics data object:
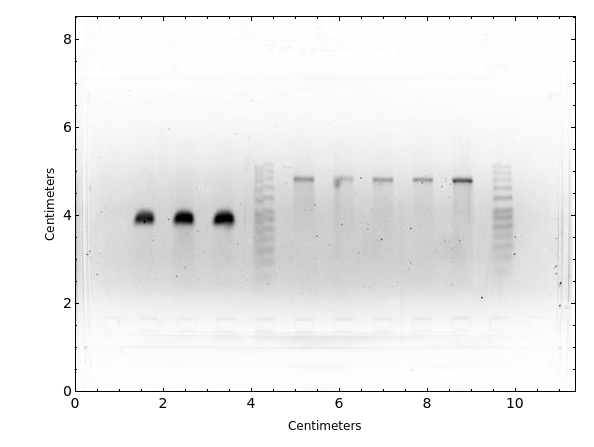
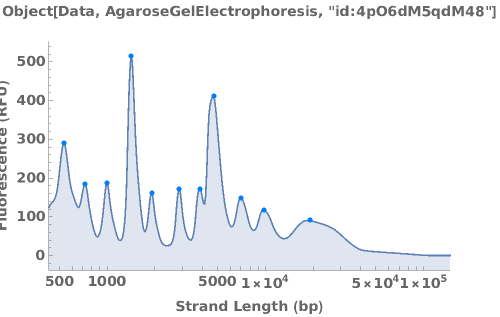
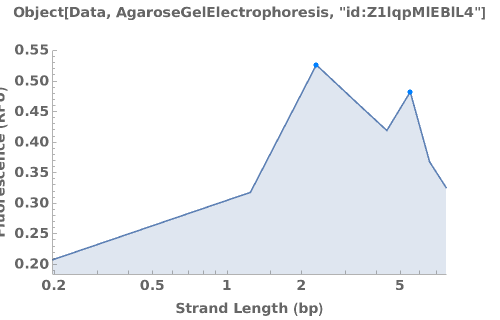
PlotAgarose (3)


PlotBindingQuantitation (2)
PlotBindingQuantitation Documentation
Given an analyzed Object[Data,BioLayerInterferometry], PlotBindingQuantitation returns an plot:

Given an Object[Analysis,BindingQuantitation], PlotBindingQuantitation returns an plot:

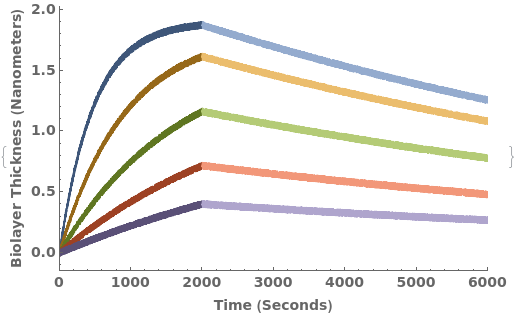
PlotBioLayerInterferometry (3)
PlotBioLayerInterferometry Documentation
Given an analyzed Object[Data,BioLayerInterferometry] with kinetics data, PlotBioLayerInterferometry returns an plot:

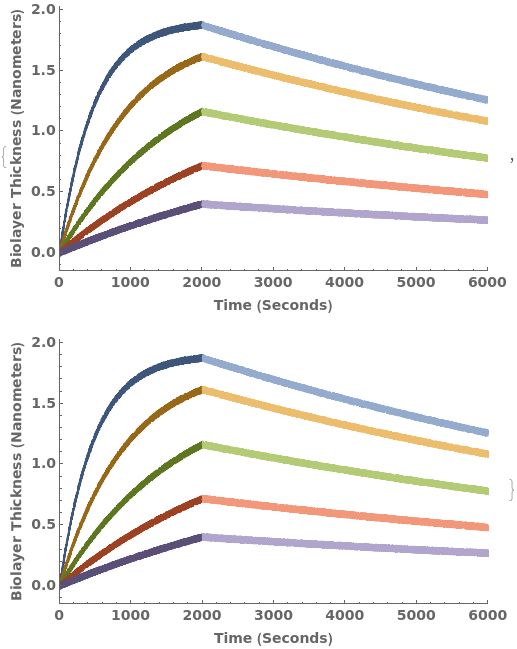
Given an Object[Protocol,BioLayerInterferometry] with associated kinetics data, PlotBioLayerInterferometry returns plot for all associated data objects:

Given an unanalyzed Object[Data,BioLayerInterferometry] with kinetics data, PlotBioLayerInterferometry returns an plot:
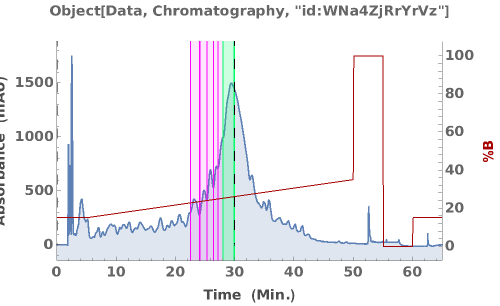
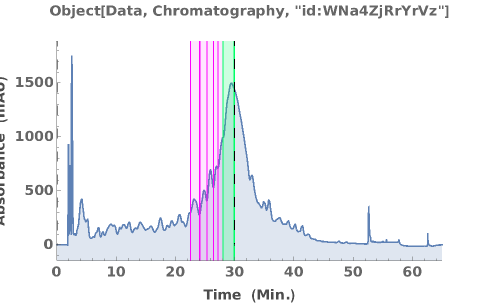
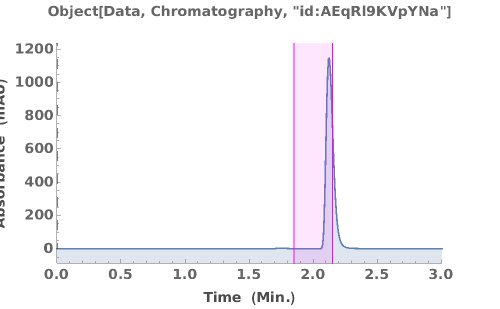
PlotChromatography (3)
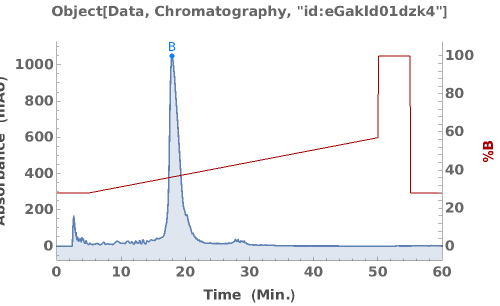
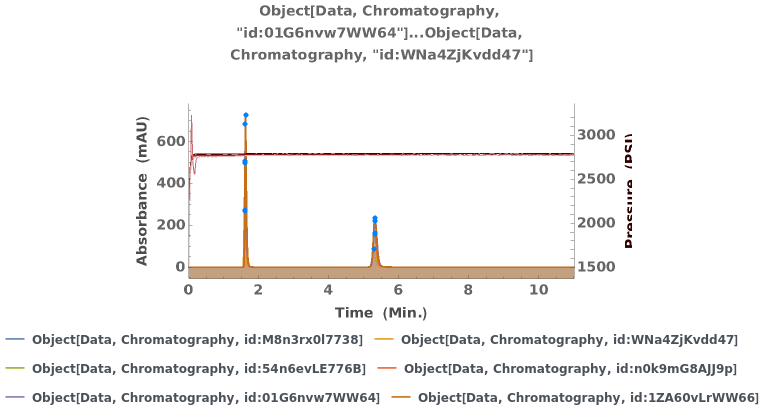
PlotChromatography Documentation
Generate an interactive plot of the data in the chromatography object:

Overlay several chromatograms in an interactive plot:

Plots absorbance data during an LCMS run:

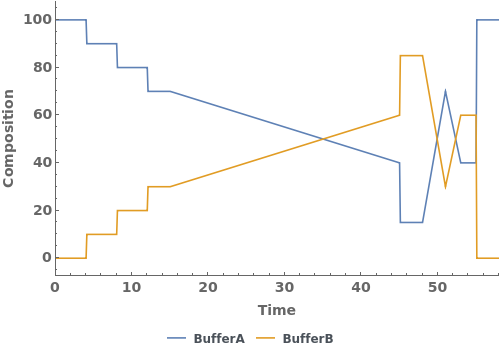
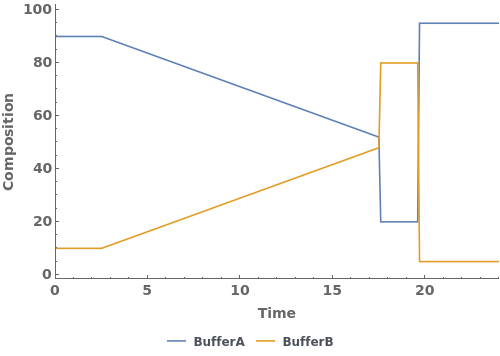
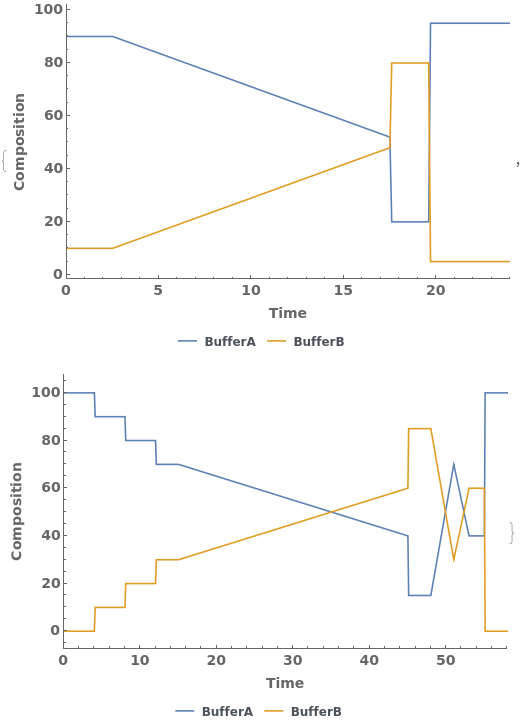
PlotCrossFlowFiltration (3)
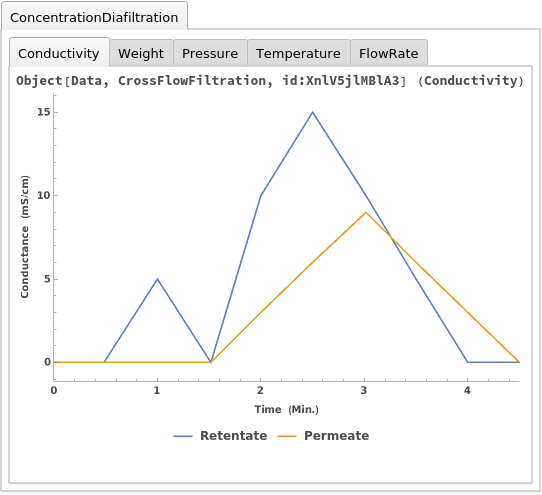
PlotCrossFlowFiltration Documentation
Plot the results of an ExperimentCrossFlowFiltration using a data object as input:

Plot the results of an ExperimentCrossFlowFiltration using a list of data objects as input:

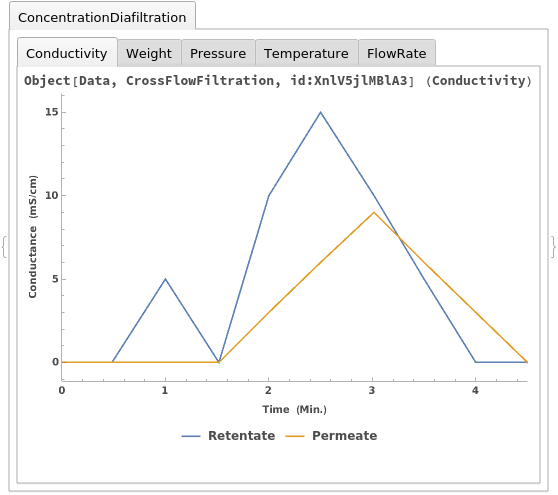
Plot the results of an ExperimentCrossFlowFiltration using a protocol object as input:

PlotConductivity (3)
PlotConductivity Documentation
Plot multiple conductivity data on the same plot:

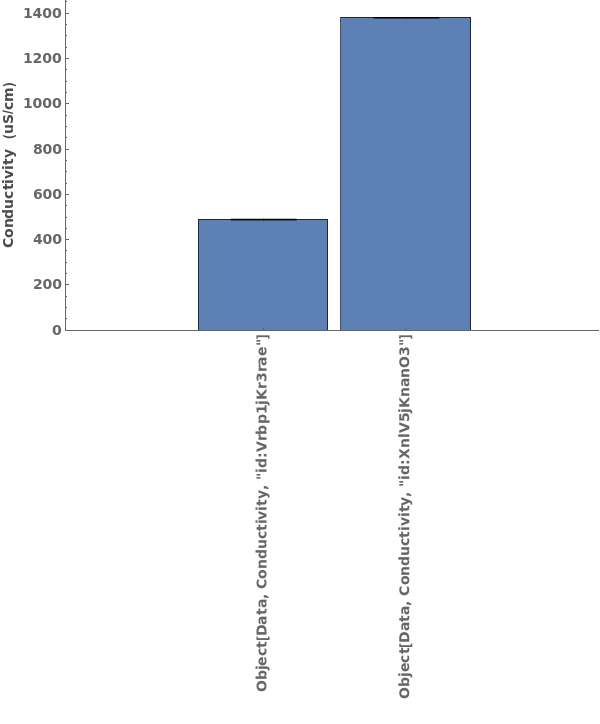
Plots conductivity data when given a conductivity data object:

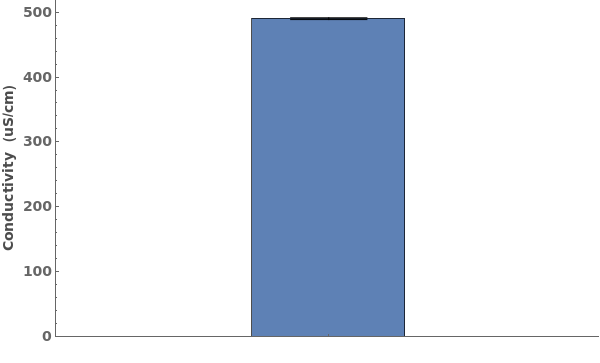
Plots conductivity data when given a conductivity data object when given a data link:

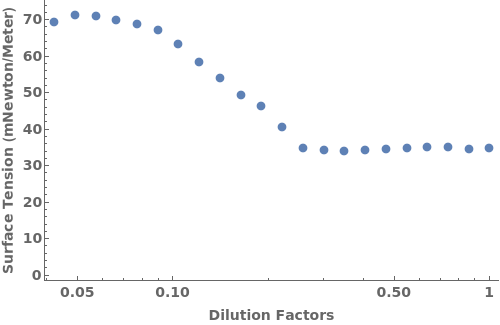
PlotCriticalMicelleConcentration (2)
PlotCriticalMicelleConcentration Documentation
Given an analyzed Object[Data,SurfaceTension], PlotCriticalMicelleConcentration returns an plot:

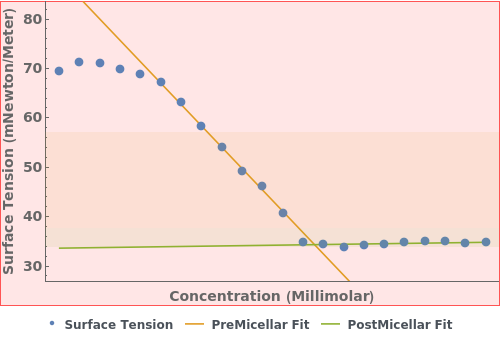
Given an Object[Analysis,CriticalMicelleConcentration], PlotCriticalMicelleConcentration returns an plot:

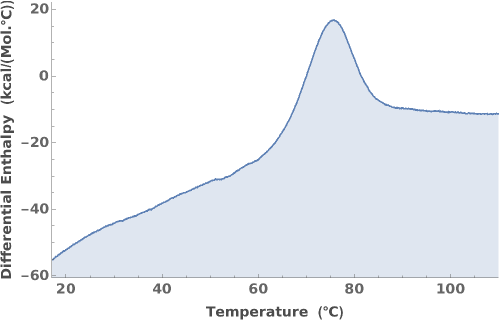
PlotDifferentialScanningCalorimetry (2)
PlotDifferentialScanningCalorimetry Documentation
Plot DifferentialScanningCalorimetry data:

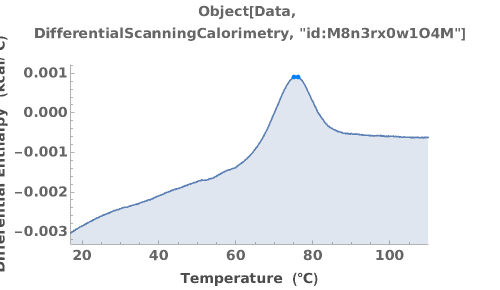
Plot DifferentialScanningCalorimetry data using the raw data:

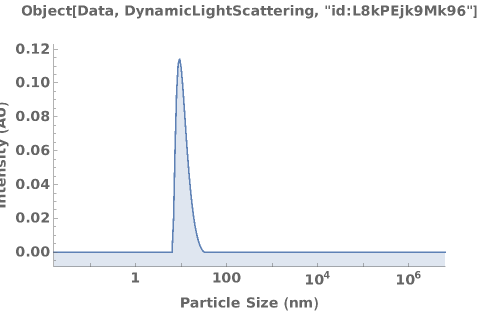
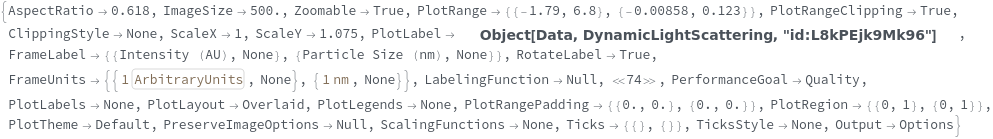
PlotDynamicLightScattering (4)
PlotDynamicLightScattering Documentation
Given a DynamicLightScattering data object, creates a plot for the MassDistribution if AssayType is SizingPolydispersity, ZAverageDiameters if the AssayType is IsothermalStability, KirkwoodBuffIntegral if the AssayType is G22, and PolydispersityIndicies if the AssayType is B22kD:

Return a dynamic figure when Output->Preview:


Return a list of resolved options when Output->Option:

Return a list of resolved options when Output->Tests:


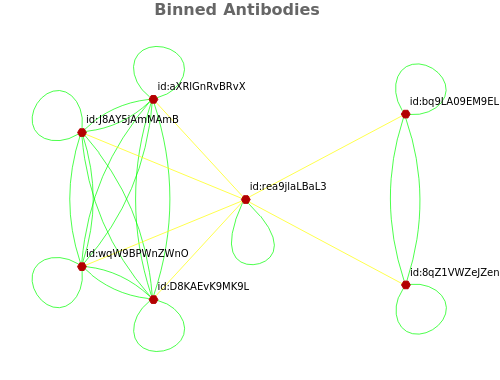
PlotEpitopeBinning (2)
PlotEpitopeBinning Documentation
Returns a graph showing the binned antibodies:

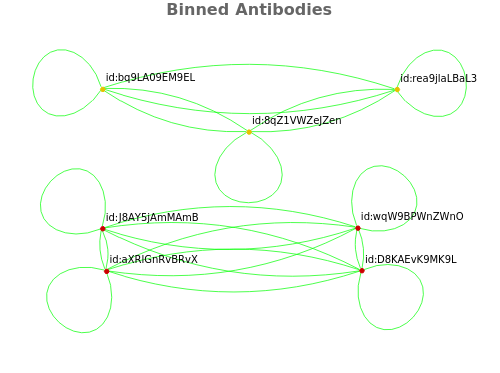
Returns a graph showing the binned antibodies:

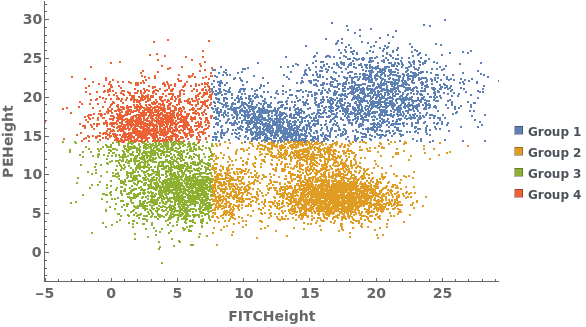
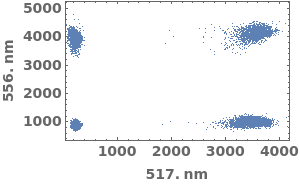
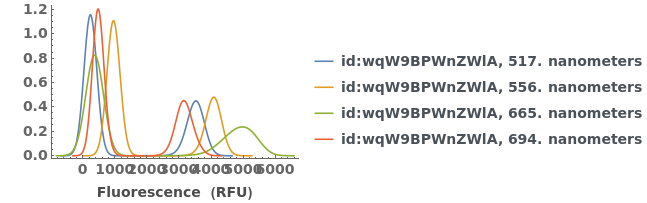
PlotFlowCytometry (3)
PlotFlowCytometry Documentation
Compare mutliple flow cytometry data sets:

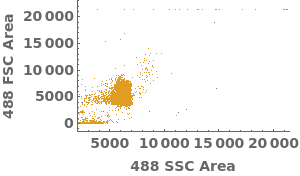

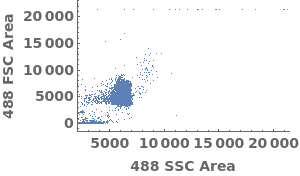
Plot flow cytometry data in a link:

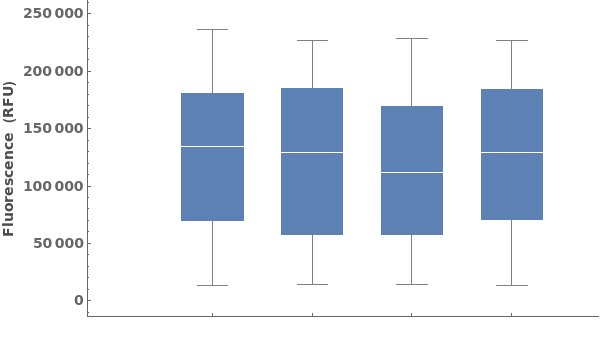
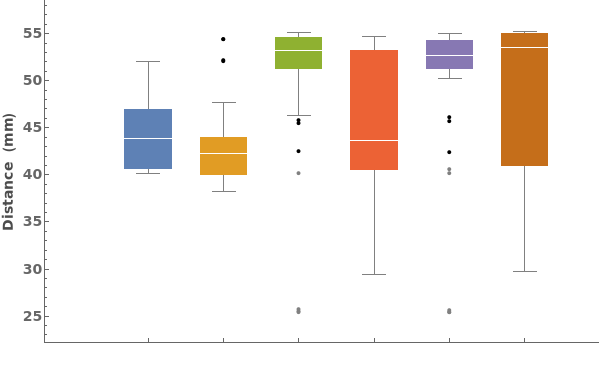
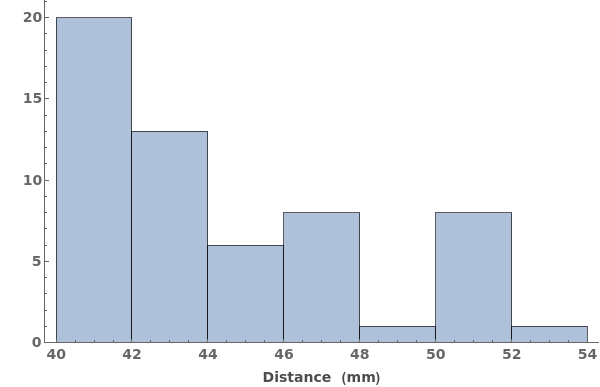
PlotFluorescenceIntensity (4)
PlotFluorescenceIntensity Documentation
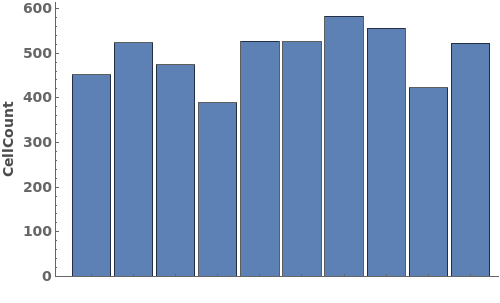
Compare intensities across datasets using a BoxWhiskerChart:

Plot a histogram of intensities:

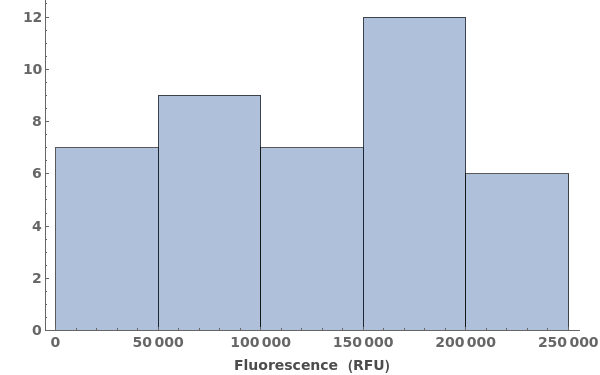
Plot a histogram of intensities from links:

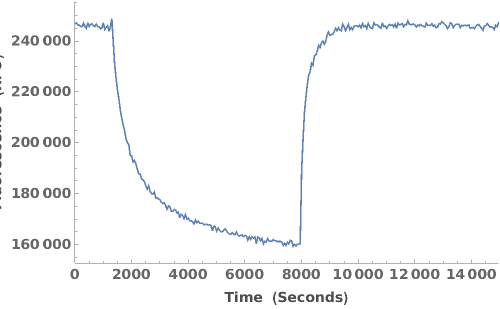
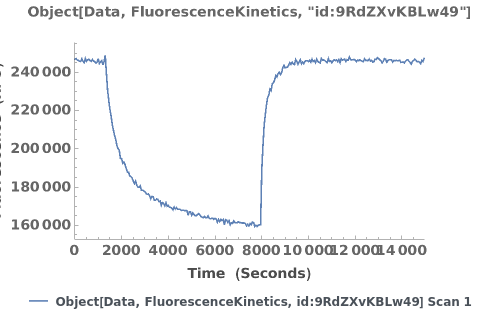
PlotFluorescenceKinetics (4)
PlotFluorescenceKinetics Documentation

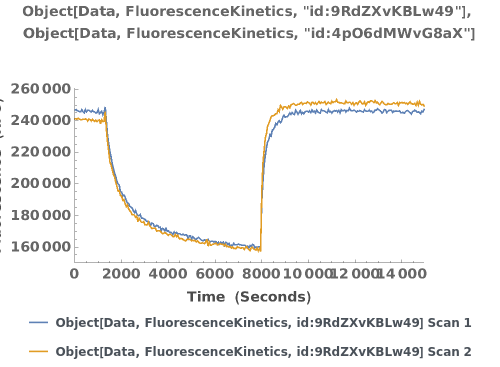
Plot raw data downloaded from an object:

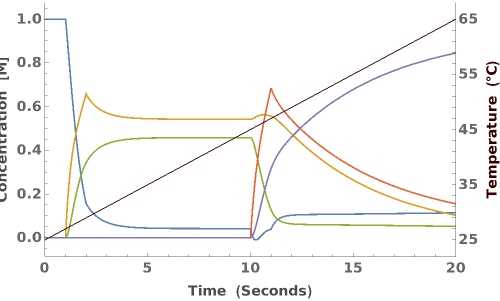
Plot the fluorescence trajectory and temperature trace of the data of interest:

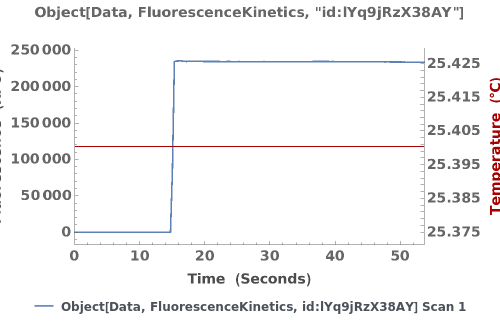
Plot the fluorescence trajectory for a given data object:

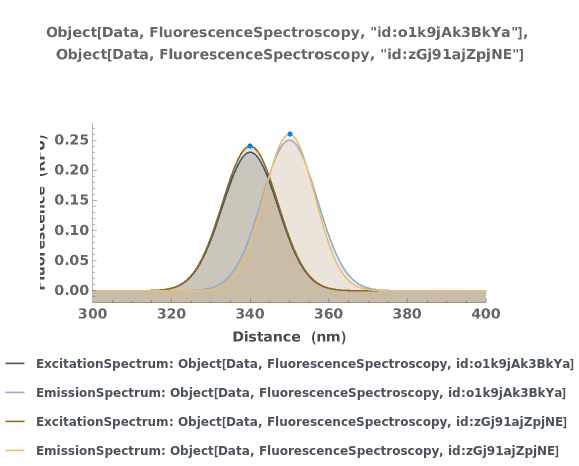
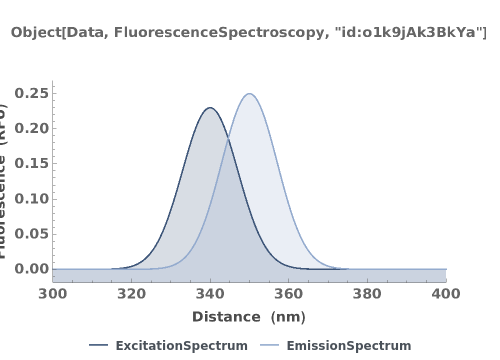
PlotFluorescenceSpectroscopy (2)


PlotFluorescenceThermodynamics (2)
PlotFluorescenceThermodynamics Documentation
Plot FluorescenceThermodynamics object in a link:

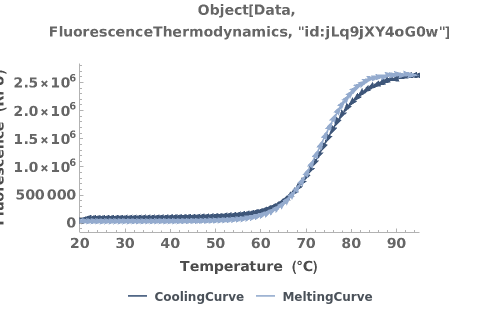
Plot the data from a FluorescenceThermodynamics object:

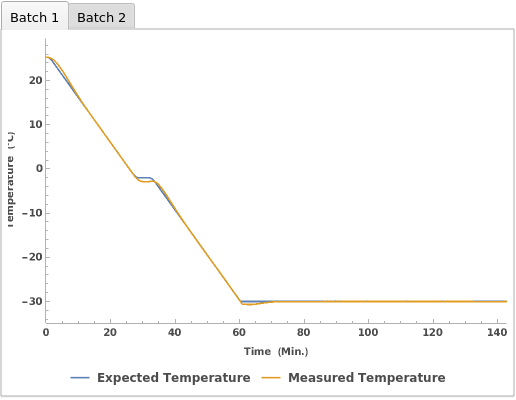
PlotFreezeCells (2)


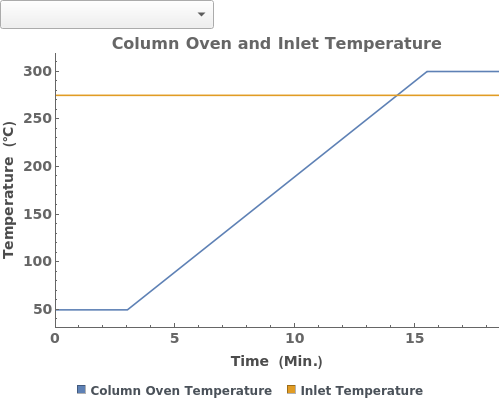
PlotGasChromatographyMethod (1)
PlotGasChromatographyMethod Documentation
Plot the values of the setiings stored in a gas chromatography method:

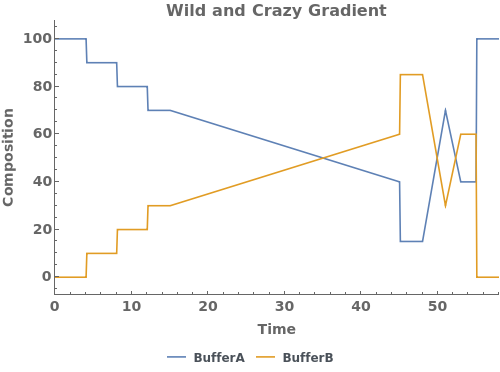
PlotGradient (4)


PlotIRSpectroscopy (3)
PlotIRSpectroscopy Documentation
Plot multiple infrared spectra on the same graph:

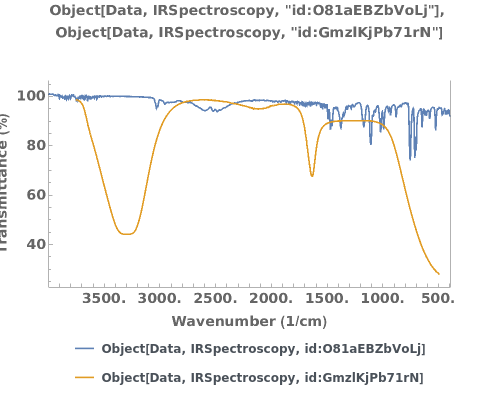
Plots infrared spectroscopy data when given an IRSpectroscopy data link:

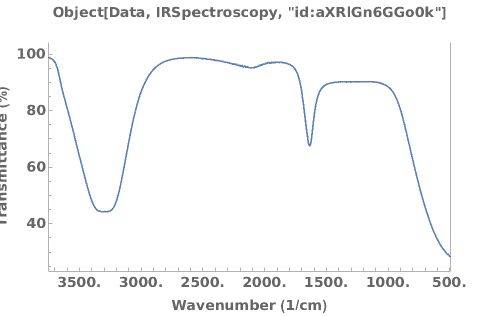
Plots infrared spectroscopy data when given an IRSpectroscopy data object:

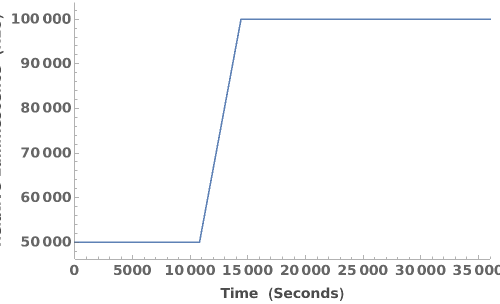
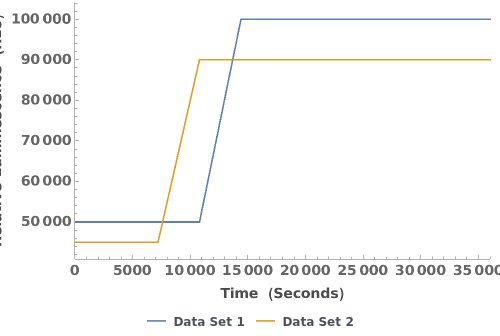
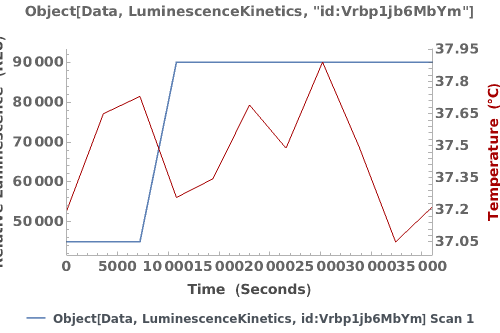
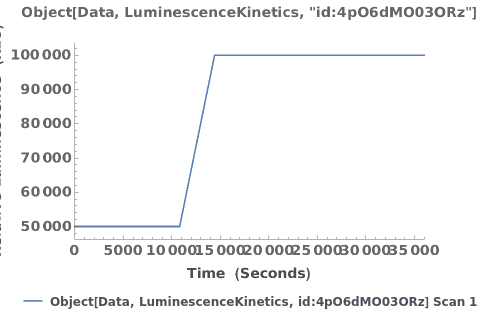
PlotLuminescenceKinetics (5)
PlotLuminescenceKinetics Documentation
Plot a raw emission trajectory:


Plot multiple raw emission trajectories:

Plot the luminescence trajectory and temperature trace of the data of interest:

Plot the luminescence trajectory for a given data object:

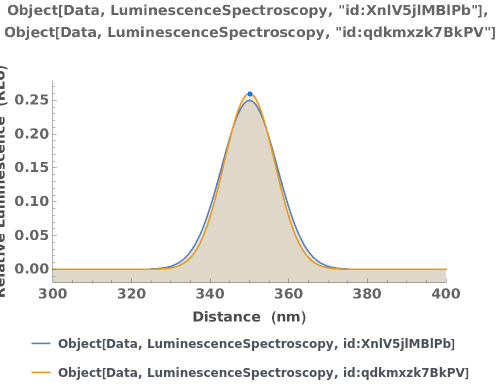
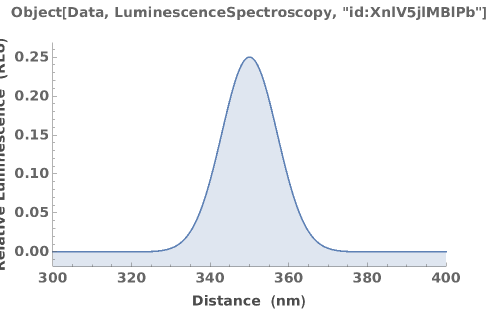
PlotLuminescenceSpectroscopy (2)


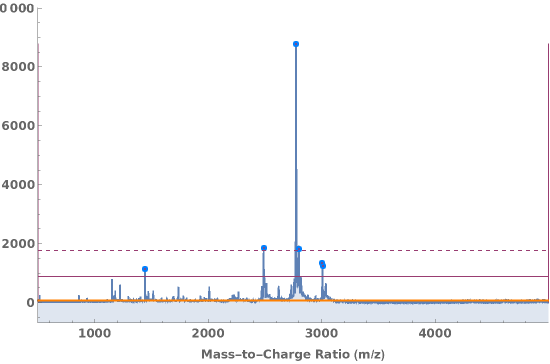
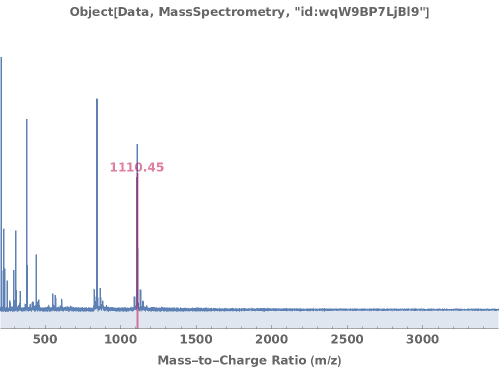
PlotMassSpectrometry (3)
PlotMassSpectrometry Documentation
Display the mass spectrum as a graphical plot:

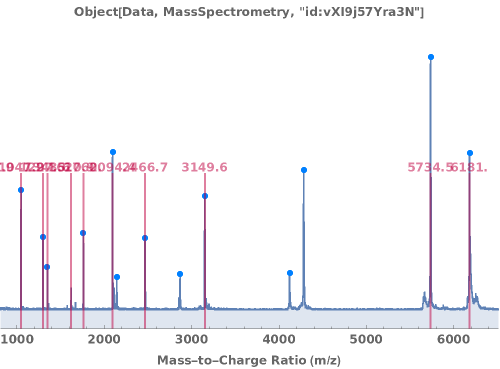
Peak picking analysis results are automatically included on the plot:

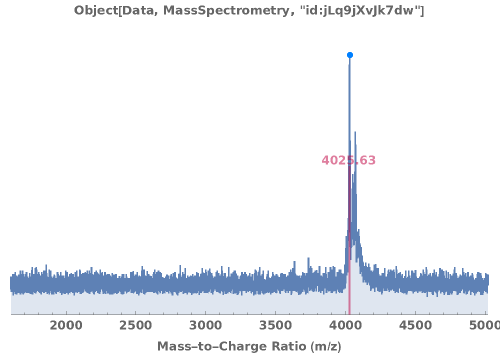
When available, the expected molecular weight is included on the plot by default:

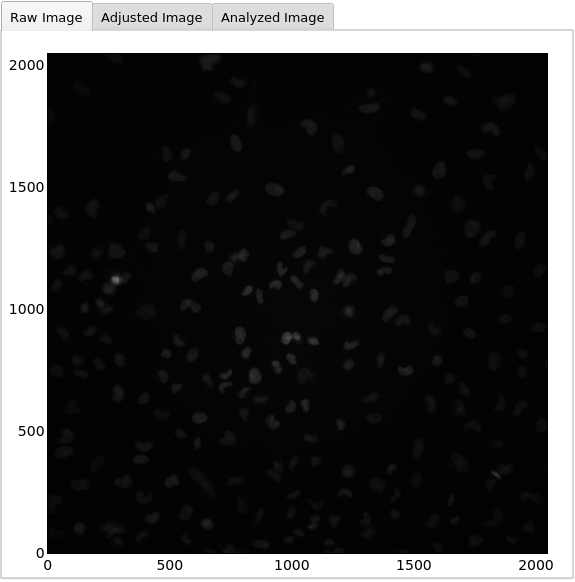
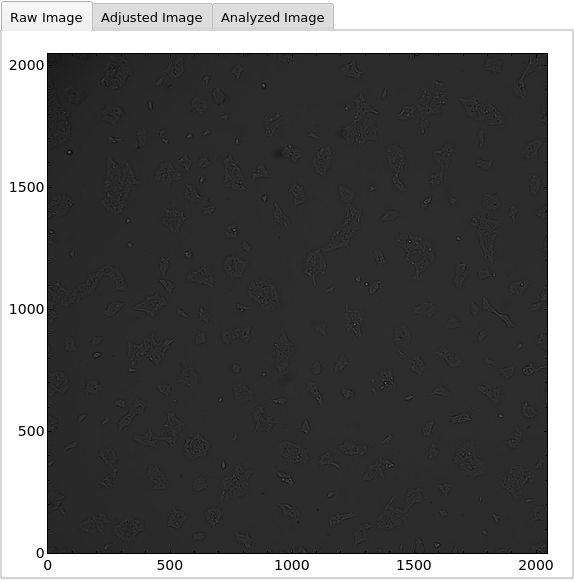
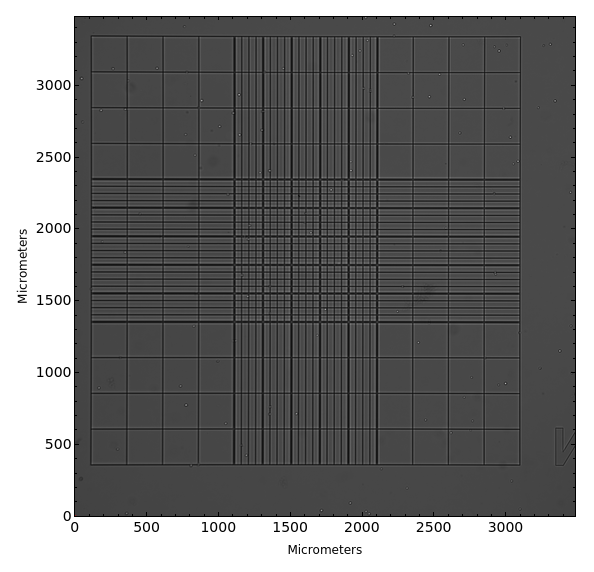
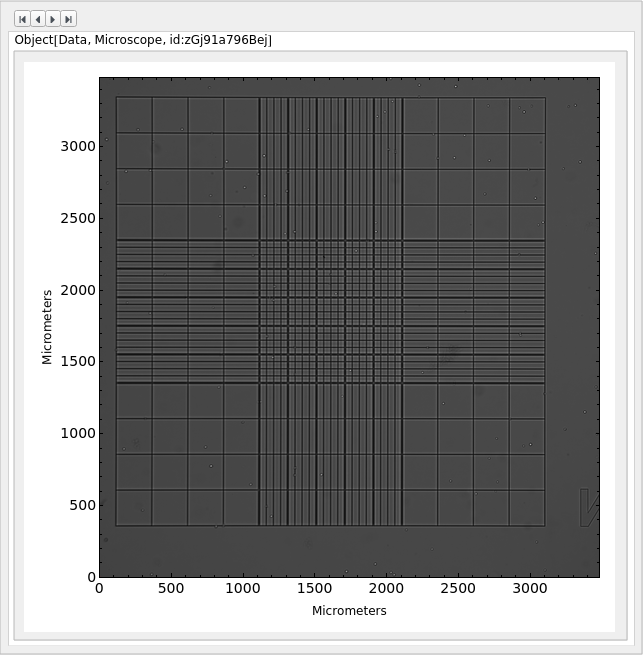
PlotMicroscope (3)


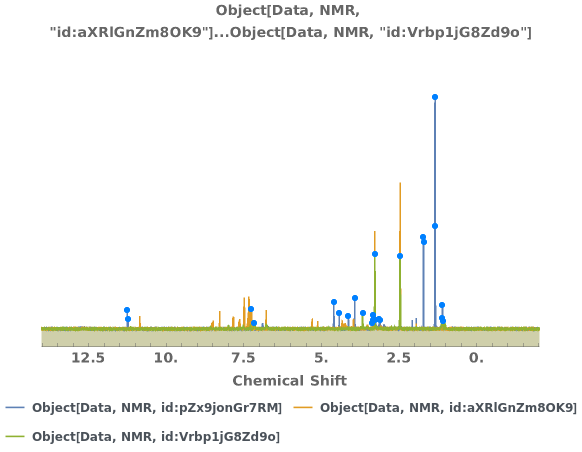
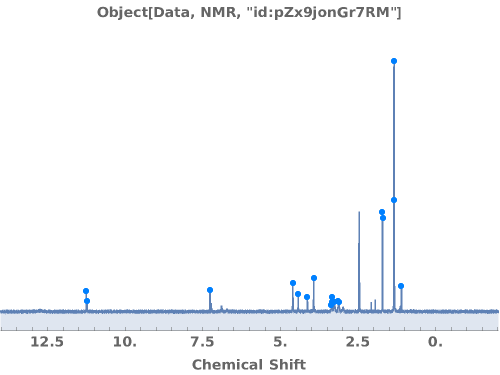
PlotNMR (2)


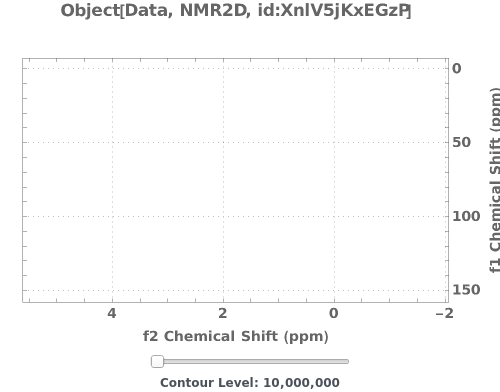
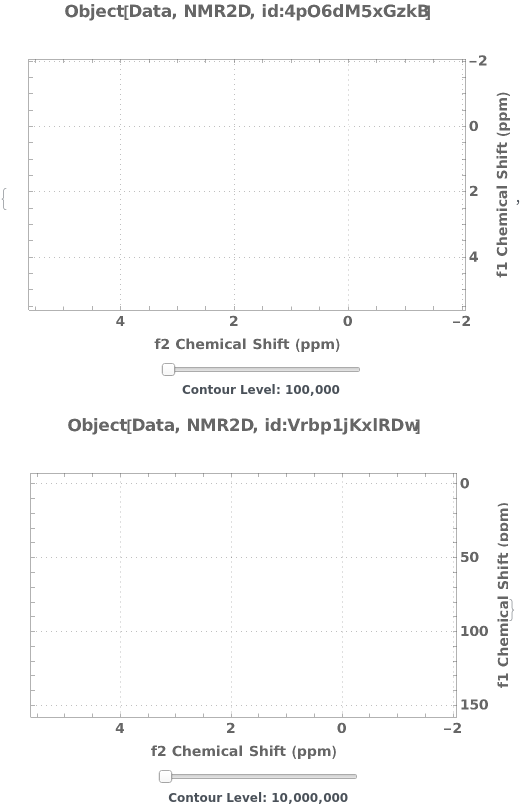
PlotNMR2D (4)
PlotObject calls PlotNMR2D to plot the two-dimensional spectrum:

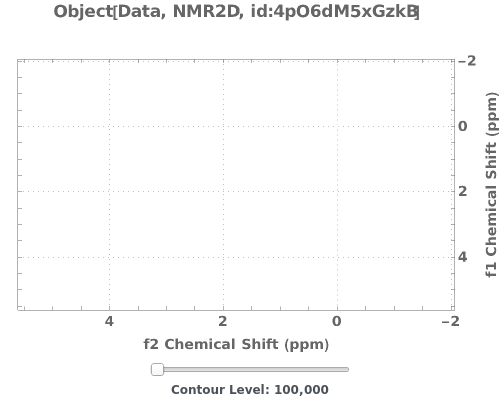
Plot the two-dimensional NMR spectrum of a single object, with a dynamic slider for adjusting the intensity threshold:
Plot the two-dimensional NMR spectrum of a single object with low enough signal that a slider does not appear. This happens if the data is so noisy and the signal is weak enough that lowering the threshold further will result in extremely high noise:

Plot the two-dimensional NMR spectrum of multiple objects:

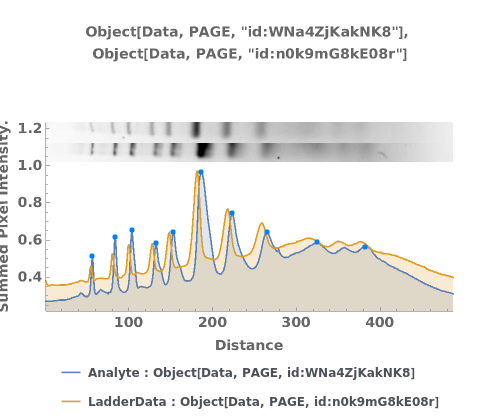
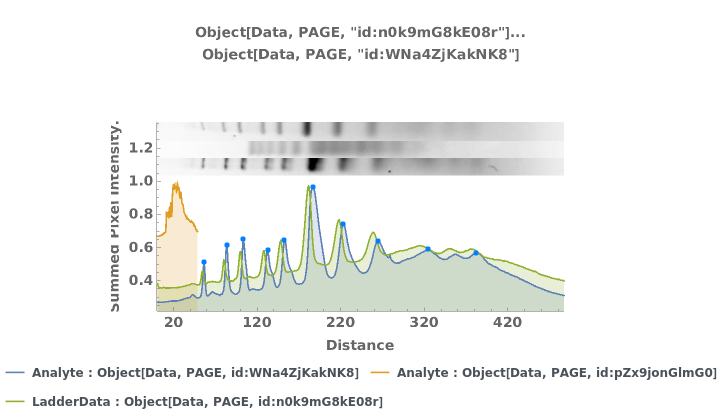
PlotPAGE (4)


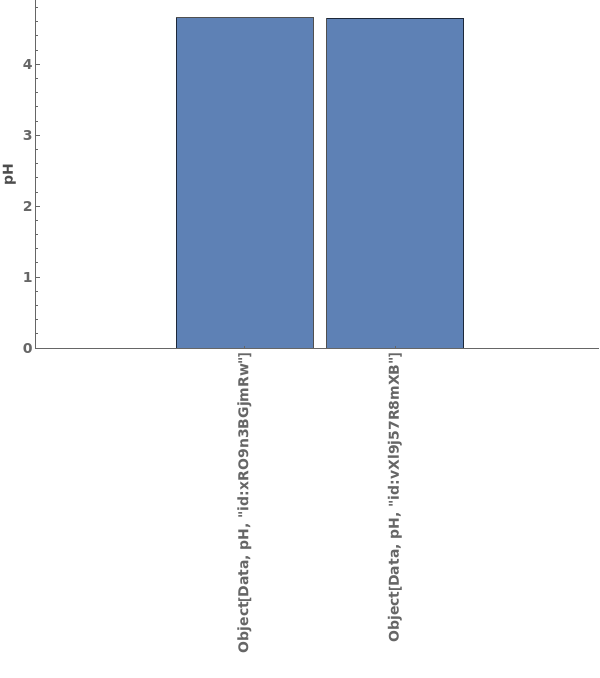
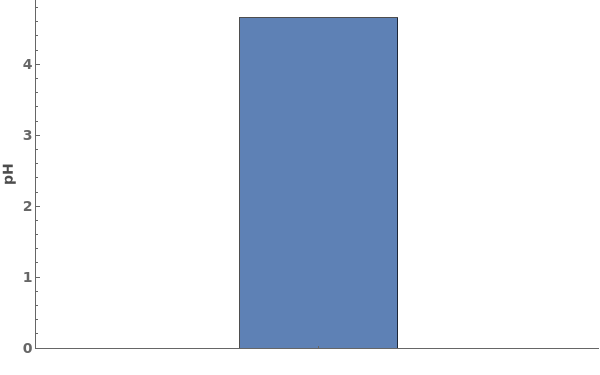
PlotpH (3)


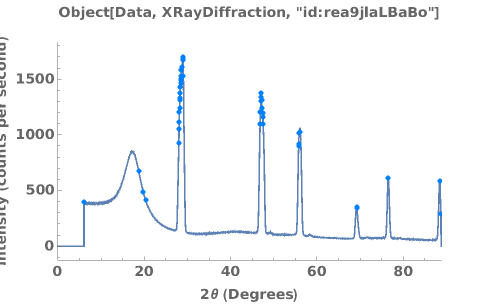
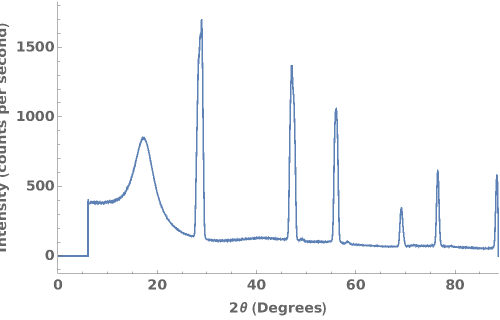
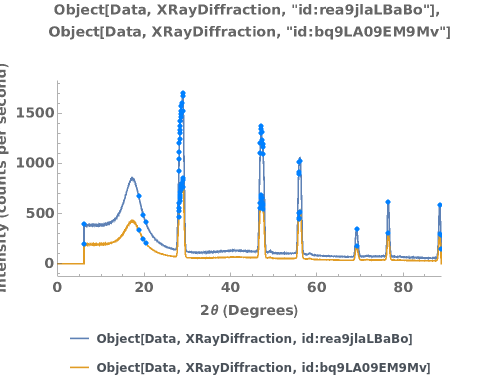
PlotPowderXRD (4)


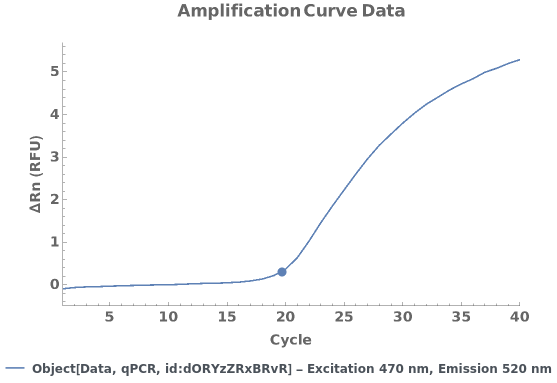
PlotqPCR (2)
Given a qPCR data object, creates a plot for the applicable normalized and baseline-subtracted amplification curves. If there are linked analysis objects, the quantification cycle/copy number information from the most recent analysis for each applicable wavelength pair is displayed as a tooltip:

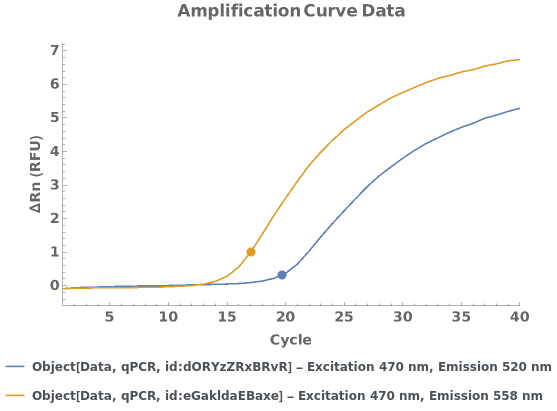
Given multiple qPCR data objects, creates a plot for the applicable normalized and baseline-subtracted amplification curves. For each data object, if there are linked analysis objects, the quantification cycle/copy number information from the most recent analysis for each applicable wavelength pair is displayed as a tooltip:

PlotDigitalPCR (3)


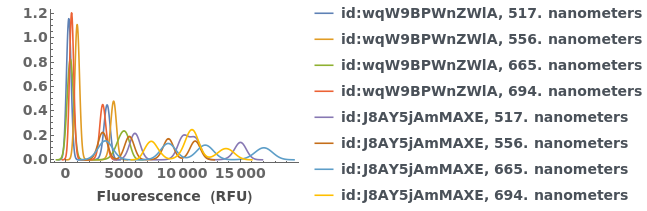
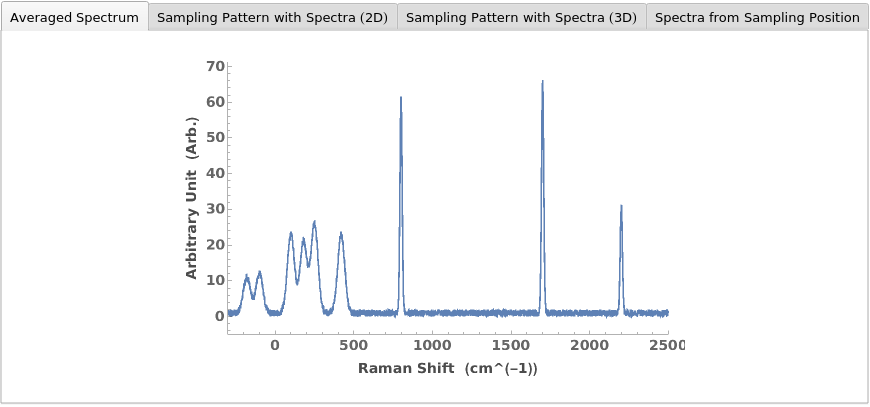
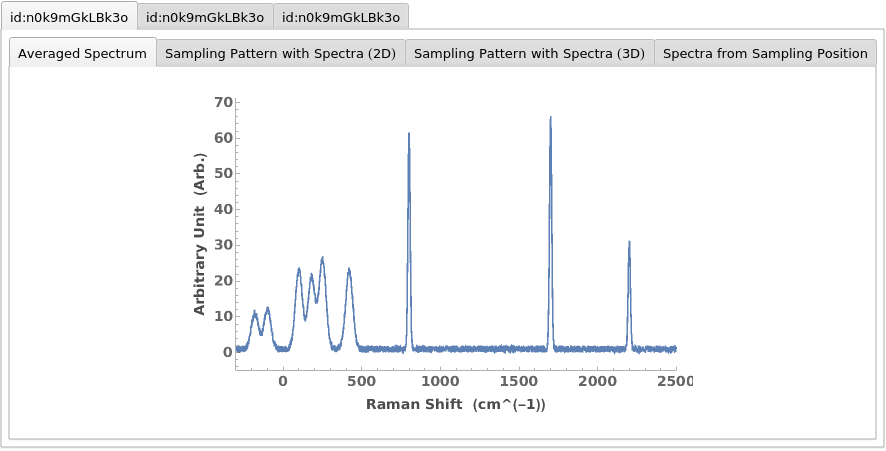
PlotRamanSpectroscopy (2)
PlotRamanSpectroscopy Documentation
Given a RamanSpectroscopy data object, creates plots for the AverageRamanSpectrum as well as the spectra and positions collected at each sampling position:

Plot a list of RamanSpectroscopy data objects:

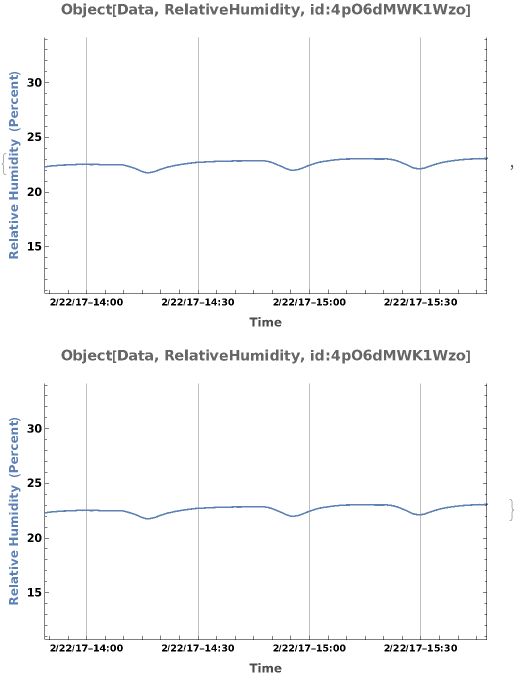
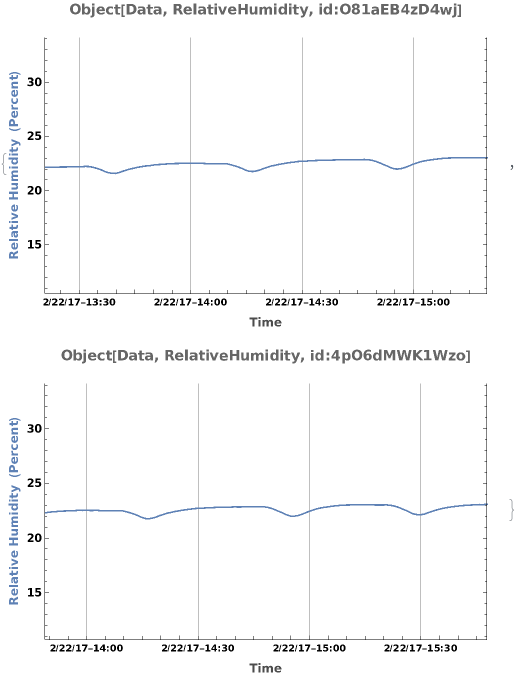
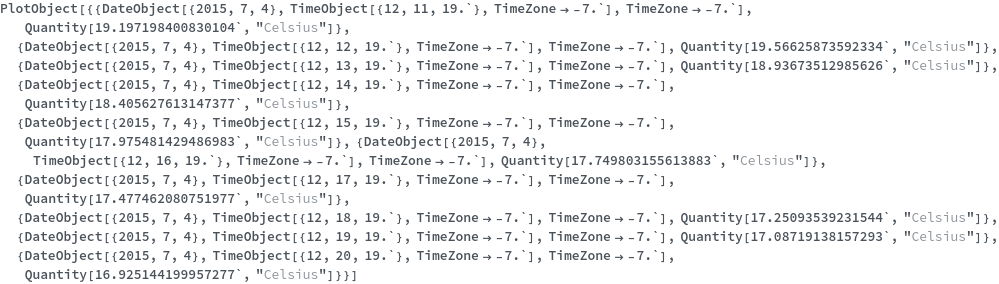
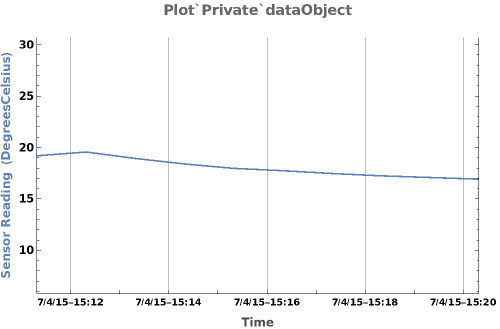
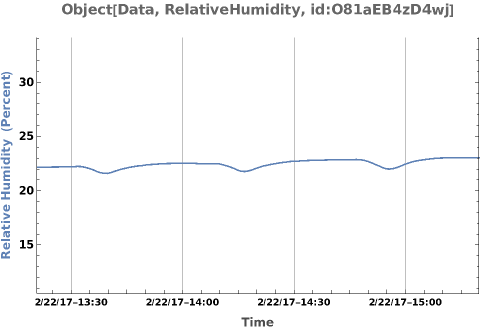
PlotSensor (5)


PlotSurfaceTension (1)
PlotSurfaceTension Documentation
Given an analyzed Object[Data,SurfaceTension], PlotSurfaceTension returns an plot:

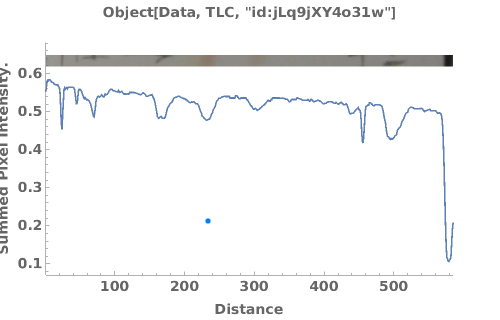
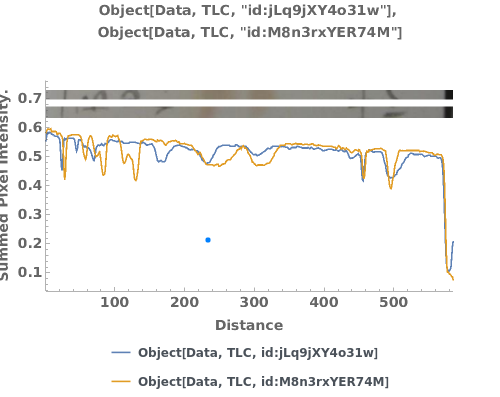
PlotTLC (3)


PlotVacuumEvaporation (2)
PlotVacuumEvaporation Documentation
Plot pressure and temperature data arrays:

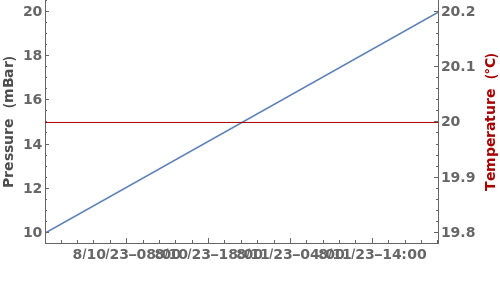
Plot pressure and temperature data from a vacuum evaporation run:

PlotVolume (3)


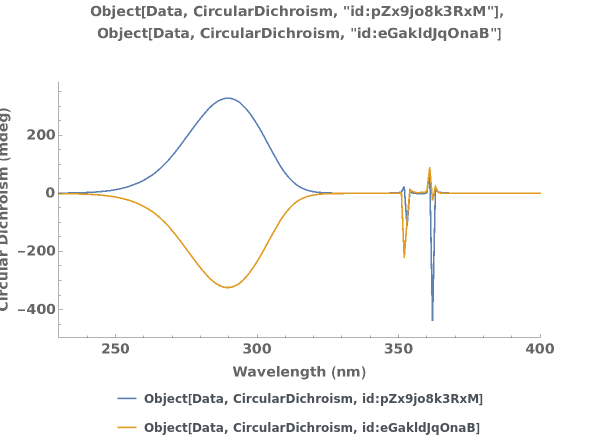
PlotCircularDichroism (4)
PlotCircularDichroism Documentation
Plots circular dichroism spectroscopy data when given a list of XY coordinates representing the spectra:

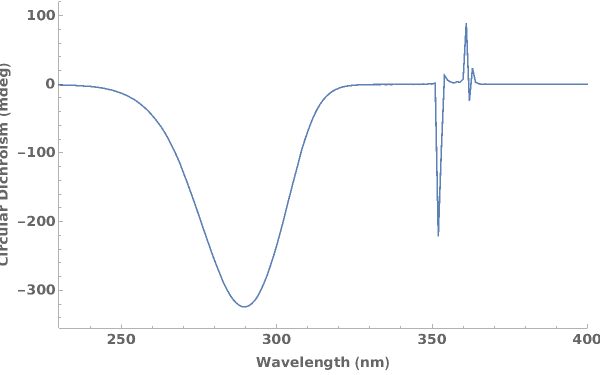
Plots circular dichroism spectroscopy data when given an AbsorbanceSpectroscopy data link:

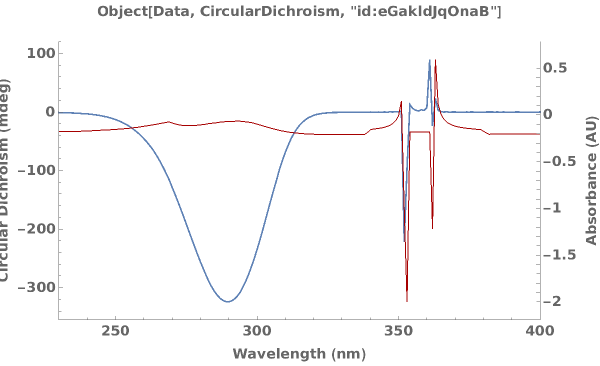
Plots circular dichroism spectroscopy data when given an AbsorbanceSpectroscopy data object:

Plots multiple sets of data on the same graph:

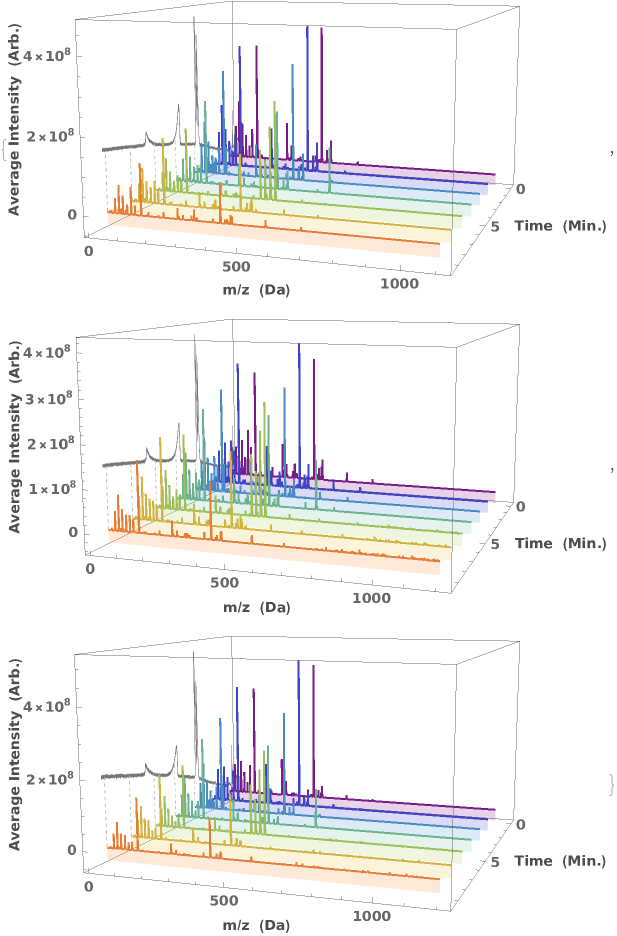
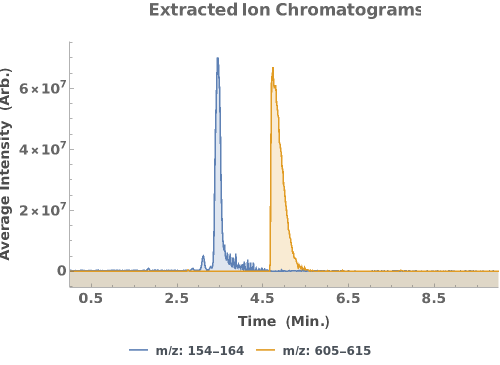
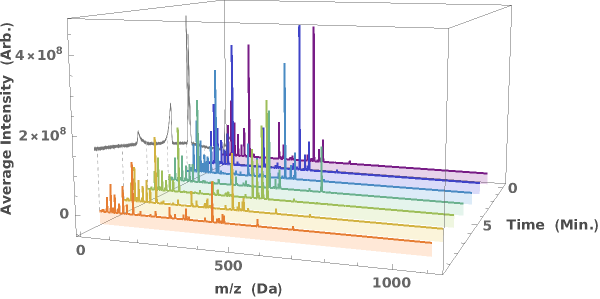
PlotChromatographyMassSpectra (4)
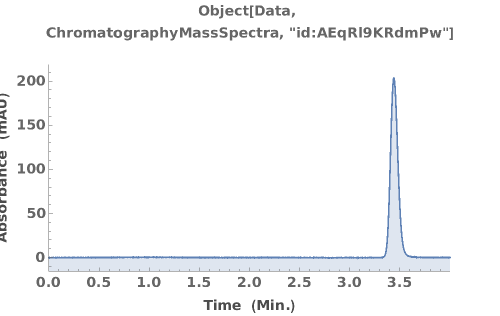
PlotChromatographyMassSpectra Documentation
PlotChromatographyMassSpectra is Listable:

Plot extracted ion chromatograms for specific ranges of m/z:

Plot the average mass spectra at specified elution times:

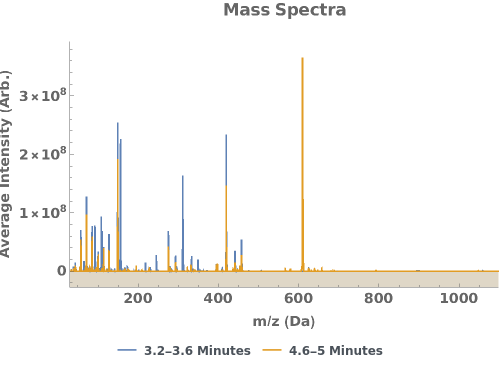
Visualize the changing mass spectrum in LCMS data as a function of elution time:

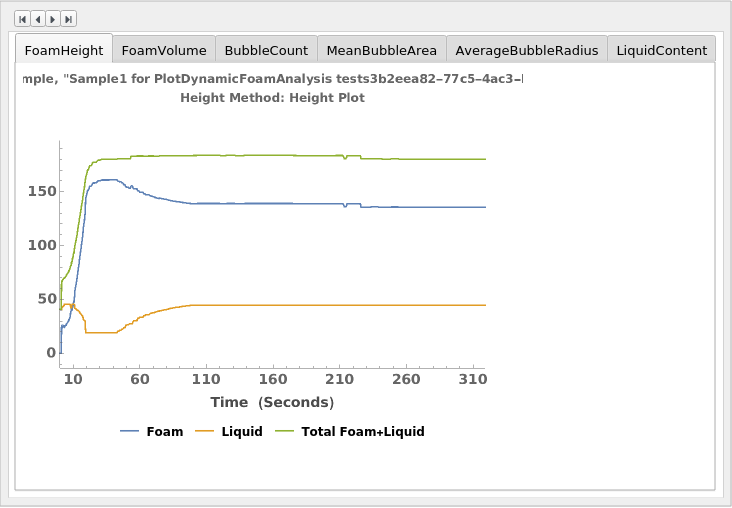
PlotDynamicFoamAnalysis (2)
PlotDynamicFoamAnalysis Documentation
Given a DynamicFoamAnalysis data object, creates all possible plots related to the DetectionMethod:


Given multiple DynamicFoamAnalysis data objects, creates all possible plots related to the DetectionMethod):

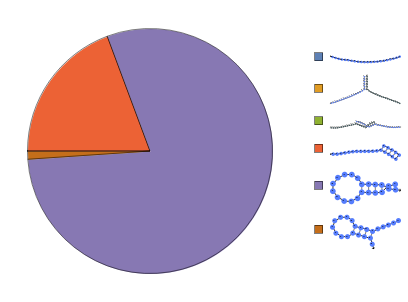
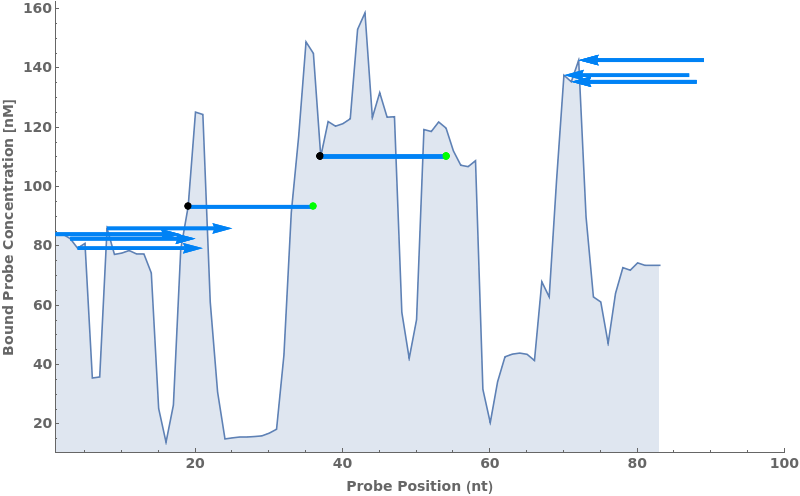
PlotProbeConcentration (2)
PlotProbeConcentration Documentation
Given the output from SimulateProbeSelection, the funcion plots the probe accessibility along a target, arrows represent selected top probes with their rank indicated:

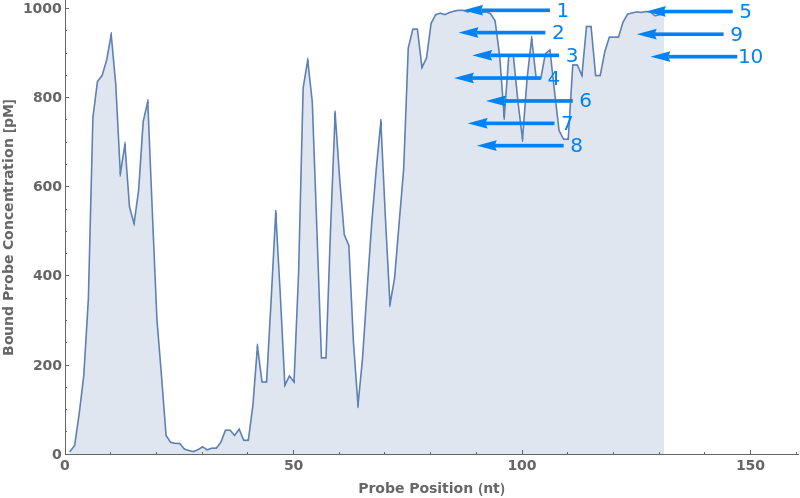
The function can also work on Object[Simulation, PrimerSet] by plotting out forward primers (left arrows), reverse primers (right arrows) and Beacons (horizontal lines):

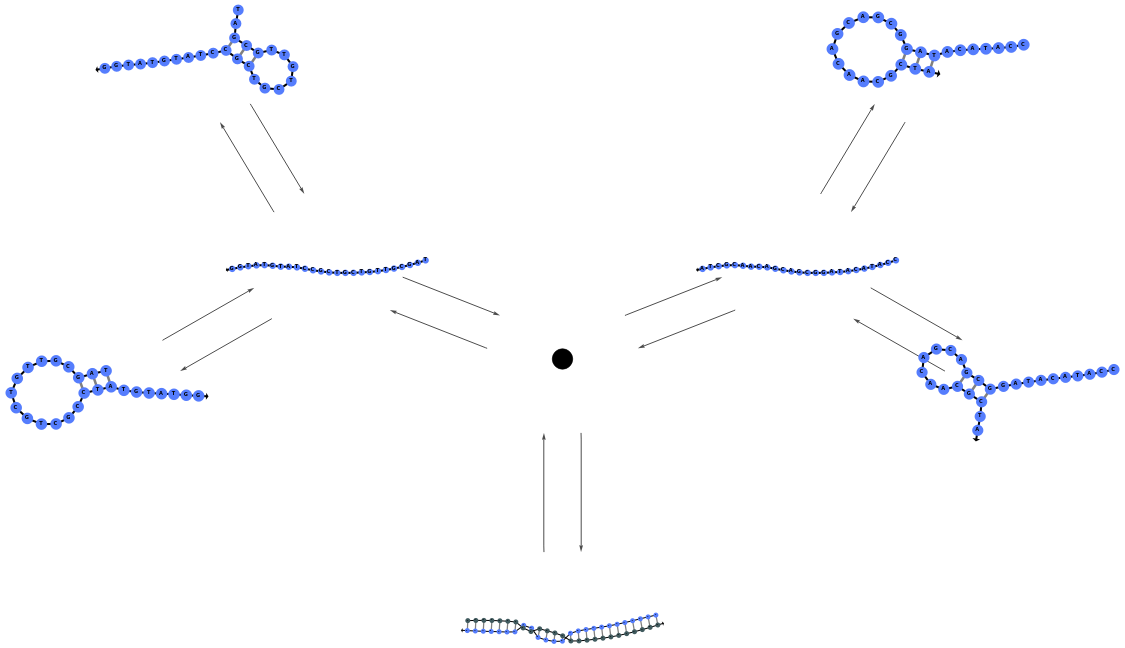
PlotReactionMechanism (4)
PlotReactionMechanism Documentation

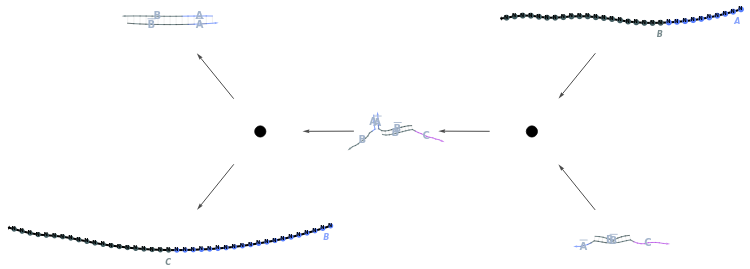
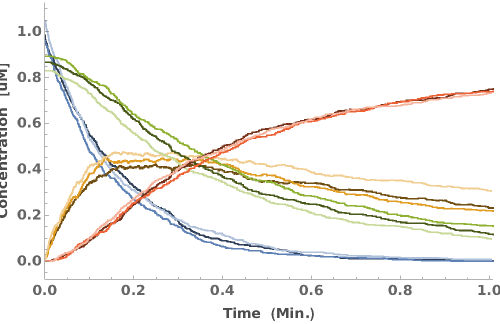
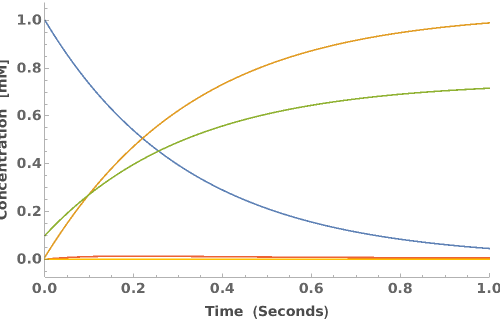
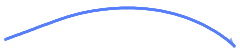
Plot a ReactionMechanism link:

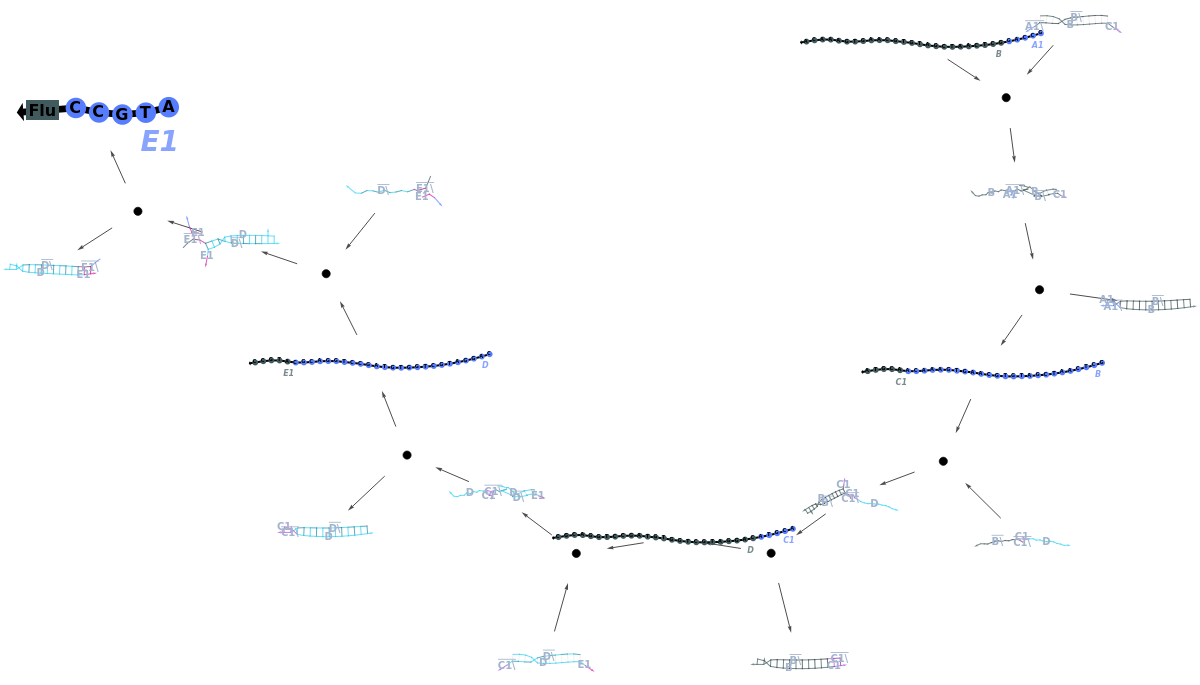
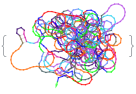
Plot a ReactionMechanism model:

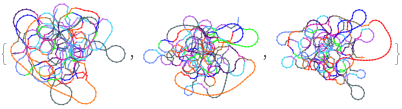
Plot a ReactionMechanism with reversible reactions: