PlotAbsorbanceQuantification
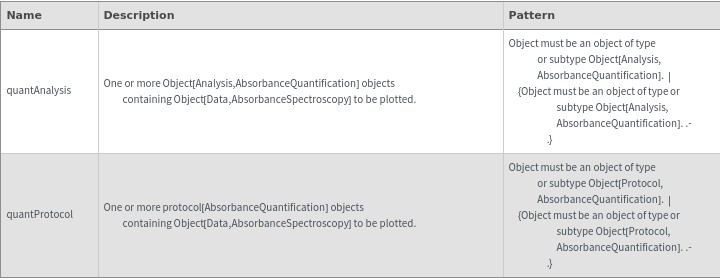
PlotAbsorbanceQuantification[QuantAnalysis]⟹Plot
generates a line plot of the Object[Data,AbsorbanceSpectroscopy] associated with each item in QuantAnalysis.
PlotAbsorbanceQuantification[QuantProtocol]⟹Plot
generates a line plot of the Object[Data,AbsorbanceSpectroscopy] associated with each item in QuantProtocol.
Details
-
NoData The provided object `1` contains no absorbance spectra data. Be sure to run AnalyzeAbsorbanceQuantification on your protocol[AbsorbanceQuantification] object before trying to plot.
Input
Output

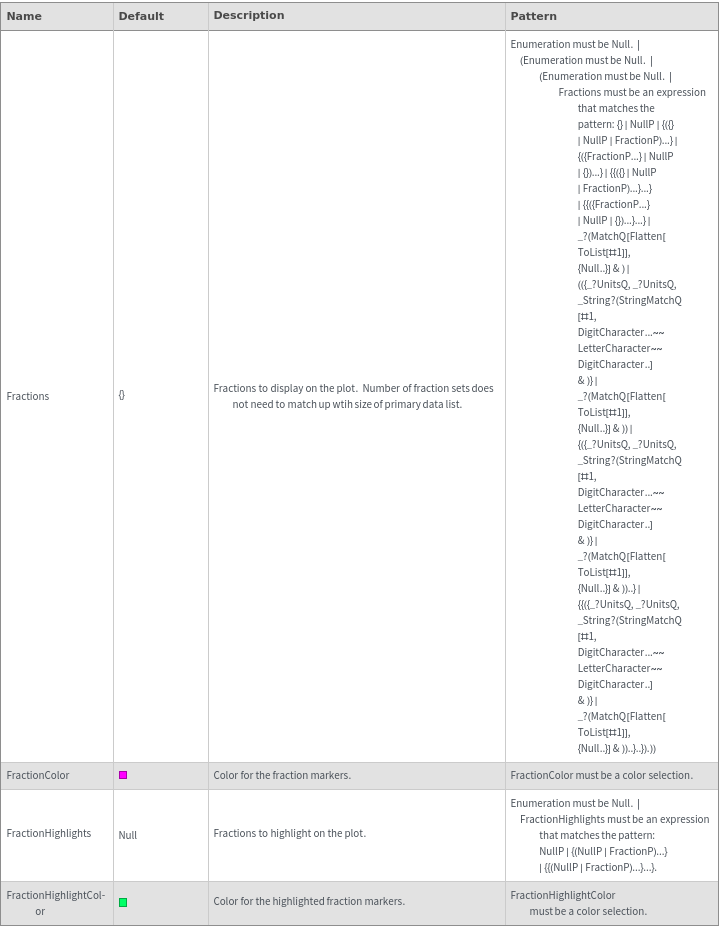
Fractions Options
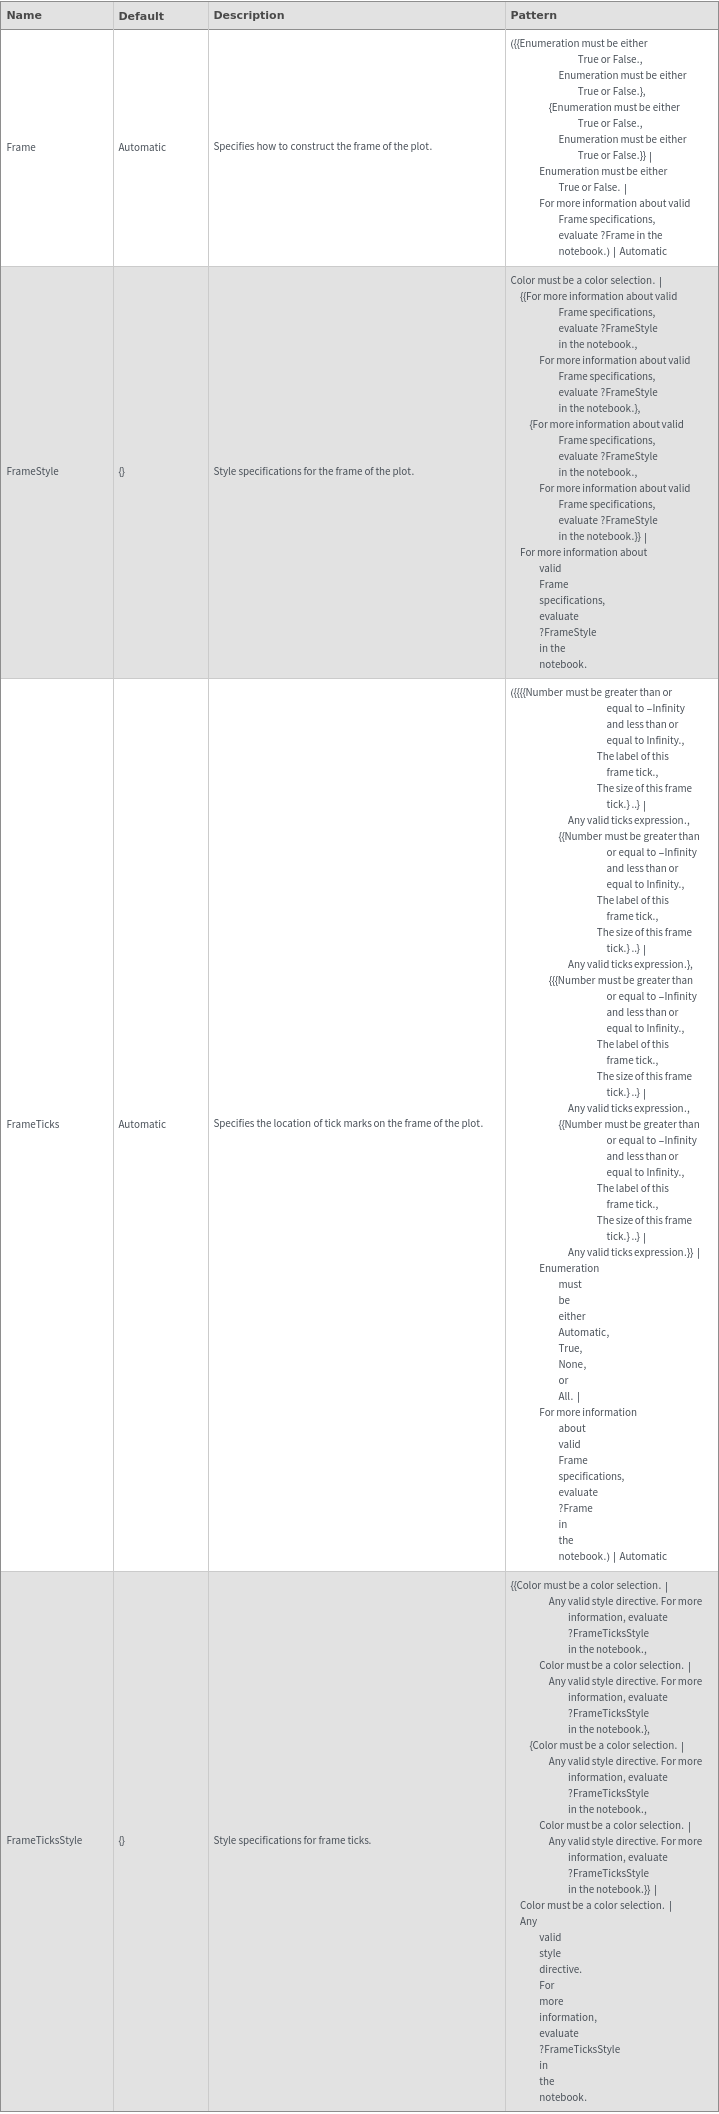
Frame Options
Grid Options
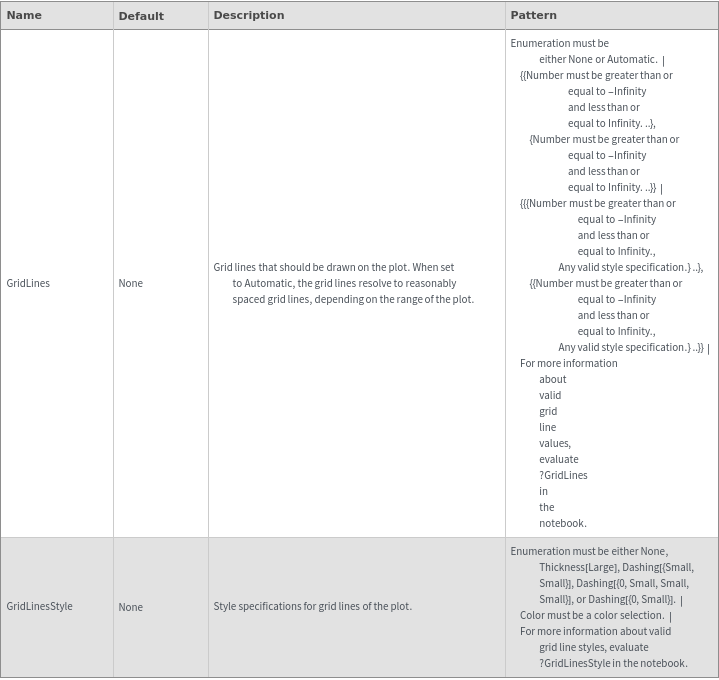
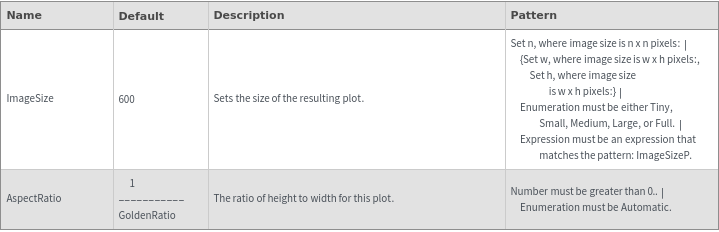
Image Format Options
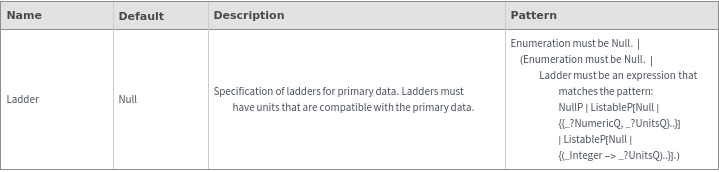
Ladder Options
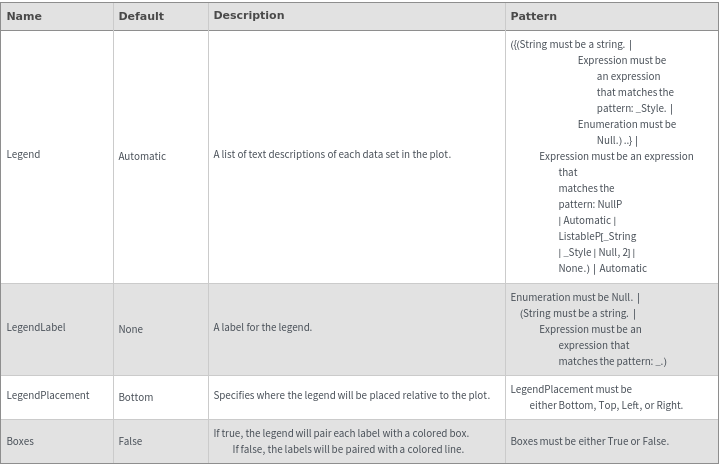
Legend Options
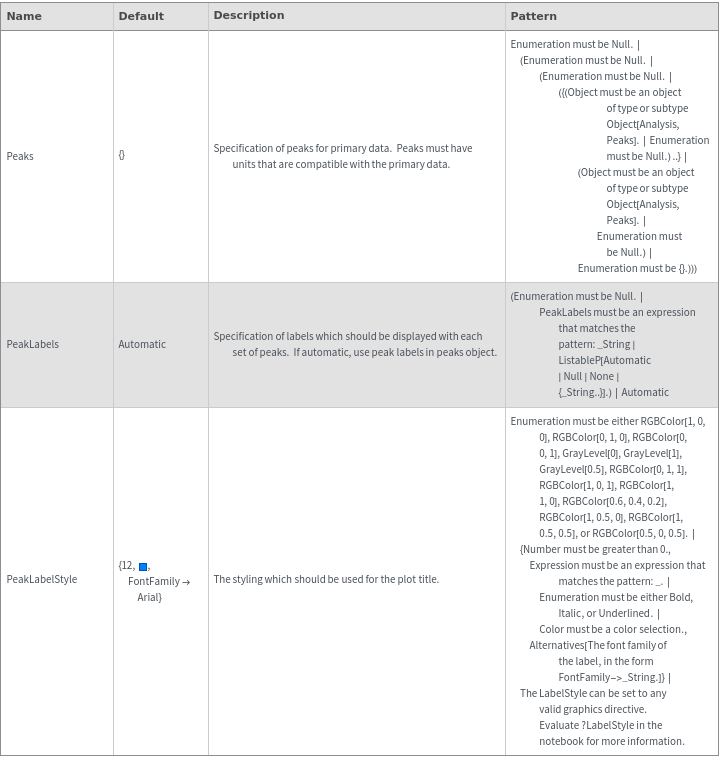
Peaks Options
Plot Labeling Options
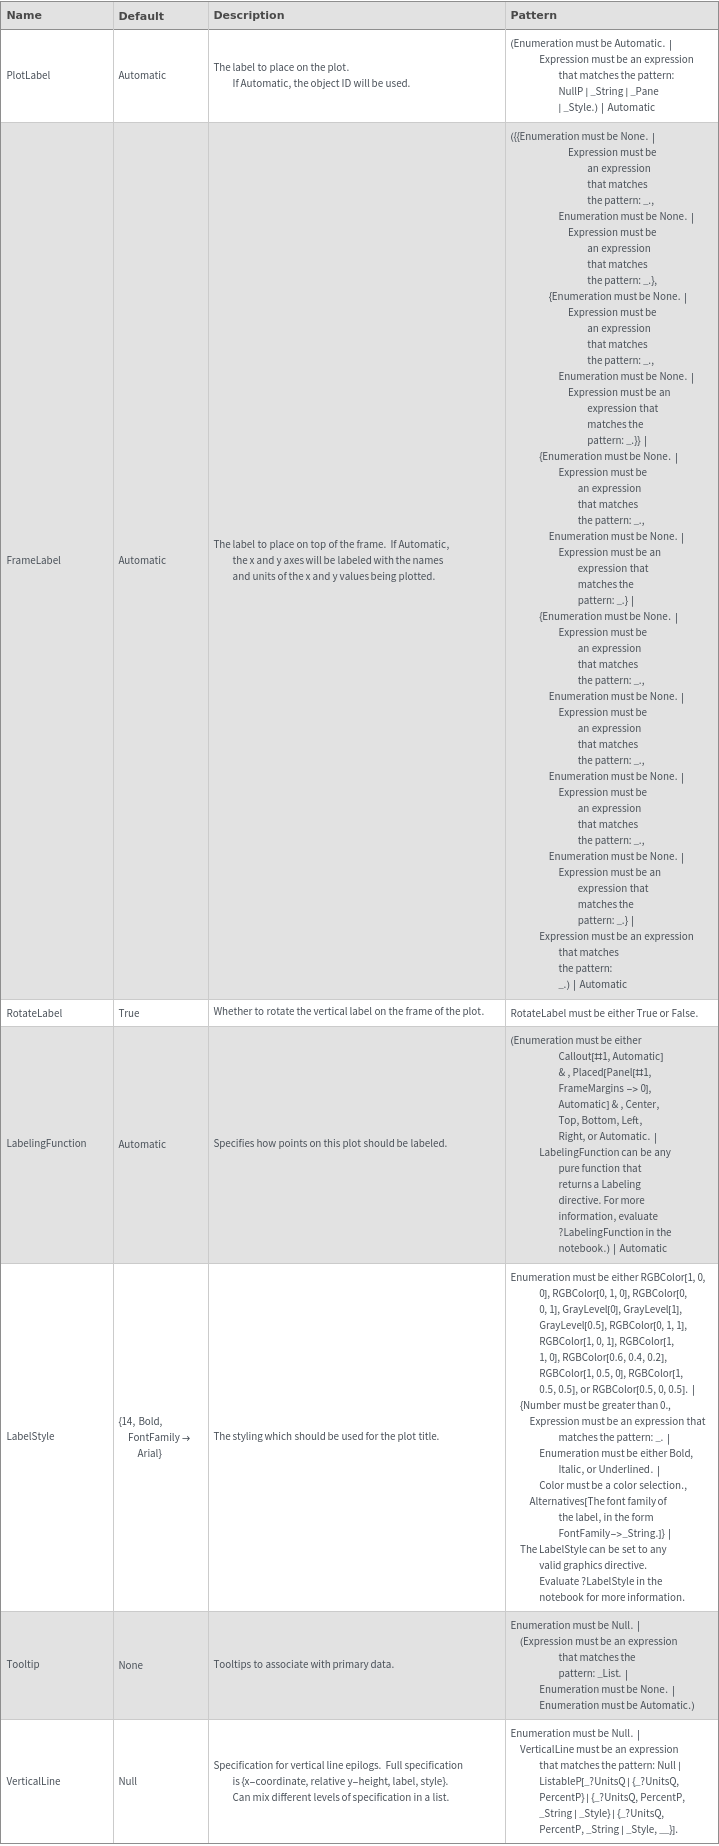
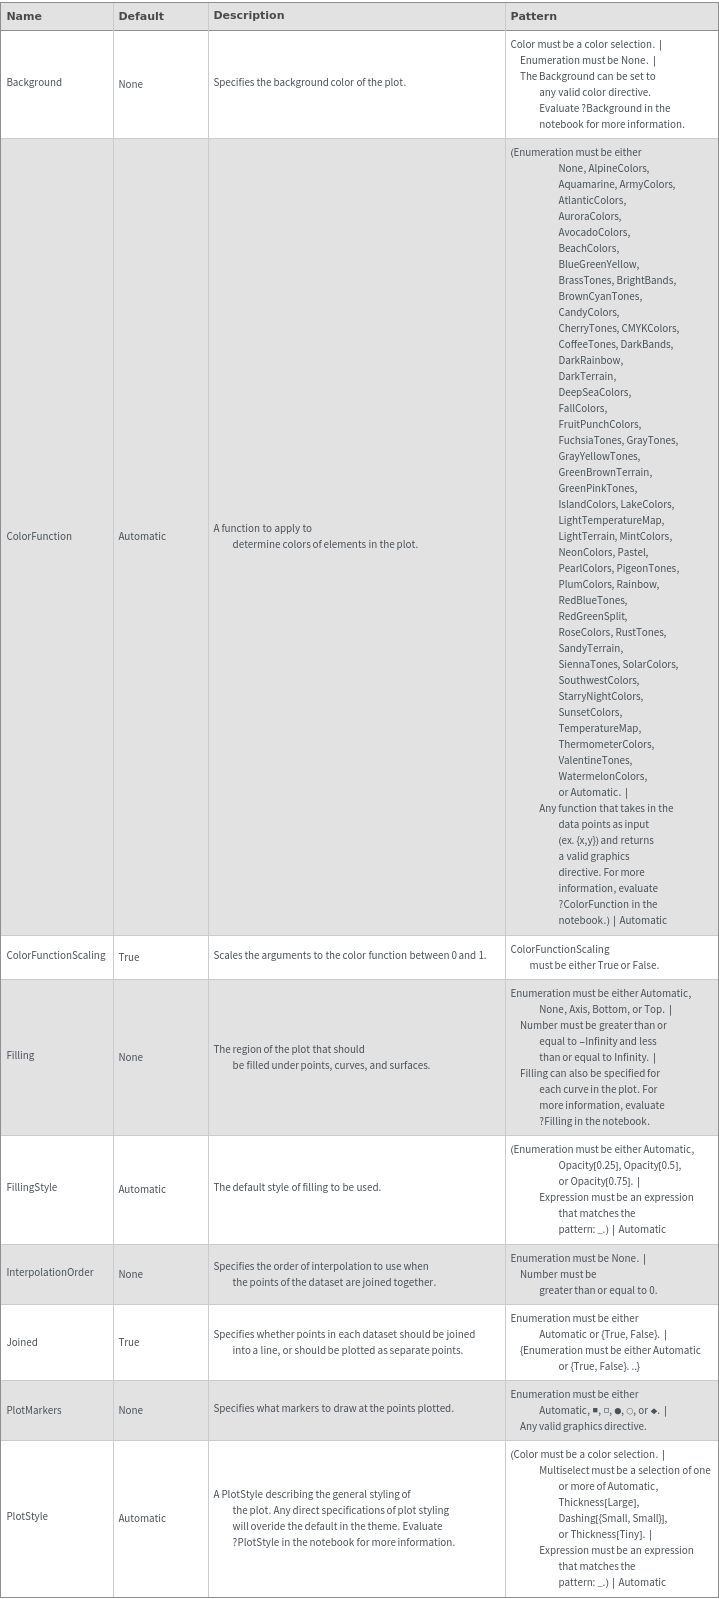
Plot Style Options
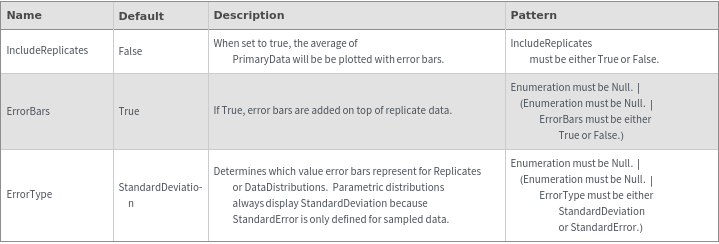
Primary Data Options
Raw Data Options
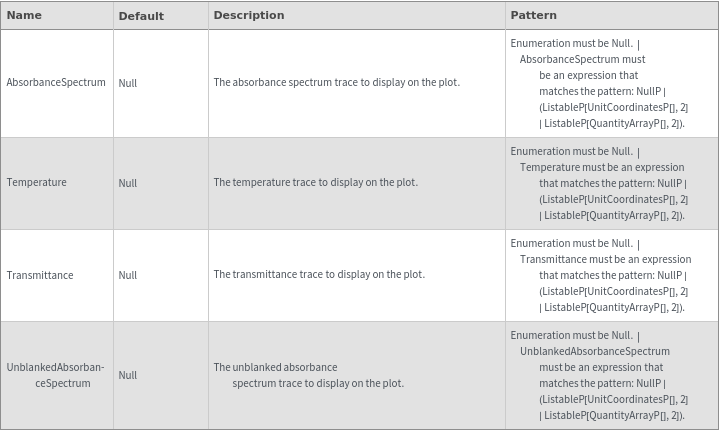
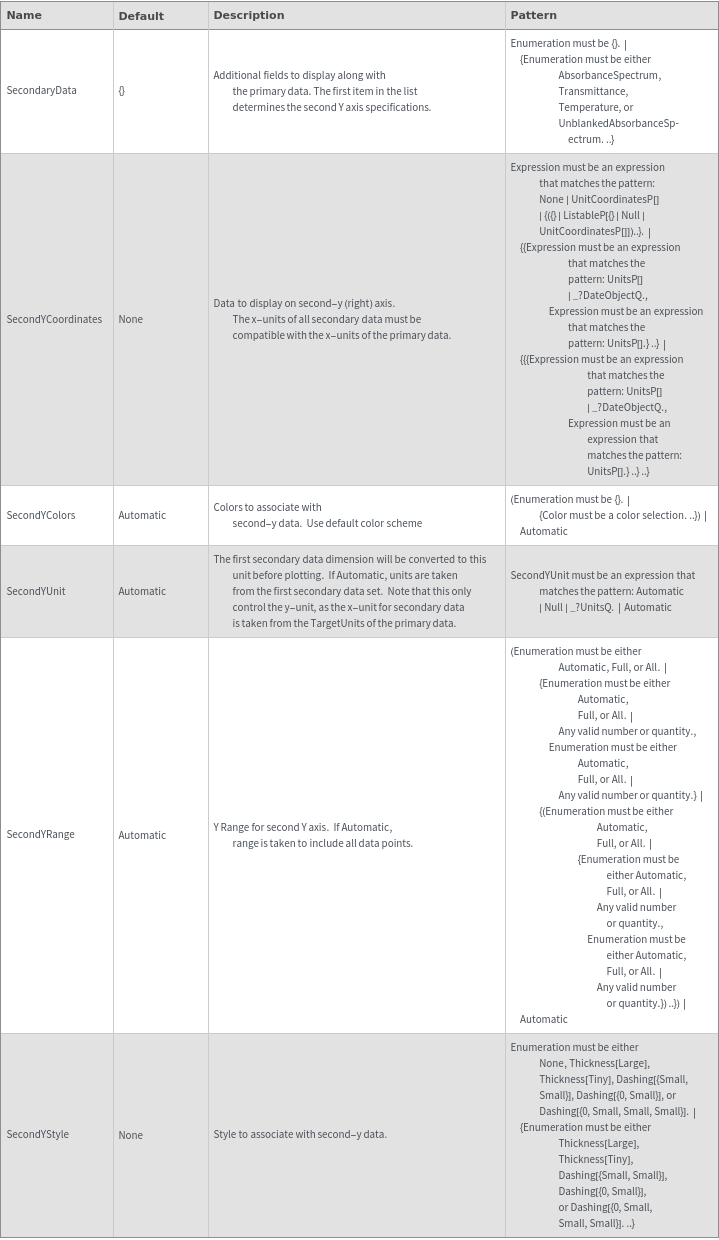
Secondary Data Options
General Options
Messages
Examples
open allclose allBasic Examples (3)
Additional Examples (1)
Options (7)
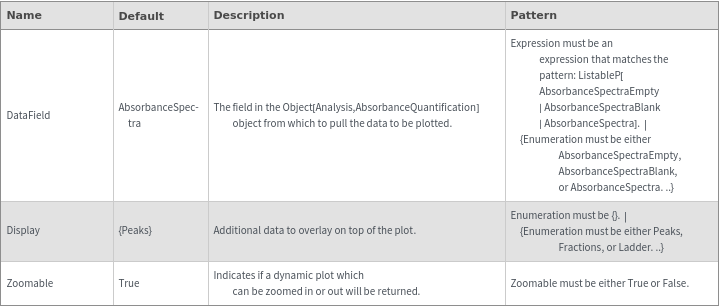
DataField (3)
Specify the field in the Object[Analysis,AbsorbanceQuantification] object from which the Object[Data,AbsorbanceSpectroscopy] will be pulled and plotted:
Specify the field in the Object[Analysis,AbsorbanceQuantification] object from which the Object[Data,AbsorbanceSpectroscopy] will be pulled and plotted:
Specify the field in the Object[Analysis,AbsorbanceQuantification] object from which the Object[Data,AbsorbanceSpectroscopy] will be pulled and plotted:

