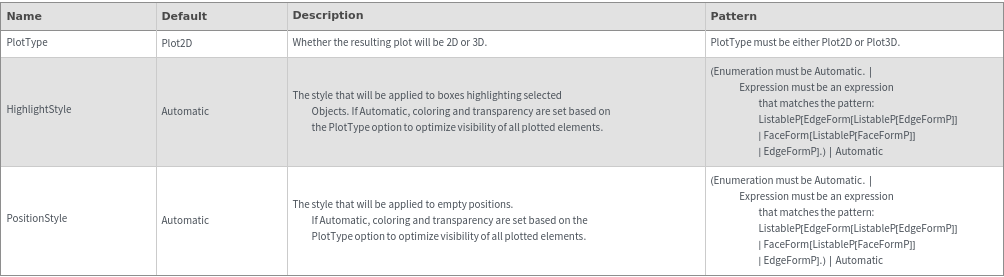
PlotContents
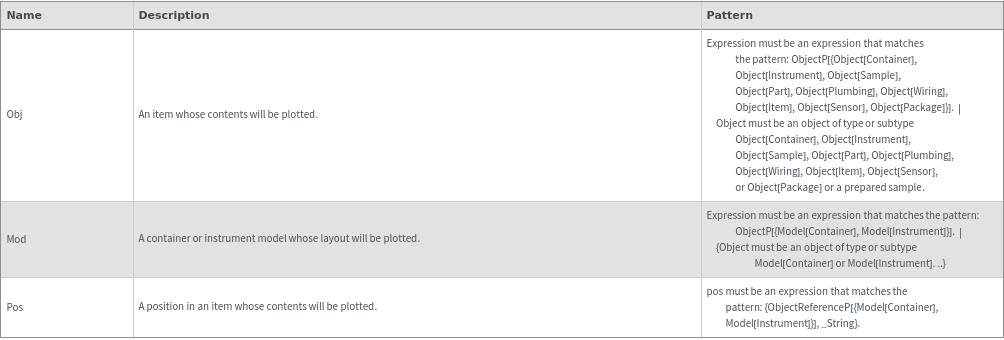
PlotContents[Obj]⟹Plot
generates a plot of an item Obj and its immediate contents.
PlotContents[Mod]⟹Plot
generates a plot of the physical layout of a container or instrument model Mod.
PlotContents[Pos]⟹Plot
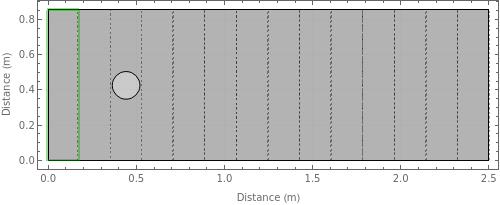
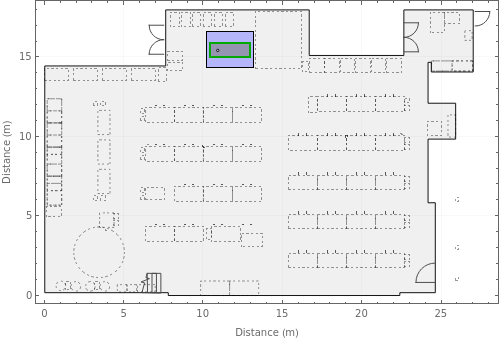
generates a plot of the location of a position Pos in its parent container within the ECL facility.
Details
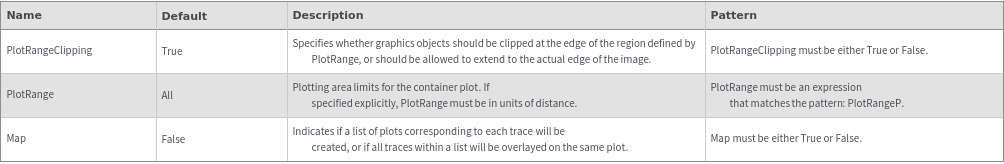
- Map->False will attempt to combine all inputs and return a single plot. If this is not possible (i.e., if the input location graphs are disconnected), inputs will be combined into the minimum number of connected location graphs.
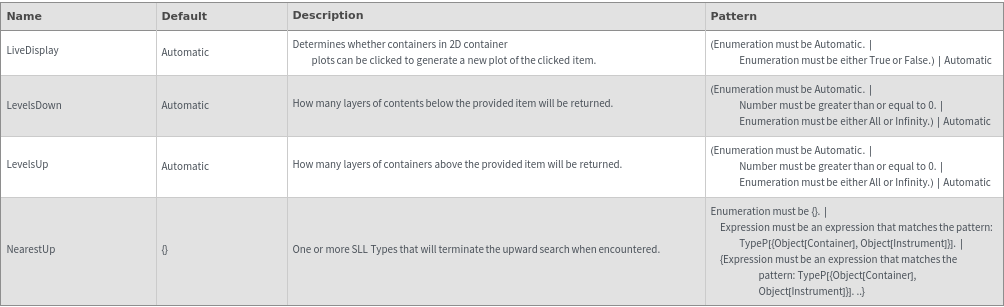
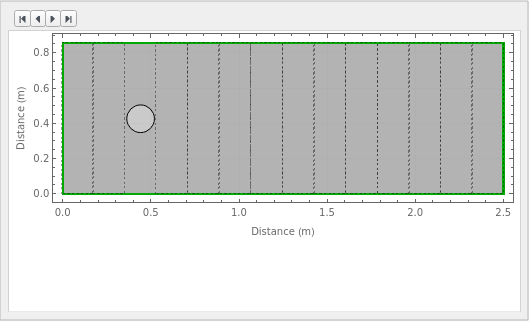
- If LiveDisplay->True (default), individual containers can be clicked to re-draw the container plot with focus on the clicked object.
- LiveDisplay is only compatible with PlotType->Plot2D.
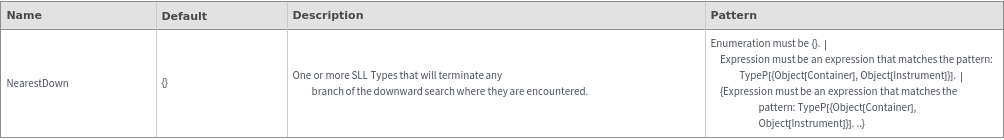
- If both LevelsUp and NearestUp or LevelsUp and NearestDown are specified, the Nearest_ option will take precedence and the Levels_ option will be set to Infinity.
- Duplicates in input will be deleted and duplicated items will be plotted only once.
-
DisconnectedGraph The specified inputs cannot be visualized on a single plot given the specified depth options. They will be split into the minimum number of connected container plots. If a single plot is desired, consider increasing LevelsUp/LevelsDown values to find overlap between the containers or contents of the input objects. IncompatibleOptions LiveDisplay is unavailable when plotting in 3D. To use LiveDisplay, set PlotType->Plot2D. InvalidObject The following objects or their models are missing fields that are required for plotting: `1`. These object(s) and their contents will be omitted from the resultant plot(s). Run ValidObjectQ with Verbose->Failures for more information. InvalidPosition The following {object, position} pairs cannot be plotted because the specified positions are not defined in their container's model: `1`. MismatchedUnits The specified TargetUnits, `1`, do not match. Using units `2` for all plot dimensions. When specifying TargetUnits as a list, all members of the list must match. ModelNotFound Unable to plot the following objects due to missing container models: `1`. Populate the 'Model' field to make these Objects plottable. ObjectNotFound Unable to find the following objects in the database for plotting: `1`. Check that these input Object(s) have been entered correctly.
Input
Output

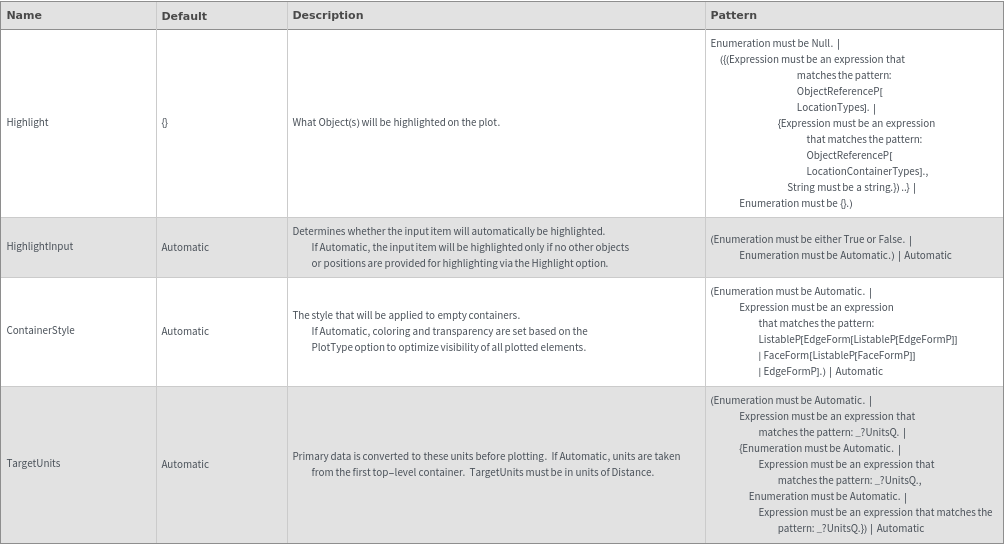
Options
Axes Options

Box Options

Data Specifications Options
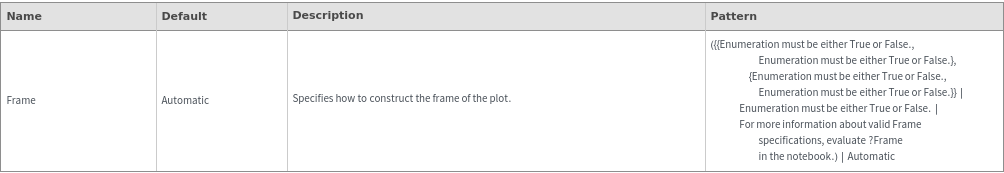
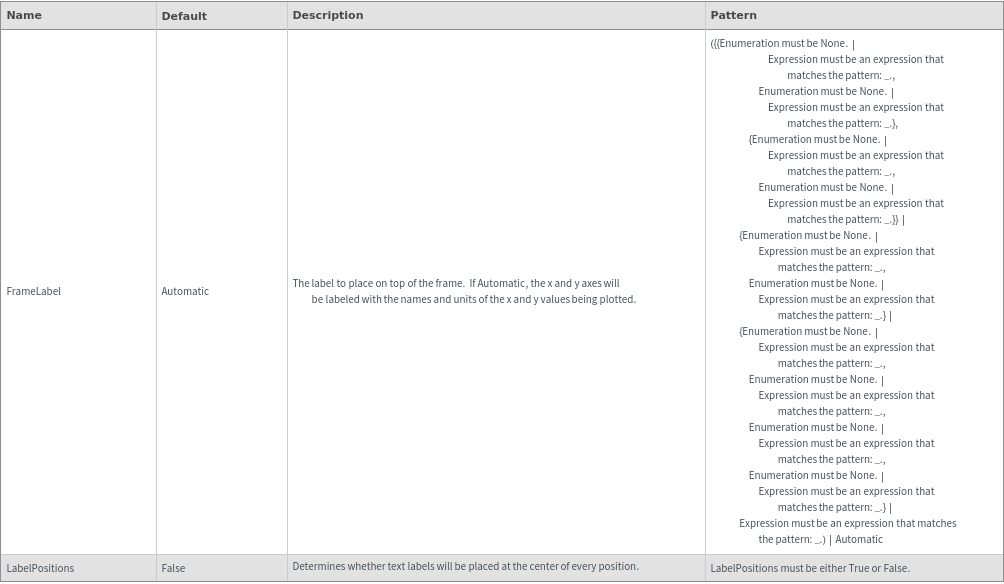
Frame Options
Grid Options
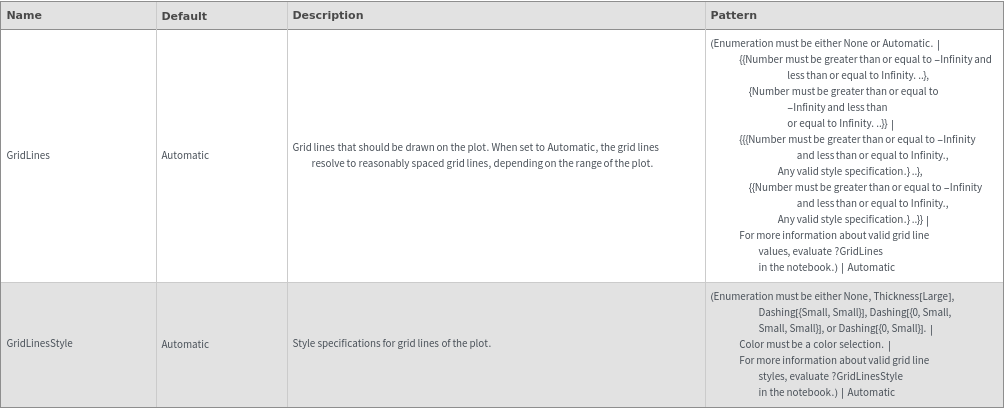
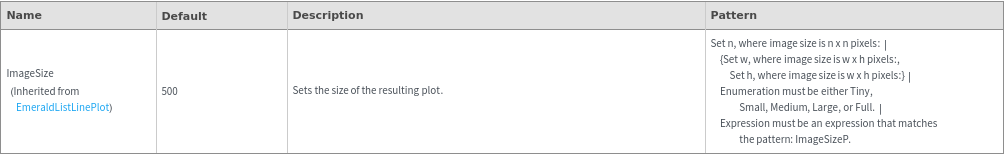
Image Format Options
Plot Labeling Options
Plot Range Options
Plot Style Options
General Options
Messages
Examples
Basic Examples (3)


Additional Examples (4)
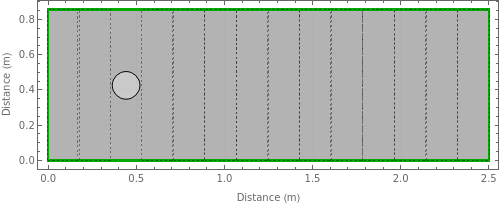
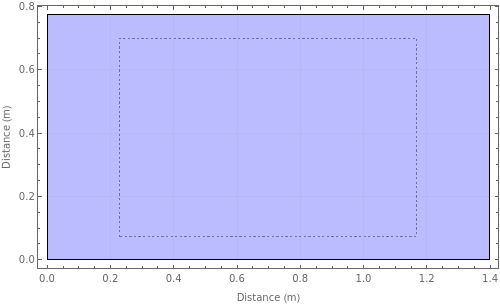
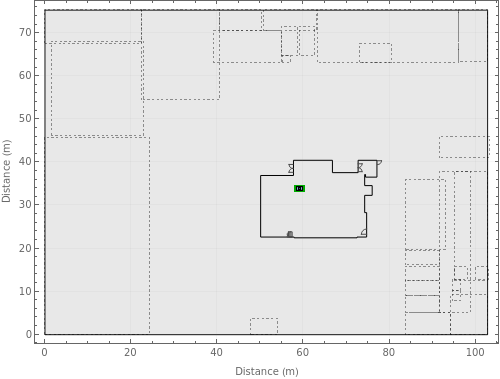
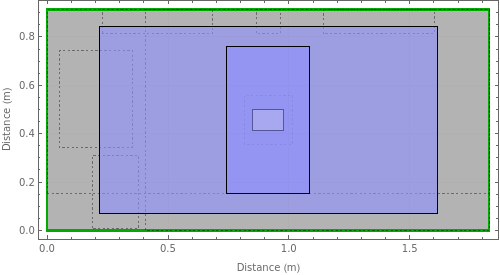
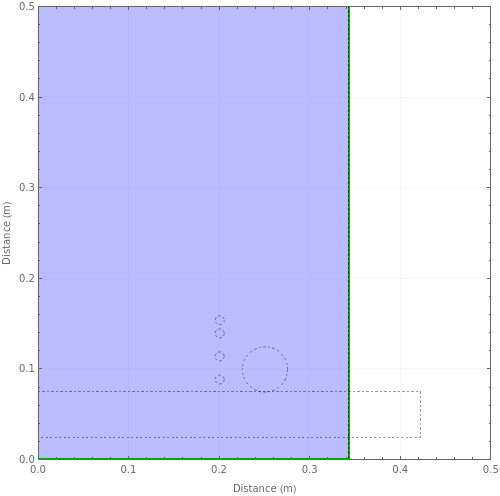
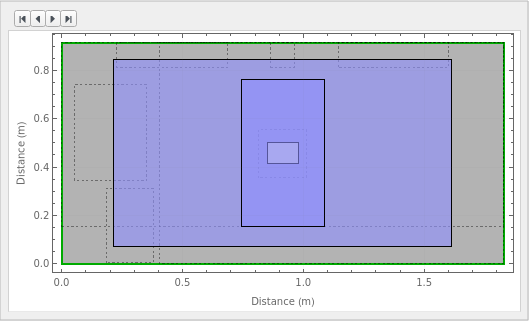
If a valid position is specified, its parent container is plotted and the position highlighted:

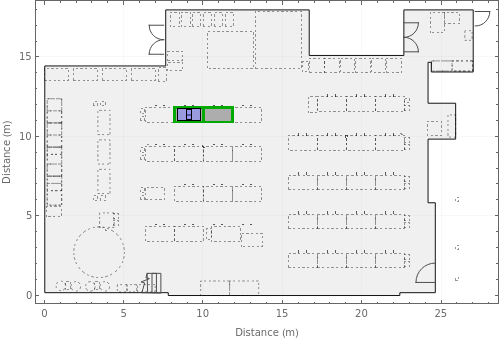
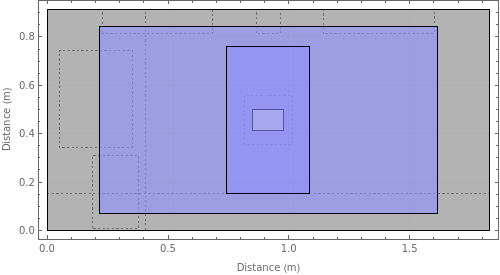
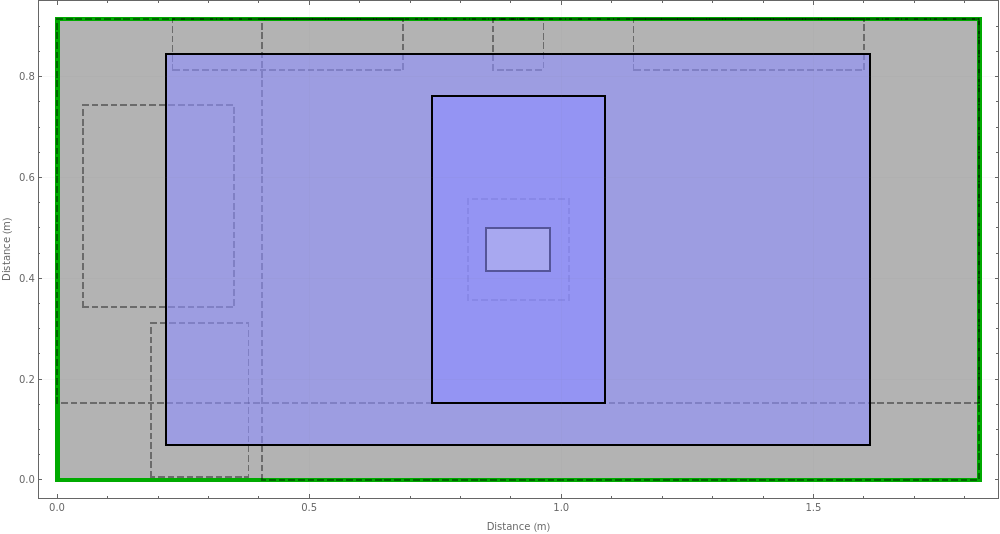
Multiple items whose containers or contents overlap given the provided 'Levels'/'Nearest' options can be plotted together, generating a single plot:

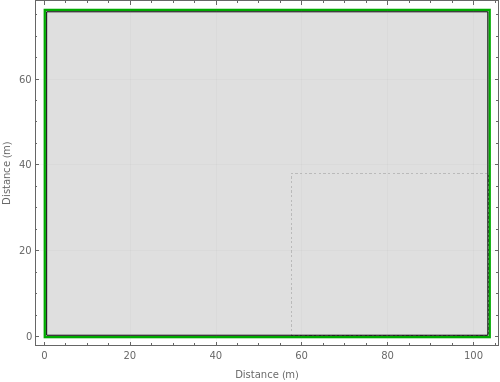
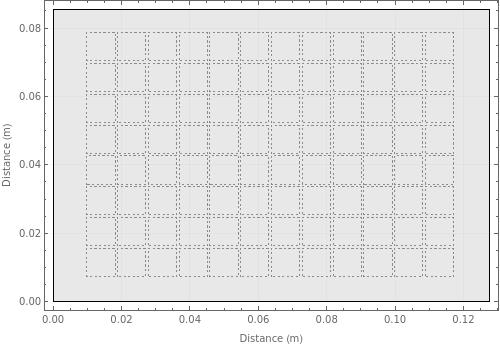
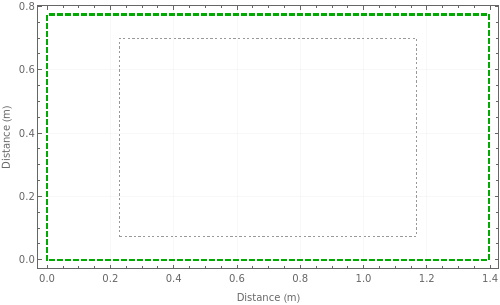
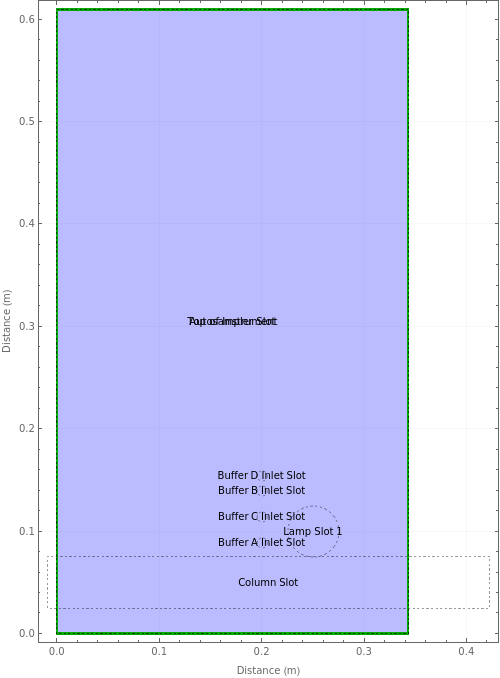
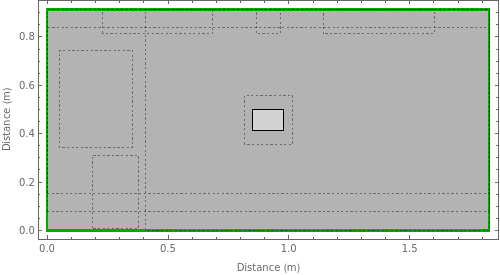
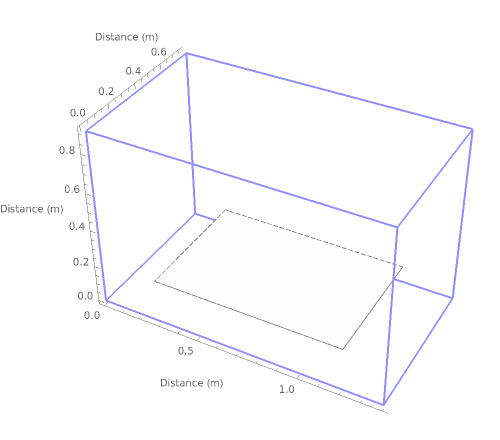
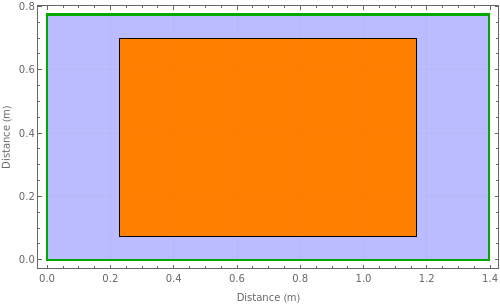
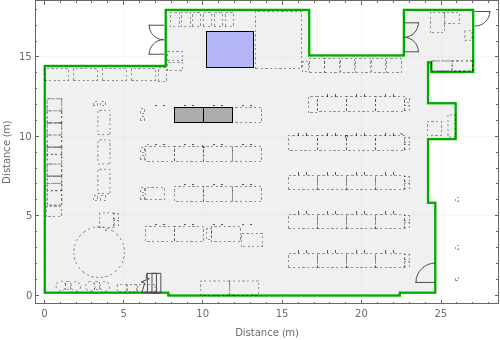
Plot the layout of a container model:

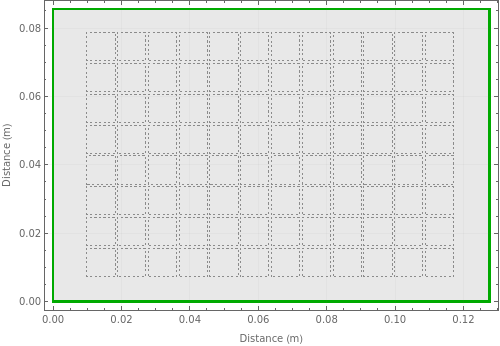
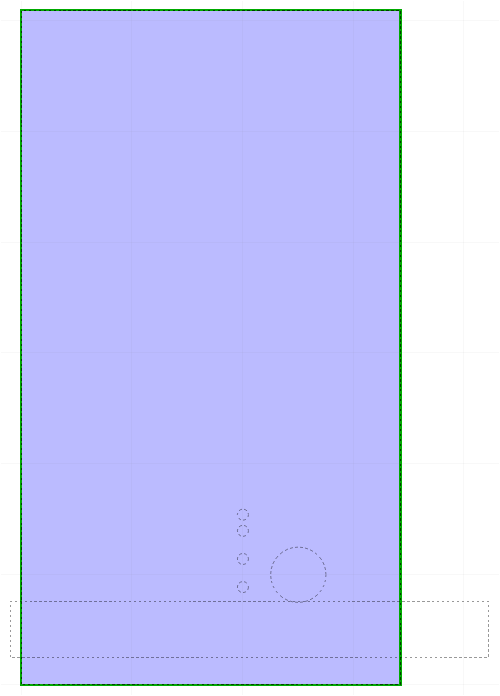
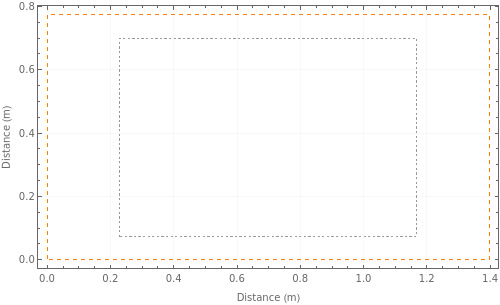
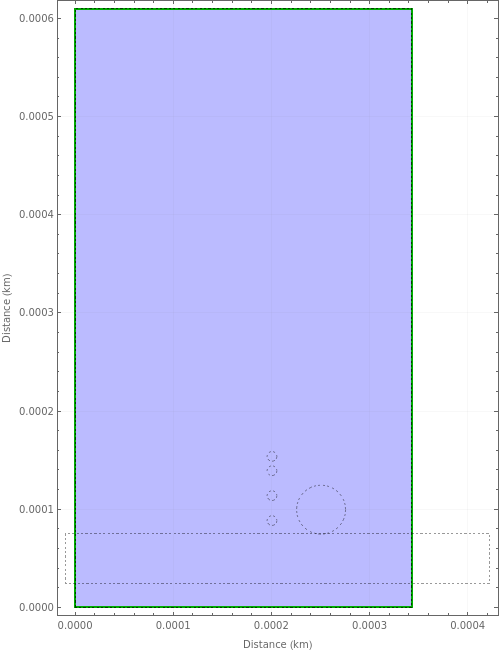
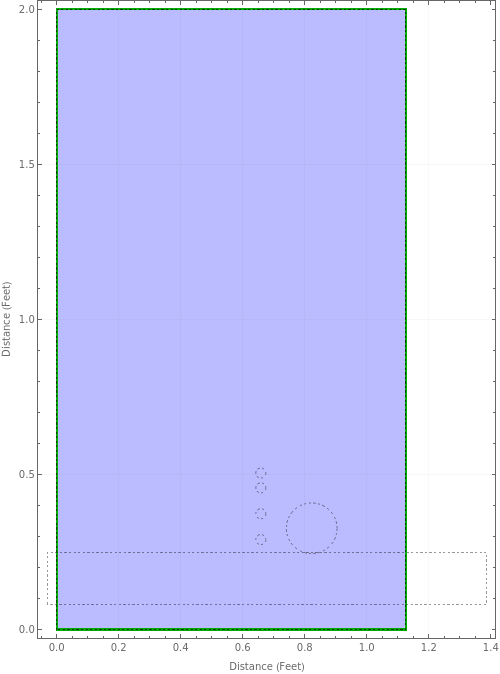
Plotting the contents of an empty container plots the container itself:

Options (18)


Map (2)


NearestDown (1)

NearestUp (1)


Messages (7)
DisconnectedGraph (1)


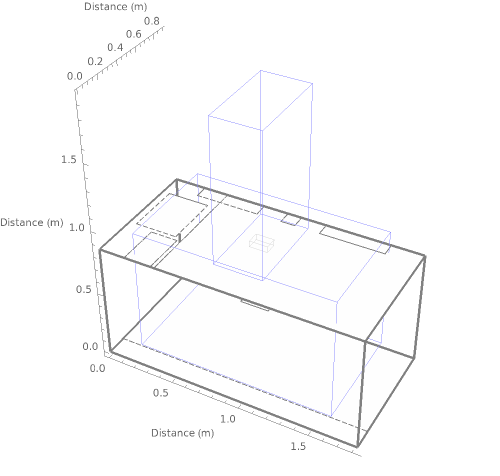
IncompatibleOptions (1)


InvalidObject (1)


InvalidPosition (1)


MismatchedUnits (1)


ModelNotFound (1)


Last modified on Sat 12 Aug 2023 12:43:43