PlotqPCR
PlotqPCR[QPCRData]⟹Fig
plots the normalized and baseline-subtracted amplification curves from QPCRData.
PlotqPCR[Protocol]⟹Plot
creates a Plot of the amplification curves in the data objects found in the Data field of Protocol.
PlotqPCR[MeltingPointAnalysis]⟹Fig
plots the negative derivative of the melting curve data MeltingPointAnalysis.
PlotqPCR[AmplificationCurveData]⟹Fig
plots raw AmplificationCurveData.
Details
- For each input quantitative polymerase chain reaction (qPCR) data object, if there are linked analysis objects, the quantification cycle/copy number information from the most recent analysis for each applicable wavelength pair is displayed as a tooltip.
Input

Output

Data Specifications Options
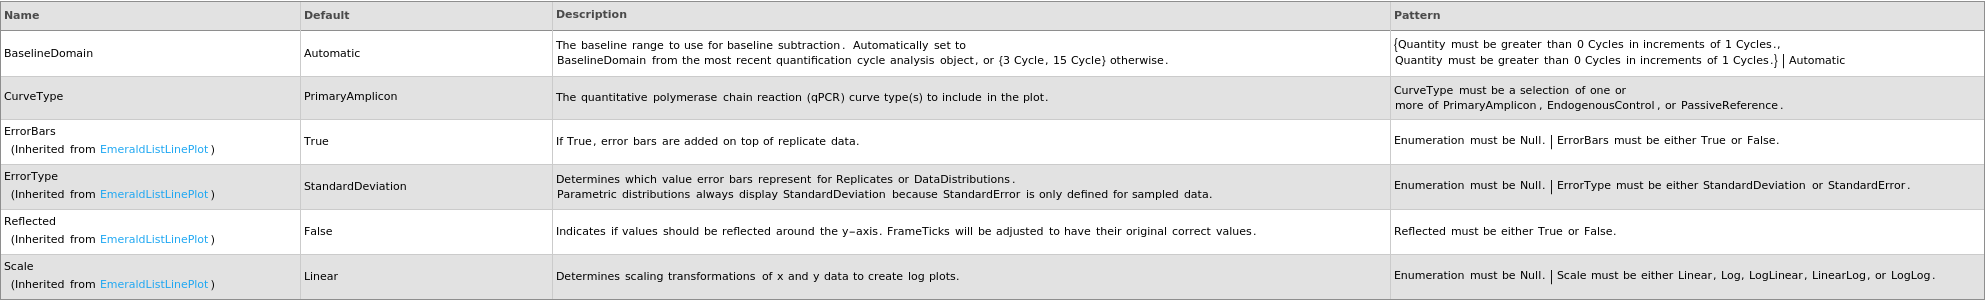
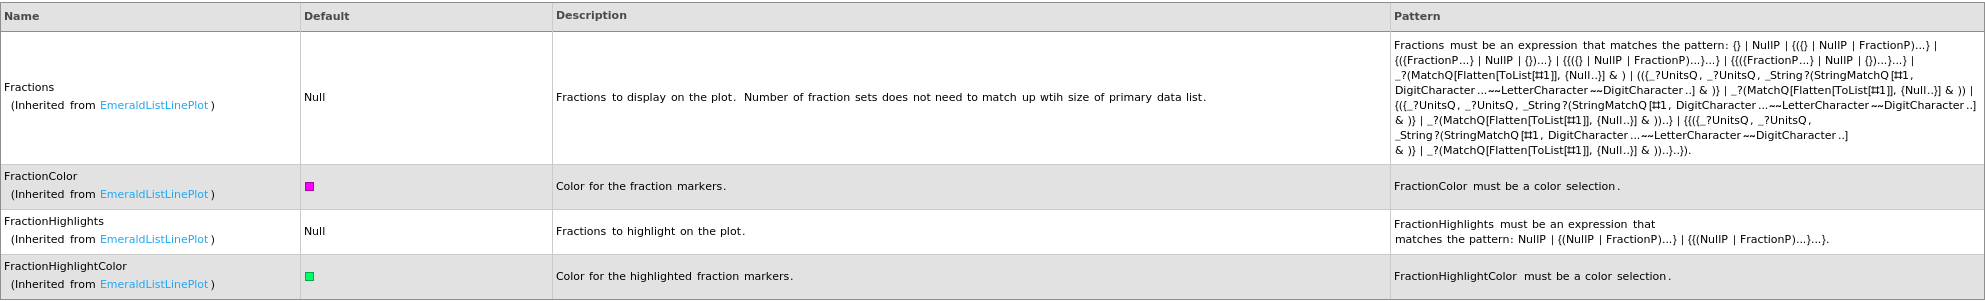
Fractions Options
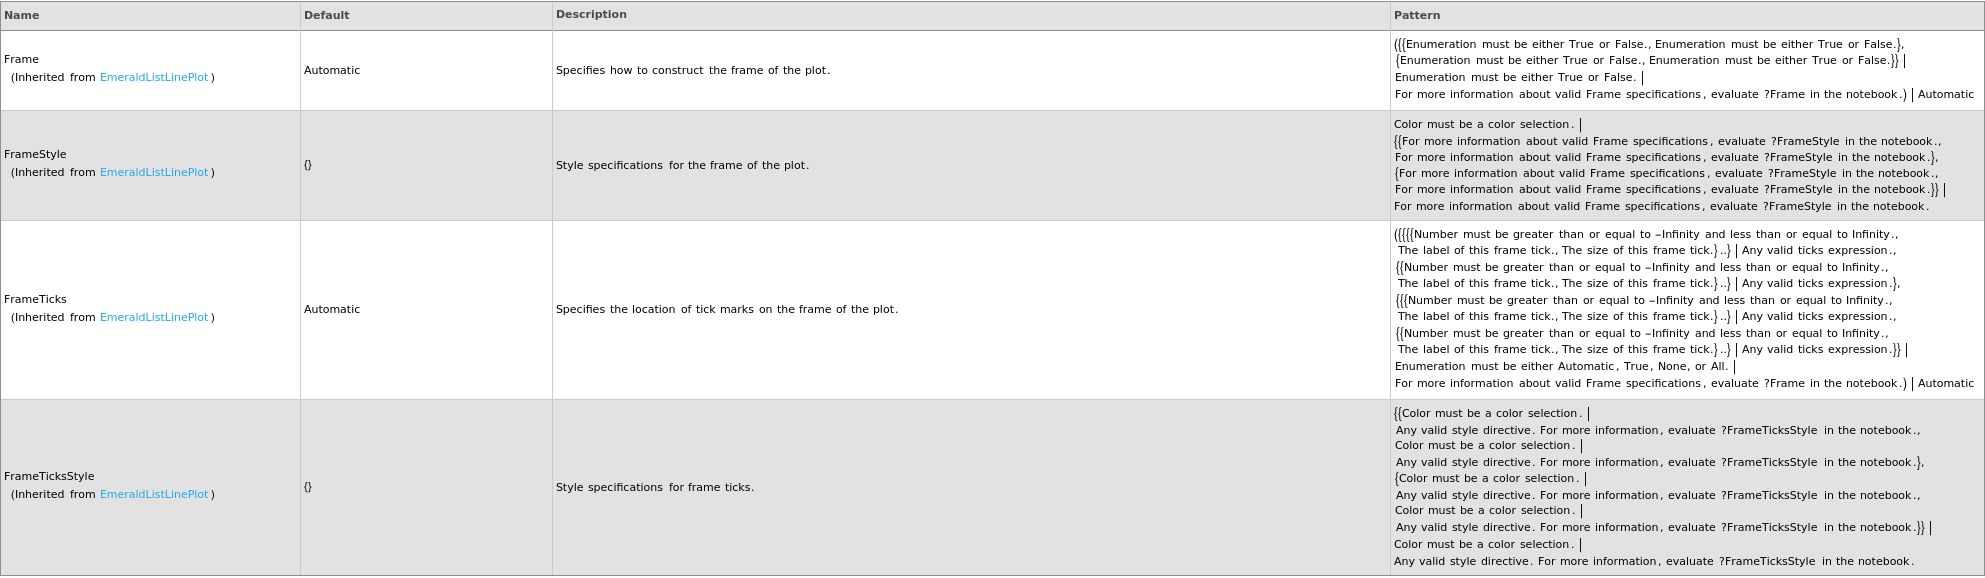
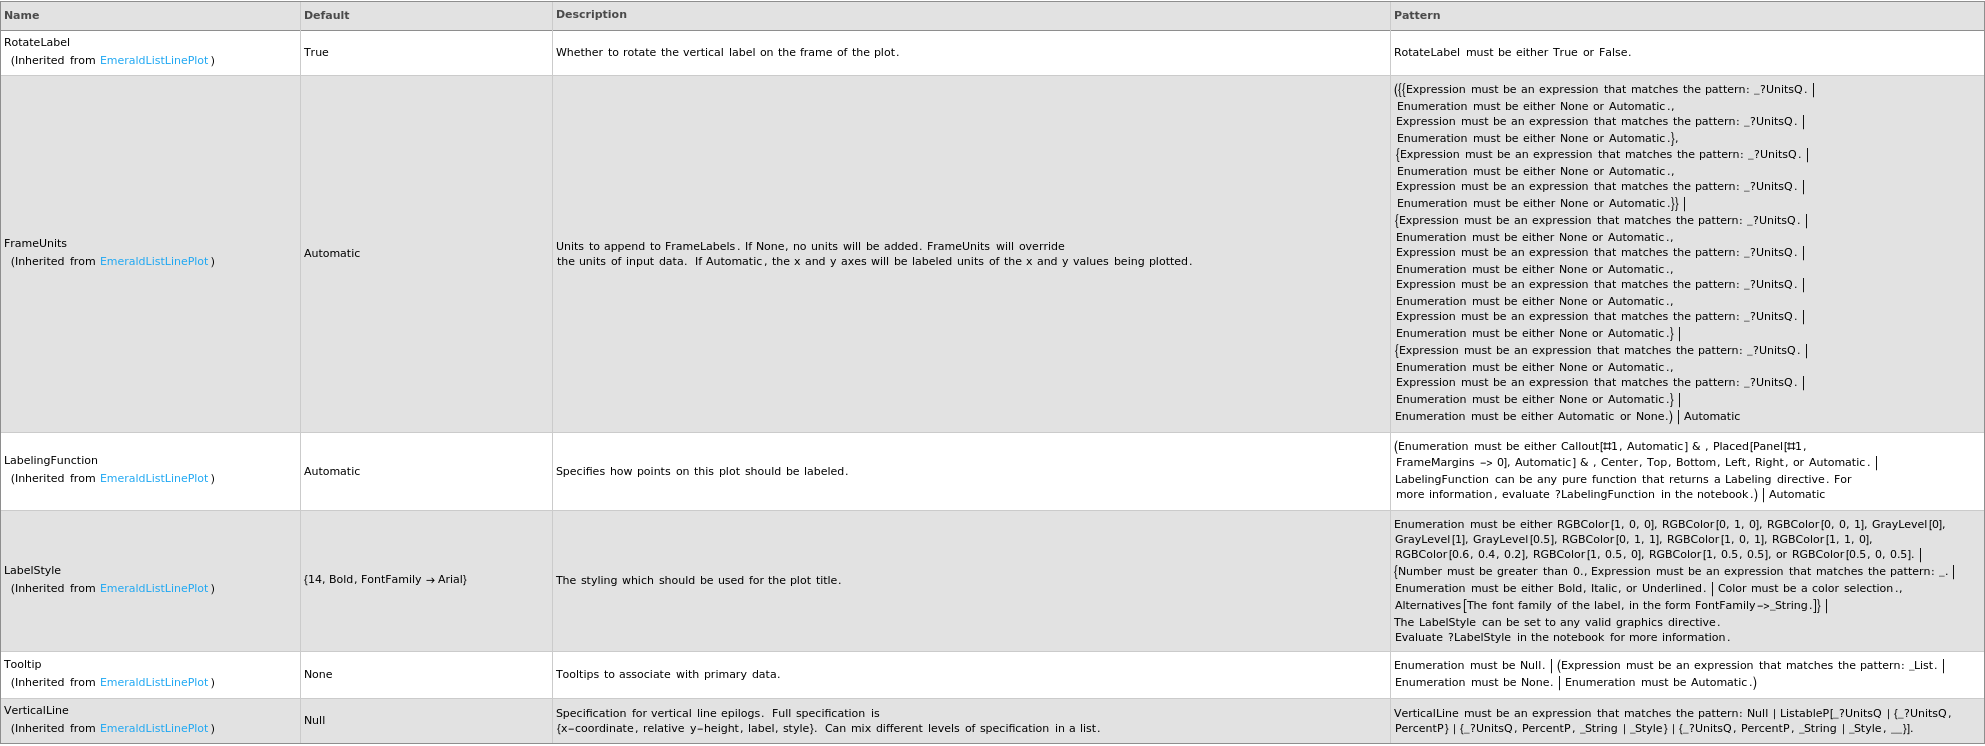
Frame Options
Grid Options
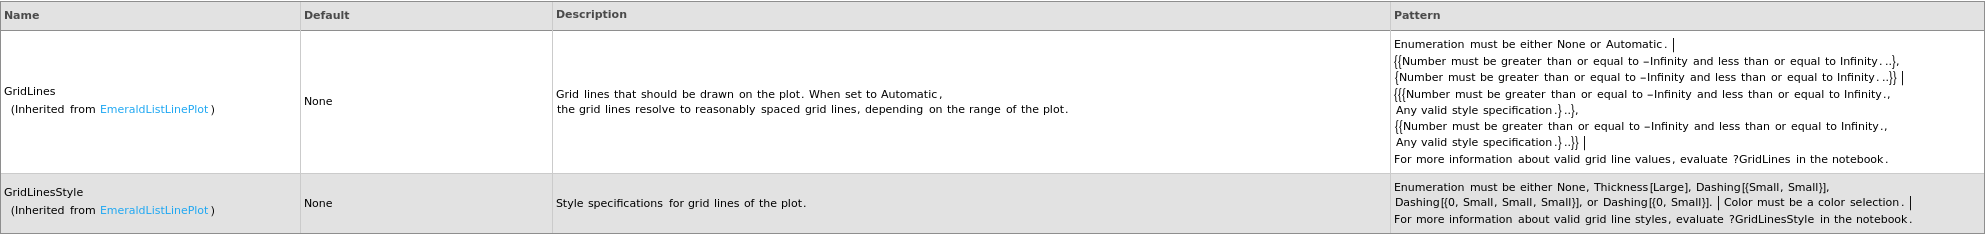
Image Format Options

Ladder Options

Legend Options

Peaks Options
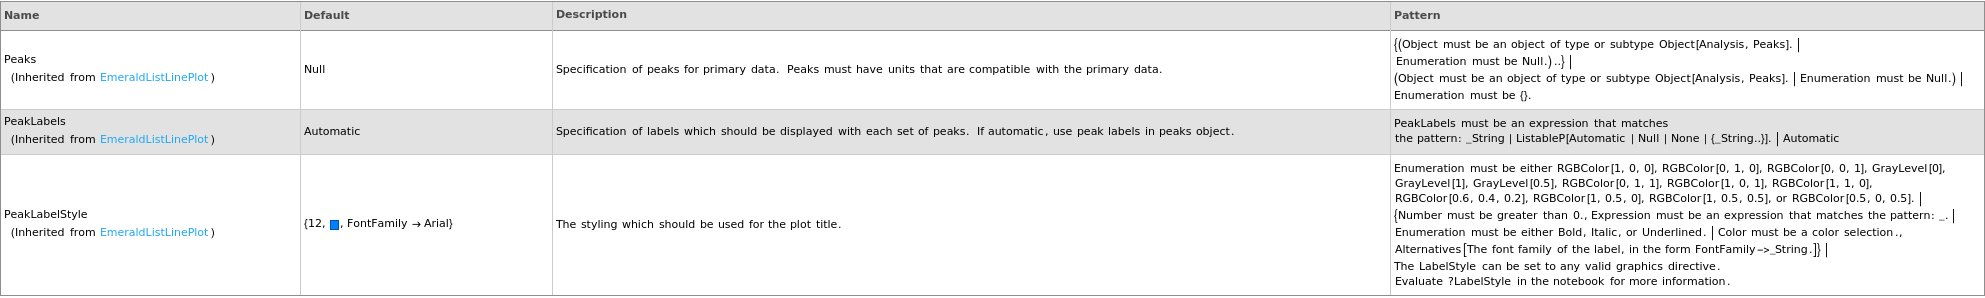
Plot Labeling Options
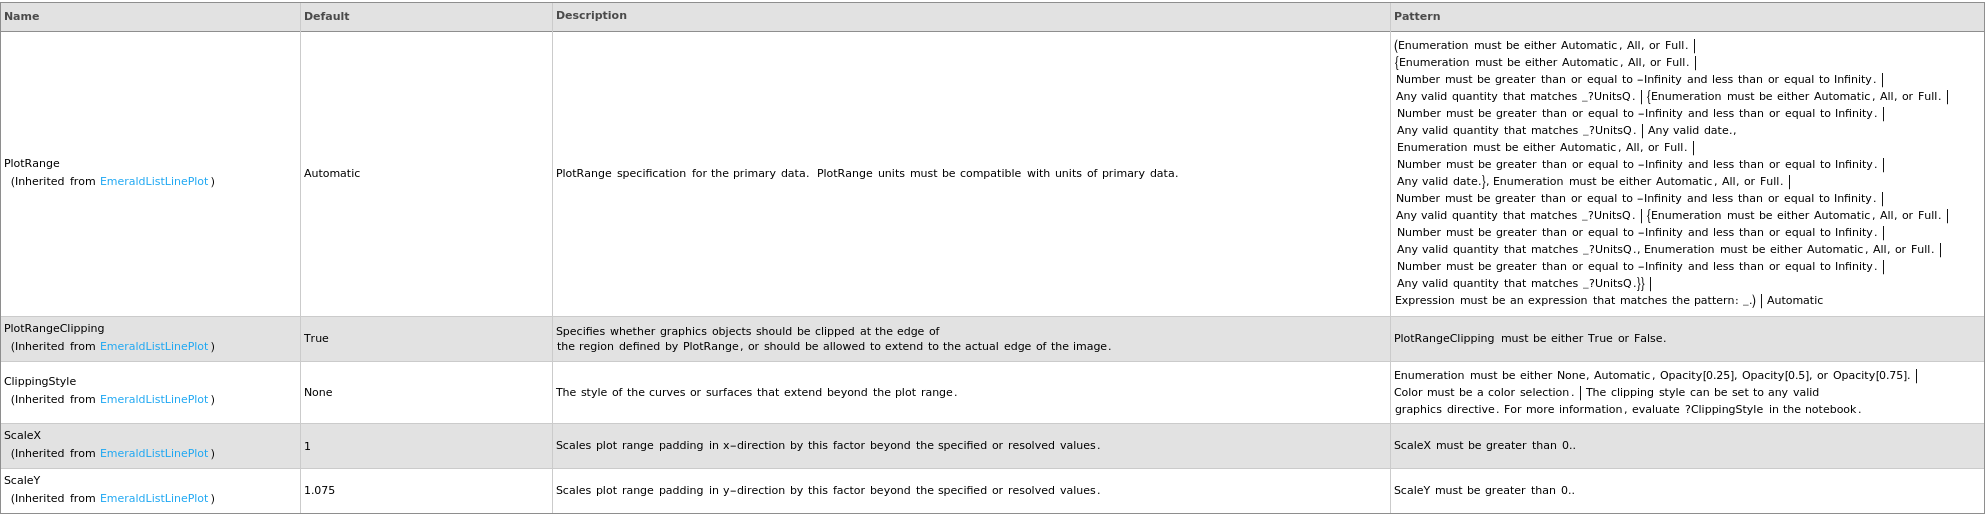
Plot Range Options
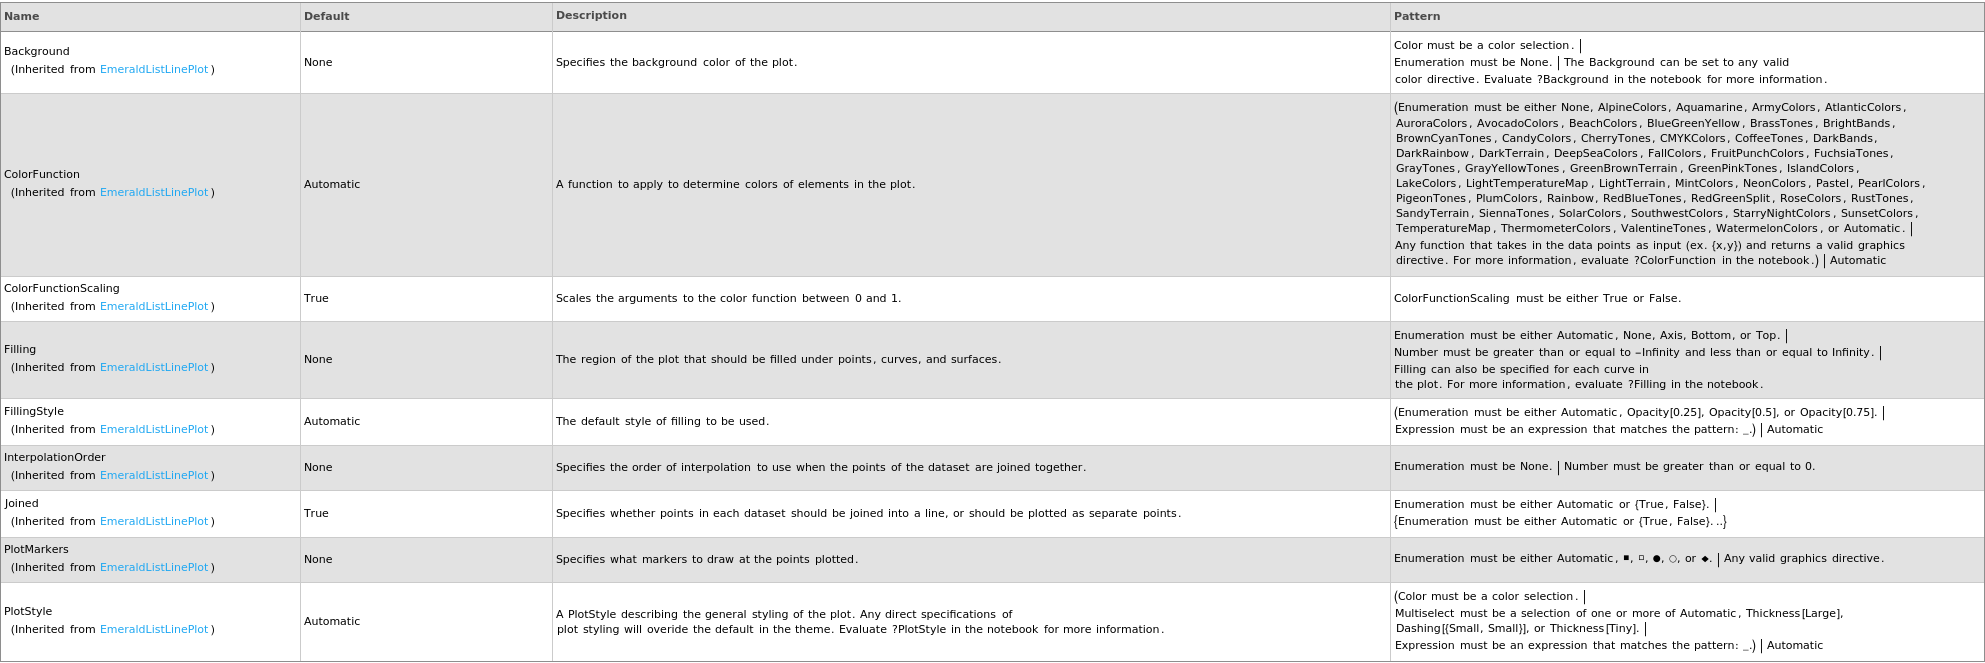
Plot Style Options
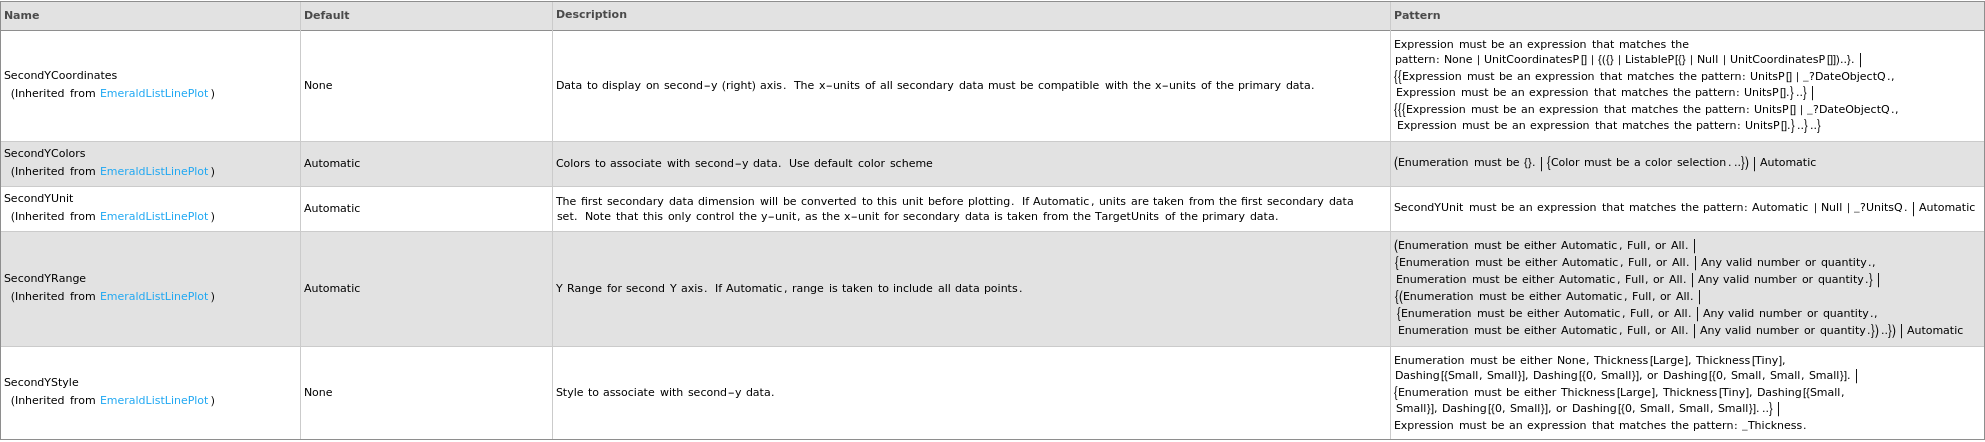
Secondary Data Options
General Options

Examples
open allclose allBasic Examples (4)
Given an Object[Analysis, MeltingPoint] packet generated from Object[Data, qPCR], plot the melting curve as the negative derivative:
Given a qPCR data object, creates a plot for the applicable normalized and baseline-subtracted amplification curves. If there are linked analysis objects, the quantification cycle/copy number information from the most recent analysis for each applicable wavelength pair is displayed as a tooltip:
Given a qPCR protocol object, creates a plot for the linked data objects. If there are linked analysis objects, the quantification cycle/copy number information from the most recent analysis for each applicable wavelength pair is displayed as a tooltip:
Given multiple qPCR data objects, creates a plot for the applicable normalized and baseline-subtracted amplification curves. For each data object, if there are linked analysis objects, the quantification cycle/copy number information from the most recent analysis for each applicable wavelength pair is displayed as a tooltip:
